Fig. 2
Download original image
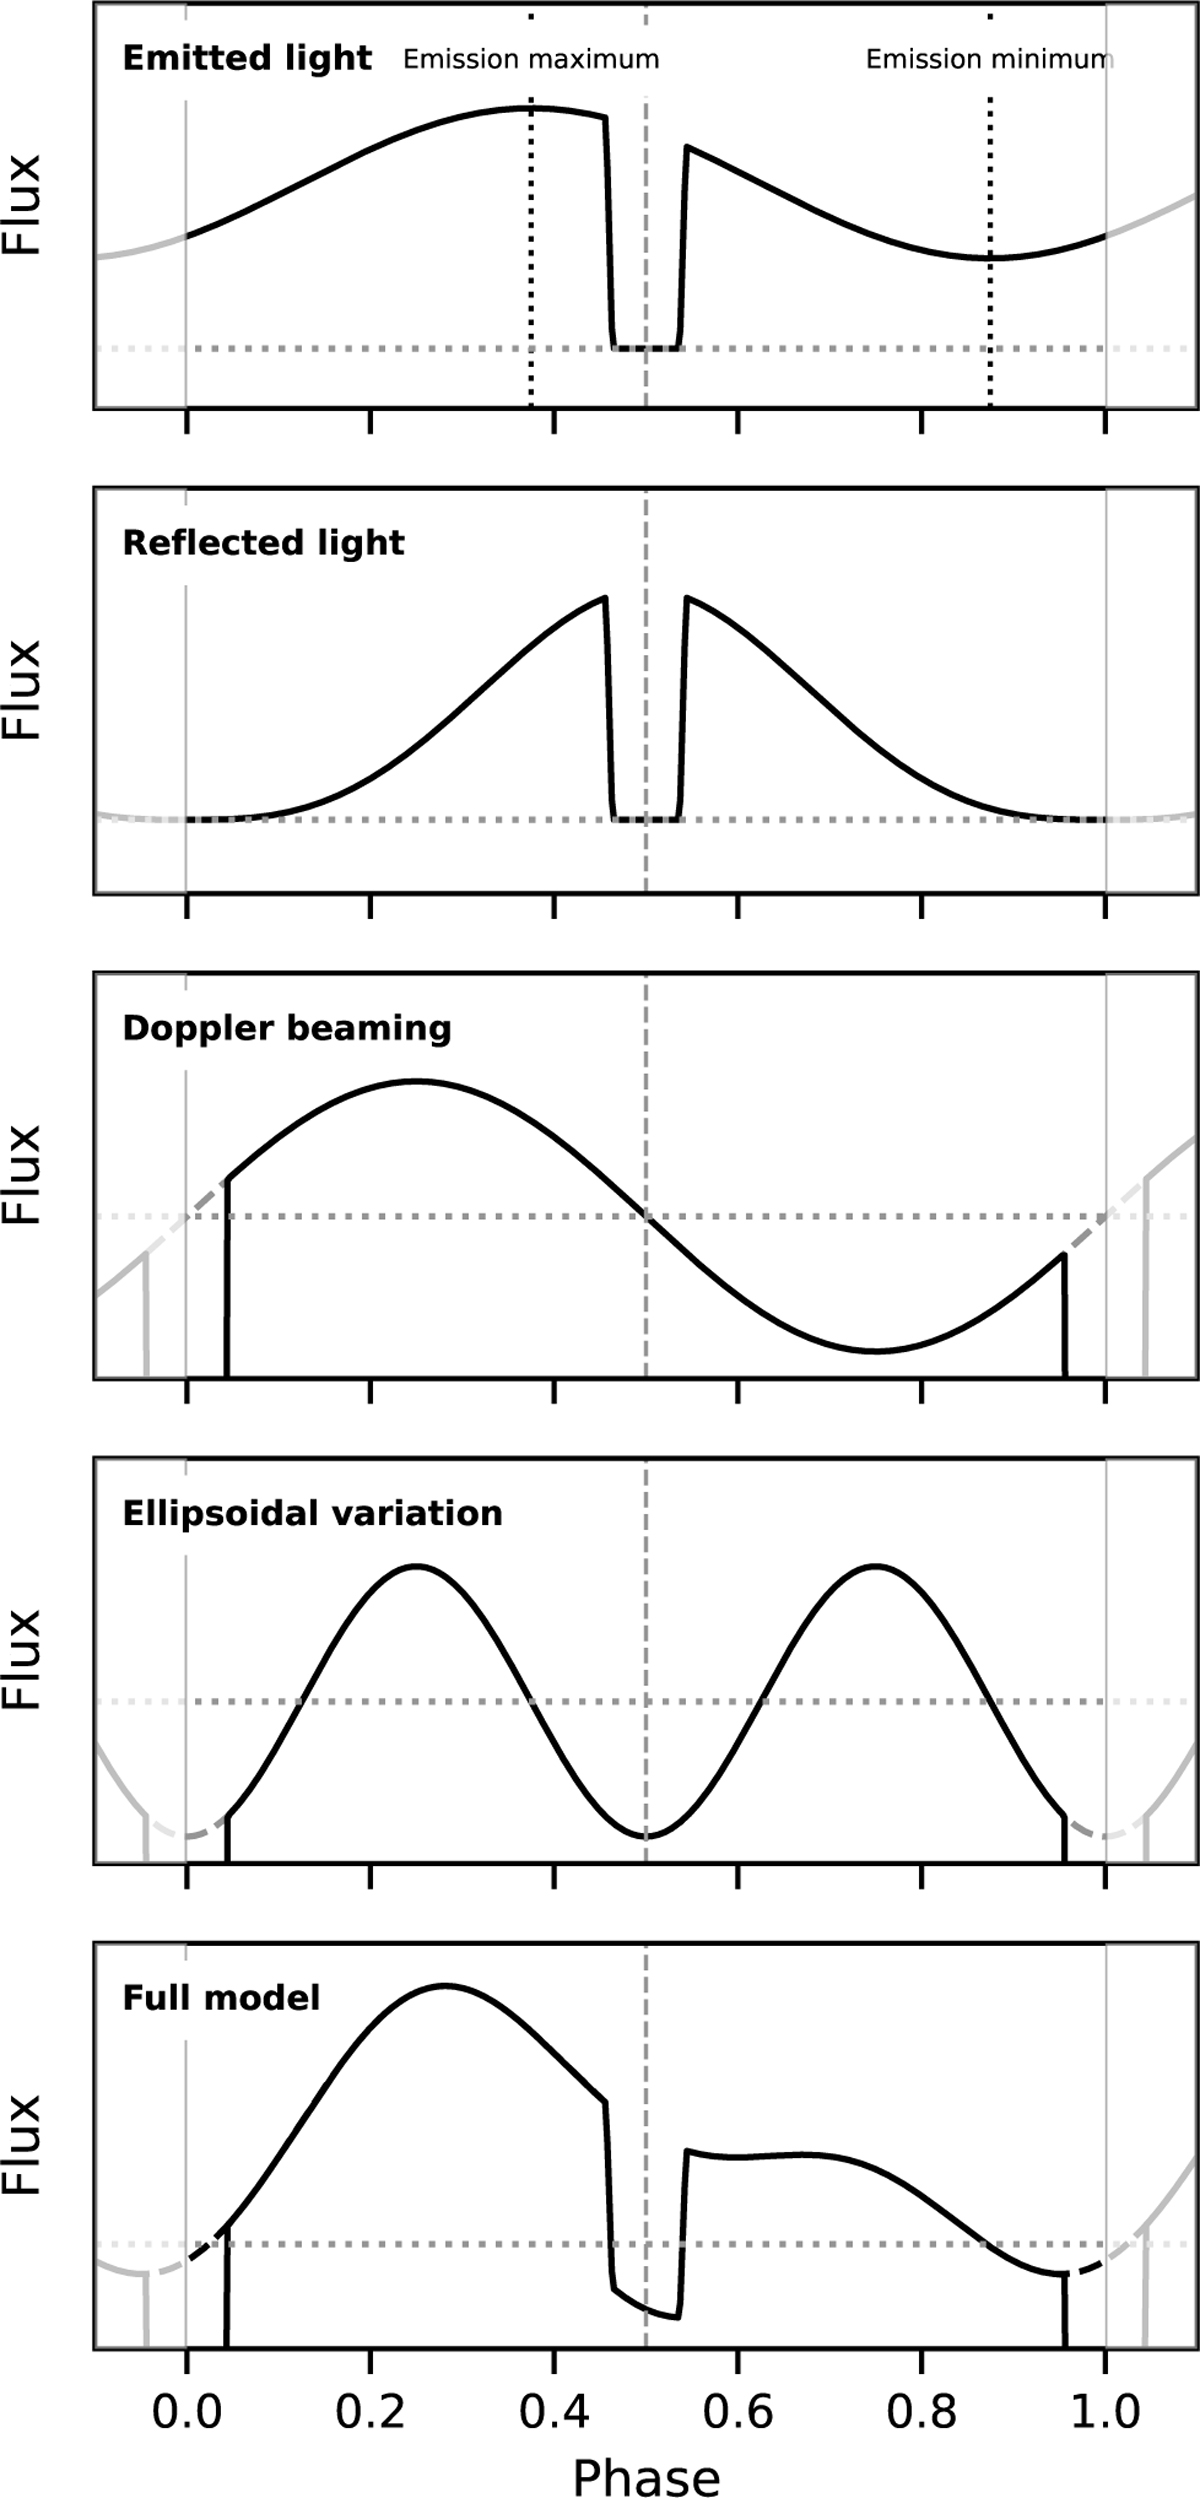
Components of a phase curve model (transit, eclipse, emitted light, reflected light, Doppler beaming, and ellipsoidal variation) and the full model. The figure is centred around the secondary eclipse, the horizontal dotted line shows the baseline level (flux = 1), the vertical dashed line shows the eclipse centre, and the solid grey line shows the transit centre.
Current usage metrics show cumulative count of Article Views (full-text article views including HTML views, PDF and ePub downloads, according to the available data) and Abstracts Views on Vision4Press platform.
Data correspond to usage on the plateform after 2015. The current usage metrics is available 48-96 hours after online publication and is updated daily on week days.
Initial download of the metrics may take a while.