Fig. D.1
Download original image
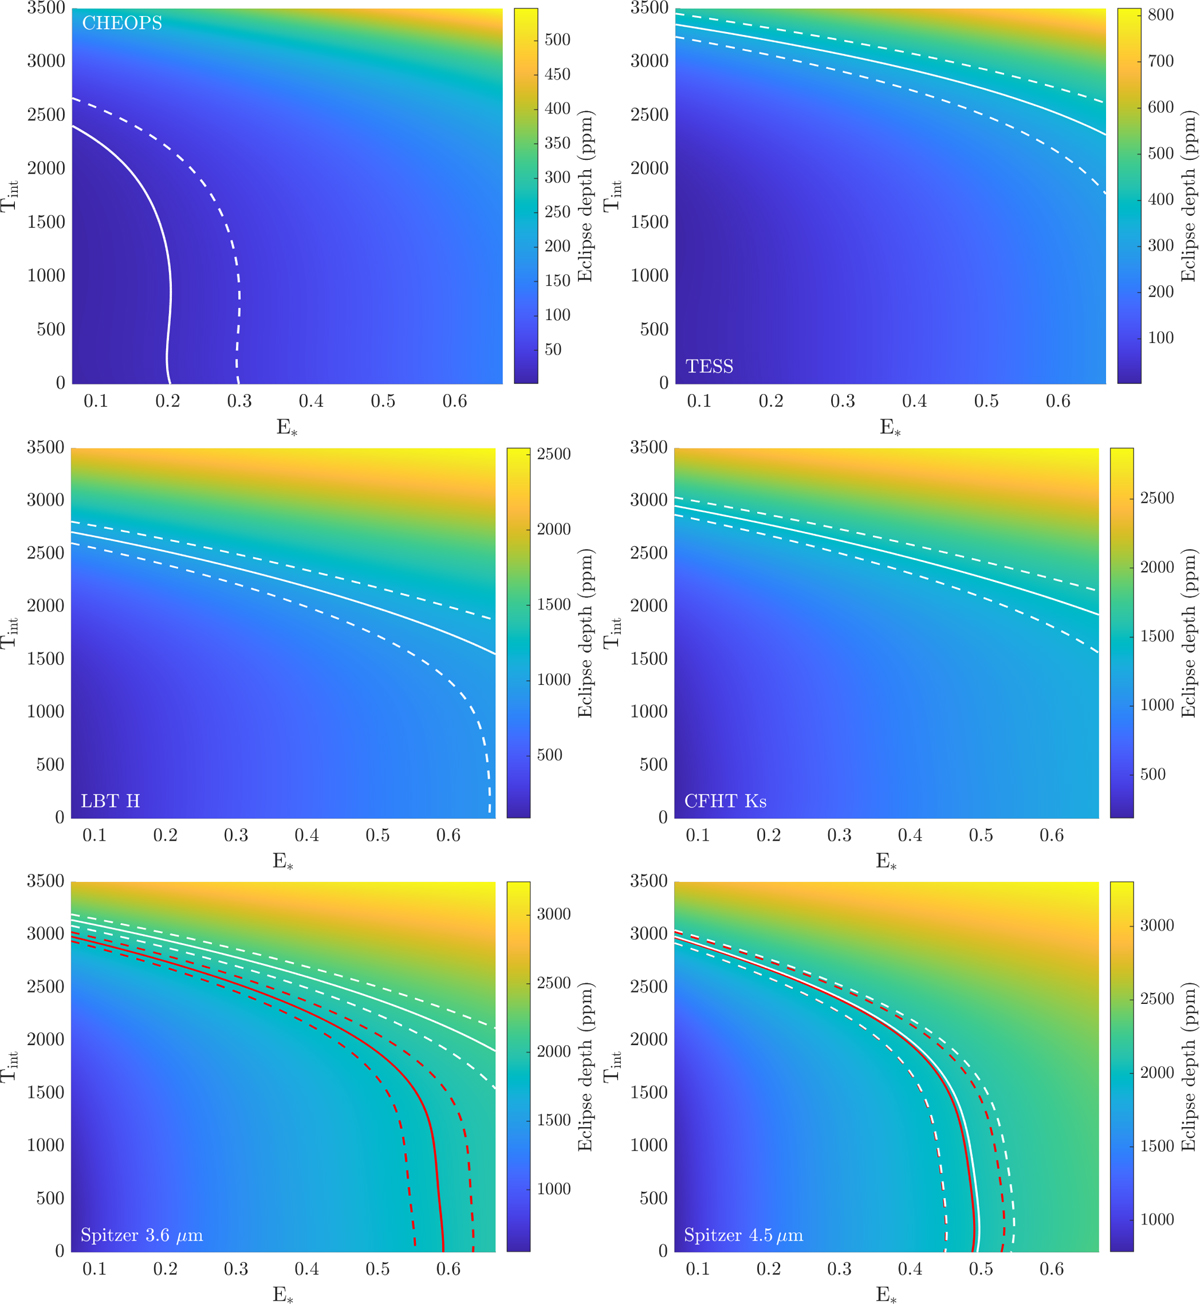
Eclipse depths in ppm as a function of the internal temperature Tint and the parameter E* based on the HELIOS model calculations described in Sect. 6.4. The six panels show the eclipse depths in the various passbands. White, solid lines depict the measured occultation depths from Table 4, dashed lines refer to their 1σ error bars. The red lines for the two Spitzer passbands refer to the eclipse depths reported by Beatty et al. (2019).
Current usage metrics show cumulative count of Article Views (full-text article views including HTML views, PDF and ePub downloads, according to the available data) and Abstracts Views on Vision4Press platform.
Data correspond to usage on the plateform after 2015. The current usage metrics is available 48-96 hours after online publication and is updated daily on week days.
Initial download of the metrics may take a while.