Fig. A.2
Download original image
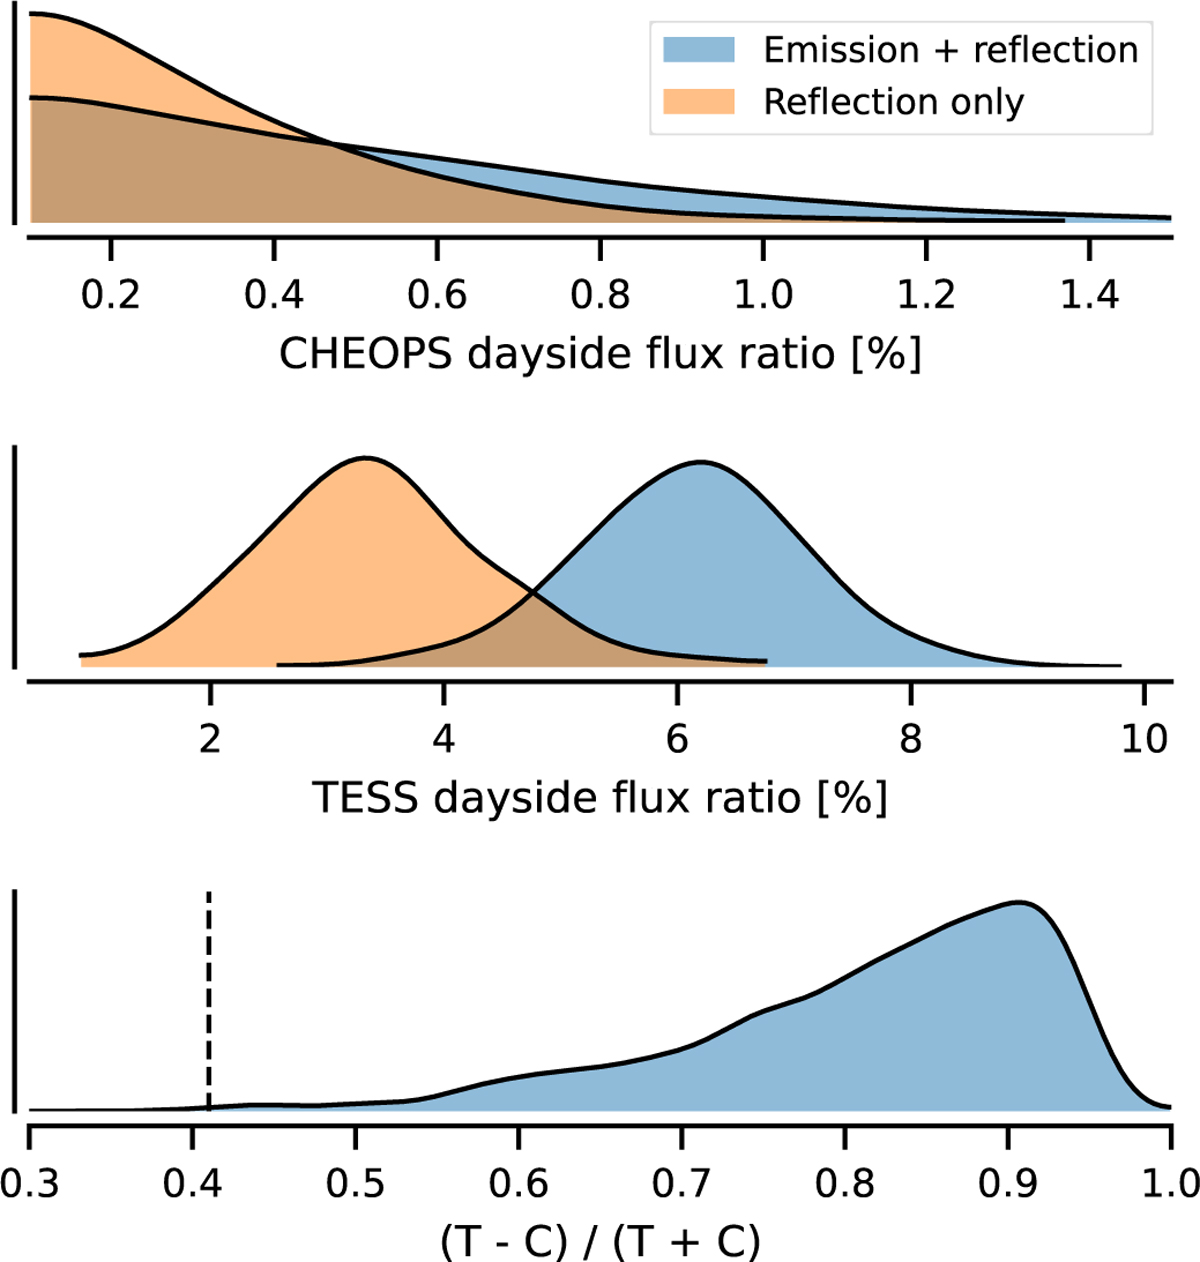
Top and middle: original CHEOPS and TESS dayside flux ratio distribution estimates together with versions of the distributions with the thermal emission removed as described in Appendix A.2. Bottom: the final TESS to CHEOPS contrast (C) distribution and the maximum C of ≈ 0.4 from the albedo spectrum modelling is marked with a dashed vertical line.
Current usage metrics show cumulative count of Article Views (full-text article views including HTML views, PDF and ePub downloads, according to the available data) and Abstracts Views on Vision4Press platform.
Data correspond to usage on the plateform after 2015. The current usage metrics is available 48-96 hours after online publication and is updated daily on week days.
Initial download of the metrics may take a while.