Fig. 11
Download original image
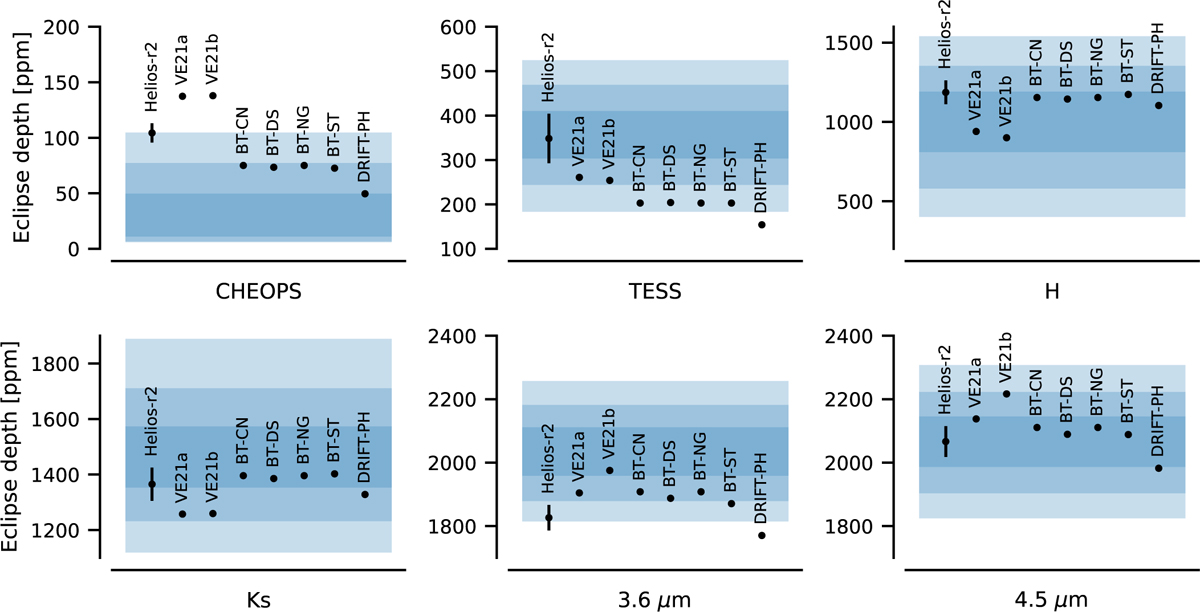
Comparison between different emission spectrum models. The shaded areas show the 68%, 95%, and 99.7% central posterior intervals for the eclipse depths as estimated from the joint modelling, and the black points show the passband-integrated emission spectrum models. Helios-r2 corresponds to the model presented here, VE21a and VE21b to the models in von Essen et al. (2021), BT-CN, BT-DS, BT-NG, and BT-ST to the best-fitting BT-Cond, BT-Dusty, BT-NextGen, and BT-Settl models by Allard (2013), respectively, and DRIFT-PH to the best-fitting Drift-PHOENIX model (Witte et al. 2011).
Current usage metrics show cumulative count of Article Views (full-text article views including HTML views, PDF and ePub downloads, according to the available data) and Abstracts Views on Vision4Press platform.
Data correspond to usage on the plateform after 2015. The current usage metrics is available 48-96 hours after online publication and is updated daily on week days.
Initial download of the metrics may take a while.