| Issue |
A&A
Volume 667, November 2022
|
|
|---|---|---|
| Article Number | A66 | |
| Number of page(s) | 11 | |
| Section | Extragalactic astronomy | |
| DOI | https://doi.org/10.1051/0004-6361/202244714 | |
| Published online | 07 November 2022 | |
New insights into the Triangulum Australis supercluster of galaxies⋆
1
Instituto de Astrofísica, Facultad de Física, Pontificia Universidad Católica de Chile, Casilla 306, Santiago 22, Chile
e-mail: This email address is being protected from spambots. You need JavaScript enabled to view it.
2
GEPI – Observatoire de Paris, 92195 Meudon Principal Cedex, France
e-mail: This email address is being protected from spambots. You need JavaScript enabled to view it.
3
Instituto de Astronomía y Ciencias Planetarias, Universidad de Atacama, Copayapu 485, Copiapó, Chile
e-mail: This email address is being protected from spambots. You need JavaScript enabled to view it.
4
Millennium Institute of Astrophysics, Nuncio Monsenor Sotero Sanz 100, Of. 104, Providencia, Santiago, Chile
5
Max Planck Institüt für Extraterrestrische Physik, Giessenbach Strasse 1, 85748 Garching, Germany
Received:
8
August
2022
Accepted:
15
September
2022
Abstract
The Triangulum Australis cluster is one of about a dozen nearby massive cluster systems which contribute to the gravitational pull behind the so-called Great Attractor that is dominated by the nearby Shapley Supercluster mass, which conforms the galaxy velocity flows observed in that general direction. Here, we study the structure and dynamical mass of the Triangulum Australis cluster together with the neighbouring cluster AS0794. We present a set of 131 velocities collected in the regions of the two clusters with the 2.5 m Du Pont telescope at Las Campanas Observatory (Chile). For the Triangulum Australis cluster we find a dynamical mass of about Mv = 4.2 (±1.3) × 1015 M⊙ and for AS0794 a value of about Mv = 1.7 (±1.3) × 1013 M⊙. These values are consistent with the observed X-ray luminosities of these clusters. Combined with velocities already known we reanalyse the structure and dynamics of this general region, finding that both clusters, together with at least eight other ones, form a large supercluster, centered on TriAus (which dominates in terms of mass). We find that this supercluster is part of a large-scale structure filament linked to the Shapley supercluster (SSC). Uncertainties remain on the richness and detailed structure of this filament and the TriAus supercluster because parts of it remain hidden behind the Galaxy disk.
Key words: galaxies: clusters: general / galaxies: distances and redshifts
Based on observations made with the 2.50 m Du Pont Telescope at the Las Campanas Observatory (Chile).
© H. Quintana et al. 2022
 Open Access article, published by EDP Sciences, under the terms of the Creative Commons Attribution License (https://creativecommons.org/licenses/by/4.0), which permits unrestricted use, distribution, and reproduction in any medium, provided the original work is properly cited.
This article is published in open access under the Subscribe-to-Open model. This email address is being protected from spambots. You need JavaScript enabled to view it. to support open access publication.
1. Introduction
Redshift surveys of clusters of galaxies are needed to study their dynamical and evolutionary state. In clusters, the mean redshift is a key ingredient in deriving distances, allowing for the study of matter distribution on very large scales. Analyses of the velocity distribution within clusters can lead to an estimate of the virial mass, thus helping to constrain models of the dark matter content. Dynamical mass estimates complement measurements at other wavelengths, in particular, those obtained through X-ray observations of clusters. Discrepancies sometimes found between optical, spectroscopic and X-ray masses often point to substantial substructures in the cluster systems (e.g., Girardi et al. 1998; Cypriano et al. 2005). Virial mass estimates rely on the assumption of dynamical equilibrium.
In this paper, we build upon previous studies of the dynamical status of the Triangulum Australis (TriAus) complex cluster of galaxies with the addition of a new set of velocities obtained for the two clusters, Triangulum Australis itself and AS0794, with the Du Pont 2.50 m telescope at Las Campanas observatory (Chile). The TriAus cluster at RA = 16h38m18.2s Dec = −64° 21′37″ J2000 (DSS position of the brightest cluster galaxy, BCG) is a relatively nearby (z = 0.051) bright, hot system which was overlooked in the optical band surveys due to its low galactic latitude. From the ROSAT survey, the X-ray halo has been largely investigated, centered on the BCG (Ajello et al. 2009). Figure 1 shows the X-ray contours of the TriAus from an XMM-Newton observation. It is the 11th X-ray brightest cluster to contribute to the illustration of how important the cluster is in terms of gravitational pull (since X-ray luminosity flags mass). The X-ray peak is a bit diffuse inside a radius about 6 arcsec and its centering is slightly off from the BCG, with an X-ray centre at RA = 16h38m21.8s, Dec = −64° 21′30″ J2000.
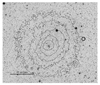 |
Fig. 1. X-ray contours of the Triangulum Australis cluster from an observation with XMM-Newton overlaid on a Digital Sky Survey image. |
The TriAus cluster is part of a larger structure, connected to the Ara cluster at z ≃ 0.05 (RA = 16h53m02.4s Dec = −59° 42′59″ J2000) and separated by only ≃13.7 h−1 Mpc (Woudt et al. 1999; Radburn-Smith et al. 2006). There are other clusters nearby, suggesting the presence of a larger supercluster, with an extension that can continue behind the Milky Way disc. Moreover, since it is in the general direction of the “Great Attractor”, at nearly the same radial recessional velocity as the Shapley supercluster (SSC, Proust et al. 2006; Quintana et al. 2020), it can play a part in “causing” the cosmic flow to that direction. Also, and more generally, it is located in the overall direction of the microwave anisotropy dipole.
The TriAus large structure is also of great interest since all its components are close to the Zone of Avoidance (ZoA), in the direction of the famous “Great Attractor” and its physical properties (redshift dispersion, mass, substructures, etc.) have not been studied in depth until now, due to their low galactic latitude. The first target observed is an area of galaxies, which we temporarily dubbed the “C101 cluster” (for its ESO Survey field number), centered approximately at RA = 16h38mn Dec = −64° 31′ (J2000), which turned to be the TriAus cluster. This target was first optically noticed by us in a serendipitous way based on a CCD small frame of a stellar field taken by one of our team for a colleague. We noticed the unusual number of galaxies for its galactic latitude and we decided to carry out further spectroscopic observations, using the end of allocated nights to observe the Shapley Supercluster, when this main target was too low in the night sky. Later it was pointed to us (Raychaudhury, priv. comm.) that an X-ray source (McHardy et al. 1981), named as 3A1633-644 had been detected, which had been extended and obviously identified with the same optical cluster. It has been observed later with the X-ray satellite ASCA (11.3 and 6.7 ks, Markevitch et al. 1996) and it was found to be a cluster with a hot (12 keV) core at its centre that was most likely produced by a merger. The cluster is close enough (5 arcmin ≃ 300 kpc) so that even at low resolution, a radio halo could be resolved. As part of the development of MeerKAT (Booth et al. 2009), a scientific test array, the Karoo Array Telescope (KAT-7), has been constructed and commissioned at the same site. A high significance diffuse radio emission was discovered in the area of TriAus with the KAT-7 array (Scaife et al. 2015), showing the potential of the array to image extended objects of low surface brightness. These authors compared the radio power from this proposed halo with X-ray and Sunyaev–Zel’dovich (SZ) measurements and demonstrates that it is consistent with the established scaling relations for cluster radio haloes.
The second target is the richness class 0 cluster AS0794 (RA = 17h28mn37.0s Dec = −66° 41′28″ J2000) which has been poorly studied (Ayral & Saurer 2005). However, with a diameter of 6 arcmin and a mean redshift z = 0.0426, this cluster is of importance as it is situated along a filament connecting several clusters, such as AS0797 (z = 0.0482), CGJ1720−67.8 (z = 0.045), CIZA J1638.2−64.20 (z = 0.0508), CIZA J1645.4−73.34 (z = 0.061), and CIZA J1653.0−59.43 (z = 0.048), to the main TriAus supercluster (Chow-Martinez et al. 2014). The X-ray contours from the ROSAT survey show a faint trace of X-ray emission of about 3 photons (above a very low background) with a resulting luminosity of about 1042 erg s−1, which is the typical luminosity of a massive single elliptical or a galaxy group (Kim & Fabbiano 2013). However this emission may be real given the fact that source photons are detected around the two bright galaxies of the cluster, as shown in Fig. 2. We note that no preferred alignment has been noted, as AS0794 and TriAus show isotropy in both their polar and azimuthal angle distributions (Ayral & Saurer 2005).
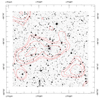 |
Fig. 2. X-ray contours of AS0794 from the ROSAT survey overlaid on a Digital Sky Survey image. |
We collected a new set of velocity data in the direction of these two targets, useful for completing the existing collection of data available in the literature. In this paper, we analyze these two galaxy structures from their spectroscopic properties and we discuss the evolutionary state of the TriAus complex supercluster. In Sect. 2, we present the observations and data reduction. Section 3 contains the results as well as a dynamical analysis of the two clusters, aimed at studying the velocity dispersion in each cluster centre, as well as its variations with the radius until the measured limit of the shear up to 8 arcmin (equivalent to a radius of  Mpc at the cluster redshift). In Sect. 4, we analyze the TriAus supercluster as a whole. We adopt, whenever necessary, H0 = 70 h 70 km s−1 Mpc−1, ΩM = 0.3, and ΩΛ = 0.7.
2. Observations and data reduction
The spectroscopic observations were carried out first using the fiber spectrograph and then the WFCCD, both mounted on the 2.50 m du Pont telescope at Las Campanas Observatory (LCO), Chile (Bowen & Vaughan 1973)1. The multifiber system first used at LCO consists of a plug plate at the focal plane, with 128 fibers running to a spectrograph coupled to the 2D-Frutti detector (Shectman 1989; Quintana et al. 2000). There were 105–112 fibers used for objects while 16 sky fibers were set aside, spaced at intervals of one every 6 fibers along the spectrograph entrance and positioned in a random pattern in the plug plate. Standard quartz lamp exposures of a white spot inside the dome were used to correct for pixel-to-pixel variations of the detector. The grating angle was changed to several values during these long exposures in order to properly illuminate the whole detector surface. Five-minute exposures with helium-neon and thorium-argon hollow cathode comparison lamps were taken for wavelength calibration before and after each exposure. The resulting 2D Frutti images have a 2048 × 1520 pixel area. The fiber images are ≃8 pixels wide, separated by ≃12 pixels from center to center. The exposure times were adjusted between 60 and 180 min, depending on the brightness of the galaxies and the available observing time. The WFCCD is a multislits drilled bronze mask with useful 22 arcmin × 22 arcmin field of view, taking two fields per cluster to cover central region. Blue grism 400 lines mm−1 was used for spectra exposure, with a 2K × 2K CCD, binned 1 × 1 with gain 1. We took 3–4900 s exposures per field and He–Ar comparison lamps taken before and immediately after each set of exposures. Table 1 summarizes the observing sessions and instrumentation used.
Observing sessions and instrumentation used.
The data reduction was carried out at Paris observatory, Meudon campus, in order to obtain wavelength calibrated spectra then velocities. We reduced the data with the MULTIRED package (Le Fèvre et al. 1995) of IRAF2 performing the following steps in sequence for each slit: (1) We extracted small 2D postage-stamp images corresponding to one slit from the two dimensional spectra of the object and the corresponding wavelength calibration and flat field from the full 2048 × 1520 pixel images. (2) We performed a flat-field correction and sky emission subtraction: the sky was fitted with adjustable low-order polynomials and subtracted along the slit for each wavelength element. A treatment of the zero-order position was also added. (3) We combined all the corrected two-dimensional spectra of a given object with average or median scheme using sigma-clipping rejection. (4) We extracted a one-dimensional spectrum of the arc-lamps and cross-correlated it with a reference arc-lamp spectrum to produce an initial wavelength solution. (5) We extracted a one-dimensional spectrum from the corrected two-dimensional spectrum for each object of interest in the slit by averaging along the wavelength axis. (6) We obtained the wavelength for the one-dimensional object spectrum and plotted the corrected and calibrated one-dimensional spectrum.
The radial velocities were determined using the cross-correlation technique (Tonry & Davis 1979) implemented in XCSAO task of the RVSAO package (Kurtz et al. 1991; Mink et al. 1995), with the spectra of radial velocity standards of late-type stars (Pickles 1998) and previously well-studied galaxies (Pickles 1985). The values of their R statistics (defined as the ratio of the correlation peak height to the amplitude of the antisymmetric noise) are listed in Table A.1, along with the measured velocities and their formal uncertainties. For spectra with R ≺ 3.0, the measured velocity was considered unreliable and was not used, except for emission-line objects where the velocity was obtained using the EMSAO task implemented in the RVSAO package.
2.1. X-ray data
For the study of the Triangulum Australis cluster in X-rays, we used data from an observation with XMM-Newton with the observation ID 0093620101. The exposure time is 9, 9.8, and 3.2 ks for the MOS1, MOS2, and PN detectors respectively. The exposures have been cleaned from times affected by solar flares. For the image analysis, we focused on the 0.5–2 keV energy band, since this provides the best signal to noise ratio (S/N) above the background.
To obtain an overview on the place of the Triangulum Australis cluster in the large-scale structure environment, we use the results of the identification of galaxy clusters in the ROSAT All-Sky Survey (Trümper 1993). Clusters have been identified in a systematic, highly complete survey outside the zone of highest galactic absorption (hydrogen column density larger than 2.5 × 1021 cm−2) in the CLASSIX galaxy cluster survey (Böhringer et al. 2016), which combines the previous REFLEX and NORAS surveys (Böhringer et al. 2013, 2017). The survey reaches an X-ray flux limit of FX = 1.8 × 10⁻¹² erg s−1 cm−2 in the 0.1–2.4 keV energy band and covers 8.25 ster of the sky. We discuss the cluster environment of the Triangulum Australis in Sect. 5.
3. Velocities catalogue
From the observing runs, we obtained a set of 131 heliocentric radial recessional velocities (some of them were observed two times) belonging to the two clusters, namely: 76 for TriAus and 55 for AS0794). Table A.1 in Appendix A lists the details of these new observations: (1) object number, (2) right ascension (J2000), (3) declination (J2000), (4) heliocentric radial recessional velocity in km s−1, (5) associated error in km s−1, (6) R value from Tonry & Davis (1979) and (7) notes.
Some galaxies have been previously observed and adding their velocities available from the NED database3 we obtained a total of 296 velocities for TriAus and 109 for AS0794 in the range of 5000 ≤ V ≤ 30 000 km s−1. From the linear regression to compare 43 velocities in common with the literature, we obtain vobs = 0.9914vNED + 62.1, with R2 = 0.9978.
4. Analyses of the clusters TriAus and AS0794
4.1. TriAus cluster
Figure 3 shows the combined distribution of 242 galaxies (76 from the present paper and 166 from NED) as wedge diagrams in RA (left) and Dec (right) of the whole velocity data until 20 000 km s−1. Figure 4 shows the recession velocity distribution of these galaxies in the range of 9500 ≤ v ≤ 19 000 km s−1, with a step size of 500 km s−1. The Gaussian distribution (dashed line) is centered at 14 992 km s−1 with a dispersion  . The TriAus cluster has a relatively similar average recessional velocity to the Ara cluster, both of them being physically separated by only ≃13.7 h−1 Mpc (Radburn-Smith et al. 2006) and both lying behind the Norma one, at an average recessional velocity of v = 4707 km s−1.
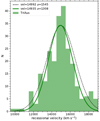 |
Fig. 3. Histogram of galaxy recessional velocities in the TriAus cluster with all recession velocities available in the range of 9500 ≤ v ≤ 19 000 km s−1, with a step size of 500 km s−1. The lines show Gaussian distributions fitted to the data including all galaxies (dashed line) and excising the substructure of 26 galaxies (solid line). |
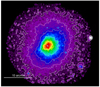 |
Fig. 4. XMM-Newton image of the Triangulum Australis cluster in the 0.5–2 keV band extending over the whole field of view (about 40 arcmin diameter). |
We note that in Fig. 3, a subcomponent is visible in the range of 17 400–18 800 km s−1 (26 galaxies) centered at 18 080 km s−1, with a dispersion of  . Markevitch et al. (1996) established the presence of substructures in the cluster. They concluded on the presence of a subcluster merger corresponding to the above subcomponent close to the centre of TriAus (see Fig. 1 of Markevitch et al. 1996). They detected a significant temperature peak in the cluster core and a temperature increase in the sector coincident with the detected subcluster. It suggests a heating of the local intracluster medium by shocks from the subcluster merger. The XMM-Newton data on the cluster extends over the whole field of view (about 40 arcmin diameter), displaying a quite regular cluster apart from the north-east side, which is squashed (Fig. 4): this is the side where Markevitch et al. (1996) found the higher temperature and also where the above subcomponent is situated. If we remove these 26 galaxies of the subcomponent, the Gaussian distribution on Fig. 3 (solid line) is then centered at 14 935 km s−1, with a dispersion of
  .
.
In order to test the above conclusions, we applied the method developed by Dressler & Shectman (1988) with the δ parameter to test for kinematical structures defined as:
![Mathematical equation: $$ \begin{aligned} {\delta ^{2}= (11/\sigma ^{2}[(\overline{{ v}}_{\rm local} - \overline{{ v}})^{2} + (\sigma _{\rm local} - \sigma )^{2}],} \end{aligned} $$](/articles/aa/full_html/2022/11/aa44714-22/aa44714-22-eq5.gif) (1)
(1)
where vlocal and σlocal are the local velocities and dispersions calculated from the ten nearest neighbors of each galaxy within the r200 radius which defines the limits of the virialized cluster from its redshift and velocity dispersion (i.e., with average density 200 times the critical one; see e.g., Diaferio et al. 2001; Finn et al. 2004):
 (2)
(2)
In random redistributions of the measured galaxy redshifts and positions, with r200 ≃ 2.23 h−1 Mpc (37.31 arcmin), we found the sum of the δ values to be equal to or larger than the observed value with a frequency of Pδ = 0.224. This value is marginally significant to conclusively verify the existence of substantial substructures. If we remove the 26 galaxies of the putative subcluster, then we have an almost perfect Gaussian velocity distribution.
The virial mass estimate of this TriAus cluster member can be computed from the 3D intrinsic velocity dispersion σv within r200 (Biviano et al. 2006) with:
 (3)
(3)
The intrinsic velocity dispersion σv is corrected from the velocity dispersion profile following Fig. 4 of Biviano et al. (2006), which gives for TriAus Mv = (4.2 ± 0.7 ± 0.6) × 1015 M⊙. Here, the first error is statistical and the second one reflects the theoretical uncertainty on the relation (Sereno et al. 2010). Radburn-Smith et al. (2006) obtained a mass: Mv = 5.7 ± 0.6 × 10¹⁵ h−1 M⊙. If we remove the 26 galaxies from the substructure, then we obtain for TriAus a mass of Mv = (3.2 ± 0.6 ± 0.5) × 1015 M⊙.
For the X-ray luminosity of TriAus measured in the ROSAT survey, we obtained a value of LX = 6.2 × 1044 erg s−1 (0.1–2.4 keV), which would imply a mass around 1015 M⊙ based on the X-ray luminosity mass relation (e.g., Böhringer et al. 2013, 2017), which is lower than the dynamical mass. The X-ray luminosity found by Markevitch et al. 1996 is 6.8 × 1044 erg s−1, consistent with our result if converted to the 0.1–2.4 keV band and h70 = 1. From the mass–X-ray temperature relation (e.g., Arnaud et al. 2005) and the derived dynamical mass, we would expect a temperature around 13 keV, which is a bit higher than the peak temperature found by Markevitch et al. (1996). The expected X-ray luminosity for the quoted dynamical mass would be about 3 × 1045 erg s−1 (0.1–2.4 keV), while for an intracluster medium temperature of 10–12 keV, the expected luminosity would be about 1.3 − 2 × 1045 erg s−1 (0.1–2.4 keV); this is higher by a significant factor than what is observed (using e.g., relations by Pratt et al. 2009). There is thus a clear departure of the cluster from the general scaling relations, which is certainly a sign of a non-relaxed state. This is also indicated by the squashed appearance of the cluster on the north-eastern side and the disturbed central surface brightness of the cluster which is less peaked than typically found in relaxed clusters. We therefore expect that the velocity dispersion and the cluster temperature is increased due to the distortion in comparison to a relaxed cluster of same mass, while the X-ray luminosity is reduced due to a less dense core.
Radburn-Smith et al. (2006) also computed for the Ara cluster (with a bimodal velocity distribution) a mass of (2.0 ± 0.3) × 1015 h−1 M⊙. Considering their respective masses, it has a sizeable influence on the X-ray based dipole (Kocevski et al. 2004). As pointed out by Radburn-Smith et al. (2006), both clusters have the same velocity than the SSC (Proust et al. 2006; Quintana et al. 2020) and form an extension of the SSC in association with the two clusters CIZA J1410.4−4246 and CIZA J1514.6−4558.
4.2. AS0794 cluster
Figure 5 shows the combined resulting distribution of 78 galaxies (55 from the present paper and 23 from NED) in the AS0794 cluster as wedge diagrams in right ascension and declination of the whole velocity data available until 20 000 km s−1. Figure 6 shows the recession velocity histogram of these galaxies in the range of 11 000 ≤ v ≤ 17 500 km s−1, with a step size of 500 km s−1. The histogram shows the Gaussian distribution centered at 12 669 km s−1 with a dispersion  . We see on these two diagrams that there are galaxies with higher velocities than the cluster, spread towards and around the average velocity (≃15 000 km s−1) of the TriAus cluster. We can suggest that AS0794 is slightly in front of the main structure linked to the TriAus complex, as dicussed below. From these velocity values and following the same procedure as for TriAus, for the cluster AS0794, we deduced Mv = (1.7 ± 0.7 ± 0.6) × 1013 M⊙. With this mass, we would expect an X-ray luminosity around LX ∼ 1042 erg s−1, which agrees with our observation of the cluster in the ROSAT survey.
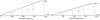 |
Fig. 5. Two projections in RA 17h18 to 17h38 (left) and Dec −65° 40 to −67° 40 (right) of galaxies of the AS0794 cluster. The angle in RA is expanded by a factor of 4 and in Dec by a factor of 8 relative to their true size for clarity. |
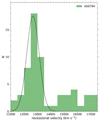 |
Fig. 6. Histogram of galaxy recessional velocities in the AS0794 cluster with all velocities available in the range of 11 000 ≤ v ≤ 17 500 km s−1, with a step size of 500 km s−1. The line shows a Gaussian distribution fitted to the data. |
5. Triangulum Australis complex as a part of a larger superstructure
The TriAus cluster appears to be associated with other clusters in its vicinity. Four clusters were already identified by (Kocevski & Ebeling 2006; Radburn-Smith et al. 2006) as part of a possible extension from the Shapley Supercluster (SSC) in the SE direction: the TriAus cluster, the Ara cluster, CIZA J1410.4−4246, and CIZA J1514.6−4558. In fact, Radburn-Smith et al. (2006) remarked that A 3558 (at the core of the SSC) lies only 38 Mpc from CIZA J1410.4−4246, so that the TriAus complex can form an extension of the SSC (at the same average velocity). For Kocevski & Ebeling (2006), this web of clusters confirms the extension of the network in which the SSC is embedded, as suggested by these authors. The location of this set of clusters is shown in their Fig. 9. However the string of clusters passes directly behind a region of extremely high extinction of the galactic disk.
We added galaxies from the NED database within a radius of 10° around the center of the TriAus and ARA clusters, with a total of 2328 galaxies including the above four clusters already identified by Radburn-Smith et al. (2006), Kocevski & Ebeling (2006). The velocity histogram in Fig. 5 of Radburn-Smith et al. (2006) shows the four rich clusters at z ≃ 0.05, which correspond to the recessional velocity histogram shown here (Fig. 7) centered at  , with a dispersion of σ = 3355 ± 51 km s−1.
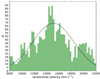 |
Fig. 7. Histogram of the 2328 galaxy recessional velocities in the central area 10° radius area around the Triangulum Australis cluster, with velocities available in the range of 8000 ≤ v ≤ 22 000 km s−1 and a step size of 250 km s−1. The Gaussian is centered at |
To study the interactions of the above wide TriAus region with the SSC, we extracted from the NED database all galaxies with velocities between V = 8000 and V = 20 000 km s−1 to cover a wide region ranging ranging between RA = 12h30m and 20h00m and from Dec = −30° to Dec = −90° (J2000). We added the SSC velocity catalogue (Quintana et al. 2020) in the same velocity range and we finally obtained a set of 13 152 galaxies in this region, after eliminating duplicate objects.
Figure 8 shows the wedge diagrams from RA = 12h30 to RA = 18h and from Dec = −30° to Dec = −90° for these 13 152 galaxies. Many clusters are clearly visible, particularly in the region of the SSC and also around the TriAus centre. Several very elongated structures are strongly affected by extinction from the galactic plane.
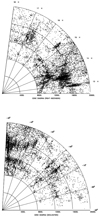 |
Fig. 8. Wedge diagram in RA and Dec of the complete region between the Triangulum Australis and the Shapley clusters from RA = 12h30 to RA = 18h and from Dec = −30° to Dec = −90°. The Dec diagram is enlarged by a factor of 1.5 for clarity. |
In order to identify the already known structures in this wide area, we selected 50 identified clusters of galaxies from the NED database in the wide region ranging from RA = 13h20m to 20h00m and from Dec = −30° to Dec = −90° (J2000), including the SSC and TriAus, and with velocities ranging between 8000 and 20 000 km s−1, which are listed in Table 2: (1) cluster name, (2) alternative name, (3) right ascension (J2000), (4) declination (J2000), (5) average heliocentric radial velocity in km s−1.
Identified clusters of galaxies in the same region with velocities between 8000 and 20 000 km s−1.
If the TriAus and Ara clusters and several others could form a massive supercluster, they could influence the direction leading to the CMB Dipole. We have also looked into the studied region for ROSAT clusters and 2MASS galaxies in the same velocity range. We found 15 X-ray luminous clusters, which are listed in Table 3. In Fig. 9, we show the position of these clusters as well as galaxies from the 2MASS redshift survey. We note that seven clusters marked with an asterisk are also given in Table 2. Inside the two blue lines, the galactic HI column density is higher than 2.5 × 1021 cm−2, namely, the region with high galactic absorption in X-rays but also high extinction in the optical. Thus, we cannot clearly follow the filament across this ZoA, but it seems to continue and connect the two denser regions on both sides of the galactic equator, as shown below.
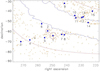 |
Fig. 9. Selection of 15 X-ray luminous CLASSIX clusters and 2MASS galaxies (0.003 < z < 0.065) in the Triangulum Australis region, with the high galactic absorption region inside the two blue lines. Triangulum Australis cluster is marked by a larger red circle and the Ara one by a smaller red circle. AS0794 is marked with an open circle and the number for the other clusters are given in Table 3. |
A clearer view of the relationship between the cluster structures present above and below the Milky Way disk is displayed in Fig. 10, which shows the same region in RA and Dec (left) and in l and b (right) coordinates with 11 096 galaxies, where the positions of the clusters from Tables 2 and 3 are represented, with the SSC centre near the top right-hand corner. Noting their spatial and velocity distribution (color-coded) in the SE quadrant from the SSC, there is a noticeable filament of clusters, starting with CIZA J1410.4−4246, AS0772, CIZA J1514.6−4558, and CIZA J1518.3−4632, on the north side of the Milky Way disk, in the velocity range 12 000 km s−1–18 000 km s−1 (circles in green color). Both Figs. 10a and b strongly suggest that the northern part of the filament, or extension, is just facing the southern part, across the absorbing Milky Way disk. The structure on the south side of the disk includes (in addition to the TriAus and Ara clusters) other clusters such as RXC J1701.4−6619, AS0794, CGJ1720−67.8, AS0797, and RXC J1807.3−7012, all following a filament extending from RA 14h10 and Dec −40° to RA 18h30 and Dec −70°, or even extending to AS0800 and Dec = −80°.
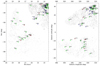 |
Fig. 10. TriAus and Shapley regions represented in RA, Dec (left), and in l,b coordinates (right) with the plane of the Milky Way crossing the figure. The positions of the discussed clusters in Tables 2 and 3 are represented in blue, green, and red circles in the ranges of 8000 ≤ v < 12 000 km s−1, 12 000 ≤ v < 18 000 km s−1, and 18 000 ≤ v < 20 000 km s−1, respectively. |
6. Discussion
In this work, we show that the massive TriAus cluster has several cluster companions within the same general redshift range. It is natural to think this group of clusters as part of one supercluster, centered on the TriAus cluster, which dominates by mass this supercluster. We call this the TriAus Supercluster. Obviously, this supercluster could be larger, particularly towards its northern and western side, if some other massive cluster still remains hidden behind the galaxy disk. In any case, it seems likely that some less massive and less luminous X-ray clusters may be hidden from view in that region, which appears as a natural gap in the connection from both sides on the disk (as shown in Fig. 10). An inspection of Figs. 8 and 9 of Jones et al. (2009) shows the general large-scale structures around the SSC from the 2dF Survey, showing a continuation of the “SSC front eastern wall” to the east, at a velocity centered on 11 000–12 000 km s−1 in Dec = −30° to Dec = −40°, which is seen in our Fig. 10 as well. It also shows a wide filament in the slice from Dec = −40° to Dec = −60° pointing to the East in the redshift z = 0.05 range, which would be coincident with the north section of the filament already described and with a narrow extension below the galactic plane. In the region of the TriAus and Ara clusters, the Dec = −60° to Dec = −90° slice shows a somewhat dispersed wide galaxy concentration. This is consistent with what we found in this search, including a few clusters up to a redshift of z = 0.06 (the ZoA is obviously empty).
These massive structures, namely, the SSC and TriAus supercluster, along with the connections between them, are hidden away behind the Great Attractor main source masses, located between radial recessional velocities 2000 km s−1 and 6000 km s−1 (already described in Radburn-Smith et al. 2006). Nevertheless, the important mass of the TriAus cluster (and its associated supercluster) will have some (possibly much smaller) effect in perturbing the galaxy velocity flows further away from the Great Attractor and beyond a radial velocity of 20 000 km s−1. Therefore, their presence should be taken into account when calculating distant galaxy flows and the influence on the direction of the microwave dipole. However, the structures that are still hidden can further contribute to these effects if they do indeed exert a significant influence as well.
Las Campanas Observatory (LCO) is an astronomical observatory owned and operated by the Carnegie Institution for Science (CIS).
IRAF is distributed by the National Optical Astronomy Observatories, which are operated by the Association of Universities for Research in Astronomy, Inc., under cooperative agreement with the National Science Foundation.
The NASA/IPAC Extragalactic Database (NED) is operated by the Jet Propulsion Laboratory, California Institute of Technology, under contract with the National Aeronautics and Space Administration.
Acknowledgments
D.P. thanks the Instituto de Astrofísica of the Universidad Catolica for its hospitality at Santiago (Chile). H.B. thanks the Deutsche Forschungsgemeinschaft for support through the Excellence Cluster “Origins”.
References
- Ajello, M., Rebusco, P., Cappelluti, N., et al. 2009, ApJ, 690, 337 [Google Scholar]
- Andreuzzi, G., Bardelli, S., Scaramella, R., & Zucca, E. 1995, A&A, 337, 17 [NASA ADS] [Google Scholar]
- Arnaud, M., Pointecouteau, E., & Pratt, G. W. 2005, A&A, 441, 893 [NASA ADS] [CrossRef] [EDP Sciences] [Google Scholar]
- Ayral, B., & Saurer, W. 2005, MNRAS, 360, 125 [NASA ADS] [CrossRef] [Google Scholar]
- Biviano, A., Murante, G., Borgani, S., et al. 2006, AA, 456, 23 [NASA ADS] [CrossRef] [EDP Sciences] [Google Scholar]
- Böhringer, H., Chon, G., Collins, C. A., et al. 2013, A&A, 555, A30 [Google Scholar]
- Böhringer, H., Chon, G., & Kronberg, P. P. 2016, A&A, 596, A22 [NASA ADS] [CrossRef] [EDP Sciences] [Google Scholar]
- Böhringer, H., Chon, G., Retzlaff, J., et al. 2017, AJ, 153, 220 [Google Scholar]
- Booth, R. S., De Block, W. J. G., Jonas, J. L., & Fanaroff, B. 2009, ArXiv e-prints [arXiv:0910.2935] [Google Scholar]
- Bowen, I. S., & Vaughan, A. H. 1973, Appl. Opt., 12, 1430 [Google Scholar]
- Chow-Martinez, M., Andernach, H., Caretta, C. A., & Trejo-Alonso, J. J. 2014, MNRAS, 445, 4073 [CrossRef] [Google Scholar]
- Cypriano, E. S., Lima Neto, G. B., Sodré, L., Jr, Kneib, J. P., & Campusano, L. E. 2005, ApJ, 630, 38 [NASA ADS] [CrossRef] [Google Scholar]
- Davis, D. S., Bird, C. M., & Mushotzky, R. F. 1995, ApJ, 440, 48 [NASA ADS] [CrossRef] [Google Scholar]
- Diaferio, A., Kauffmann, G., Balogh, M. L., et al. 2001, MNRAS, 323, 999 [Google Scholar]
- Dressler, A., & Shectman, S. A. 1988, AJ, 95, 284 [Google Scholar]
- Finn, R. A., Zaritski, D., & McCarthy, D. W., Jr 2004, ApJ, 604, 141 [NASA ADS] [CrossRef] [Google Scholar]
- Girardi, M., Giuricin, G., Mardirossian, F., Mezzetti, M., & Boschin, W. 1998, ApJ, 505, 74 [NASA ADS] [CrossRef] [Google Scholar]
- Kocevski, D. D., & Ebeling, H. 2006, ApJ, 645, 1043 [NASA ADS] [CrossRef] [Google Scholar]
- Jones, D. H., Read, M. A., Saunders, W., et al. 2009, MNRAS, 399, 683 [Google Scholar]
- Kim, D.-W., & Fabbiano, G. 2013, ApJ, 776, 116 [NASA ADS] [CrossRef] [Google Scholar]
- Kocevski, D. D., Mullis, C. R., & Ebeling, H. 2004, ApJ, 608, 721 [NASA ADS] [CrossRef] [Google Scholar]
- Kurtz, M. J., Mink, D. J., Wyatt, W. F., et al. 1991, ASP Conf. Ser., 25, 432 [NASA ADS] [Google Scholar]
- Le Fèvre, O., Crampton, D., Lilly, S. J., Hammer, F., & Tresse, L. 1995, ApJ, 455, 60 [CrossRef] [Google Scholar]
- McHardy, I. M., Lawrence, A., Kye, J. P., & Pounds, K. A. 1981, MNRAS, 197, 893 [NASA ADS] [CrossRef] [Google Scholar]
- Markevitch, M. L., Sarazin, C. L., & Irwin, J. A. 1996, ApJ, 472, L17 [NASA ADS] [CrossRef] [Google Scholar]
- Mink, D. J., & Wyatt, W. F. 1995, in Astronomical Data Analysis Software and Systems IV, eds. R. A. Shaw, H. E. Payne, & J. J. E. Hayes (San Francisco: Astron. Soc. Pac), ASP Conf. Ser., 77, 496 [NASA ADS] [Google Scholar]
- Pickles, A. J. 1985, ApJS, 59, 33 [NASA ADS] [CrossRef] [Google Scholar]
- Pickles, A. J. 1998, PASP, 110, 863 [NASA ADS] [CrossRef] [Google Scholar]
- Pratt, G. W., Croston, J. H., Arnaud, M., et al. 2009, A&A, 498, 361 [NASA ADS] [CrossRef] [EDP Sciences] [Google Scholar]
- Proust, D., Quintana, H., Carrasco, E. R., et al. 2006, A&A, 447, 133 [NASA ADS] [CrossRef] [EDP Sciences] [Google Scholar]
- Quintana, H., Carrasco, E. R., & Reisenegger, A. 2000, AJ, 120, 511 [NASA ADS] [CrossRef] [Google Scholar]
- Quintana, H., Proust, D., Hertling, G., et al. 2009, Astron. Nachr., 330, 924 [NASA ADS] [CrossRef] [Google Scholar]
- Quintana, H., Proust, D., Dunner, R., Carrasco, E. R., & Reisenegger, A. 2020, A&A, 638, A27 [NASA ADS] [CrossRef] [EDP Sciences] [Google Scholar]
- Radburn-Smith, D. J., Lucey, J. R., Woudt, P. A., Kraan-Korteweg, R. C., & Watson, F. G. 2006, MNRAS, 369, 1131 [NASA ADS] [CrossRef] [Google Scholar]
- Scaife, A. N. N., Oozeer, N., de Gasperin, F., et al. 2015, MNRAS, 451, 4021 [NASA ADS] [CrossRef] [Google Scholar]
- Sereno, M., Lubini, M., & Jetzer, Ph. 2010, AA, 518, 55 [Google Scholar]
- Shectman, S. A. 1989, Year Book 89 (Washington: Carnegie Inst.), 25 [Google Scholar]
- Solovyeva, L., Anokhin, S., Feretti, L., et al. 2008, A&A, 484, 621 [NASA ADS] [CrossRef] [EDP Sciences] [Google Scholar]
- Tonry, J., & Davis, M. 1979, AJ, 84, 1511 [Google Scholar]
- Trümper, J. 1993, Science, 260, 1769 [Google Scholar]
- Woudt, P. A., Kraan-Korteweg, R. C., & Fairall, A. P. 1999, A&A, 352, 39 [NASA ADS] [Google Scholar]
Appendix A: Additional table
The new heliocentric radial recessional velocities catalogue in TriAus and AS794. Each column is described in Sect. 3.
All Tables
Identified clusters of galaxies in the same region with velocities between 8000 and 20 000 km s−1.
The new heliocentric radial recessional velocities catalogue in TriAus and AS794. Each column is described in Sect. 3.
All Figures
|
Fig. 1. X-ray contours of the Triangulum Australis cluster from an observation with XMM-Newton overlaid on a Digital Sky Survey image. |
| In the text | |
|
Fig. 2. X-ray contours of AS0794 from the ROSAT survey overlaid on a Digital Sky Survey image. |
| In the text | |
|
Fig. 3. Histogram of galaxy recessional velocities in the TriAus cluster with all recession velocities available in the range of 9500 ≤ v ≤ 19 000 km s−1, with a step size of 500 km s−1. The lines show Gaussian distributions fitted to the data including all galaxies (dashed line) and excising the substructure of 26 galaxies (solid line). |
| In the text | |
|
Fig. 4. XMM-Newton image of the Triangulum Australis cluster in the 0.5–2 keV band extending over the whole field of view (about 40 arcmin diameter). |
| In the text | |
|
Fig. 5. Two projections in RA 17h18 to 17h38 (left) and Dec −65° 40 to −67° 40 (right) of galaxies of the AS0794 cluster. The angle in RA is expanded by a factor of 4 and in Dec by a factor of 8 relative to their true size for clarity. |
| In the text | |
|
Fig. 6. Histogram of galaxy recessional velocities in the AS0794 cluster with all velocities available in the range of 11 000 ≤ v ≤ 17 500 km s−1, with a step size of 500 km s−1. The line shows a Gaussian distribution fitted to the data. |
| In the text | |
|
Fig. 7. Histogram of the 2328 galaxy recessional velocities in the central area 10° radius area around the Triangulum Australis cluster, with velocities available in the range of 8000 ≤ v ≤ 22 000 km s−1 and a step size of 250 km s−1. The Gaussian is centered at |
| In the text | |
|
Fig. 8. Wedge diagram in RA and Dec of the complete region between the Triangulum Australis and the Shapley clusters from RA = 12h30 to RA = 18h and from Dec = −30° to Dec = −90°. The Dec diagram is enlarged by a factor of 1.5 for clarity. |
| In the text | |
|
Fig. 9. Selection of 15 X-ray luminous CLASSIX clusters and 2MASS galaxies (0.003 < z < 0.065) in the Triangulum Australis region, with the high galactic absorption region inside the two blue lines. Triangulum Australis cluster is marked by a larger red circle and the Ara one by a smaller red circle. AS0794 is marked with an open circle and the number for the other clusters are given in Table 3. |
| In the text | |
|
Fig. 10. TriAus and Shapley regions represented in RA, Dec (left), and in l,b coordinates (right) with the plane of the Milky Way crossing the figure. The positions of the discussed clusters in Tables 2 and 3 are represented in blue, green, and red circles in the ranges of 8000 ≤ v < 12 000 km s−1, 12 000 ≤ v < 18 000 km s−1, and 18 000 ≤ v < 20 000 km s−1, respectively. |
| In the text | |
Current usage metrics show cumulative count of Article Views (full-text article views including HTML views, PDF and ePub downloads, according to the available data) and Abstracts Views on Vision4Press platform.
Data correspond to usage on the plateform after 2015. The current usage metrics is available 48-96 hours after online publication and is updated daily on week days.
Initial download of the metrics may take a while.