Open Access
Fig. 8.
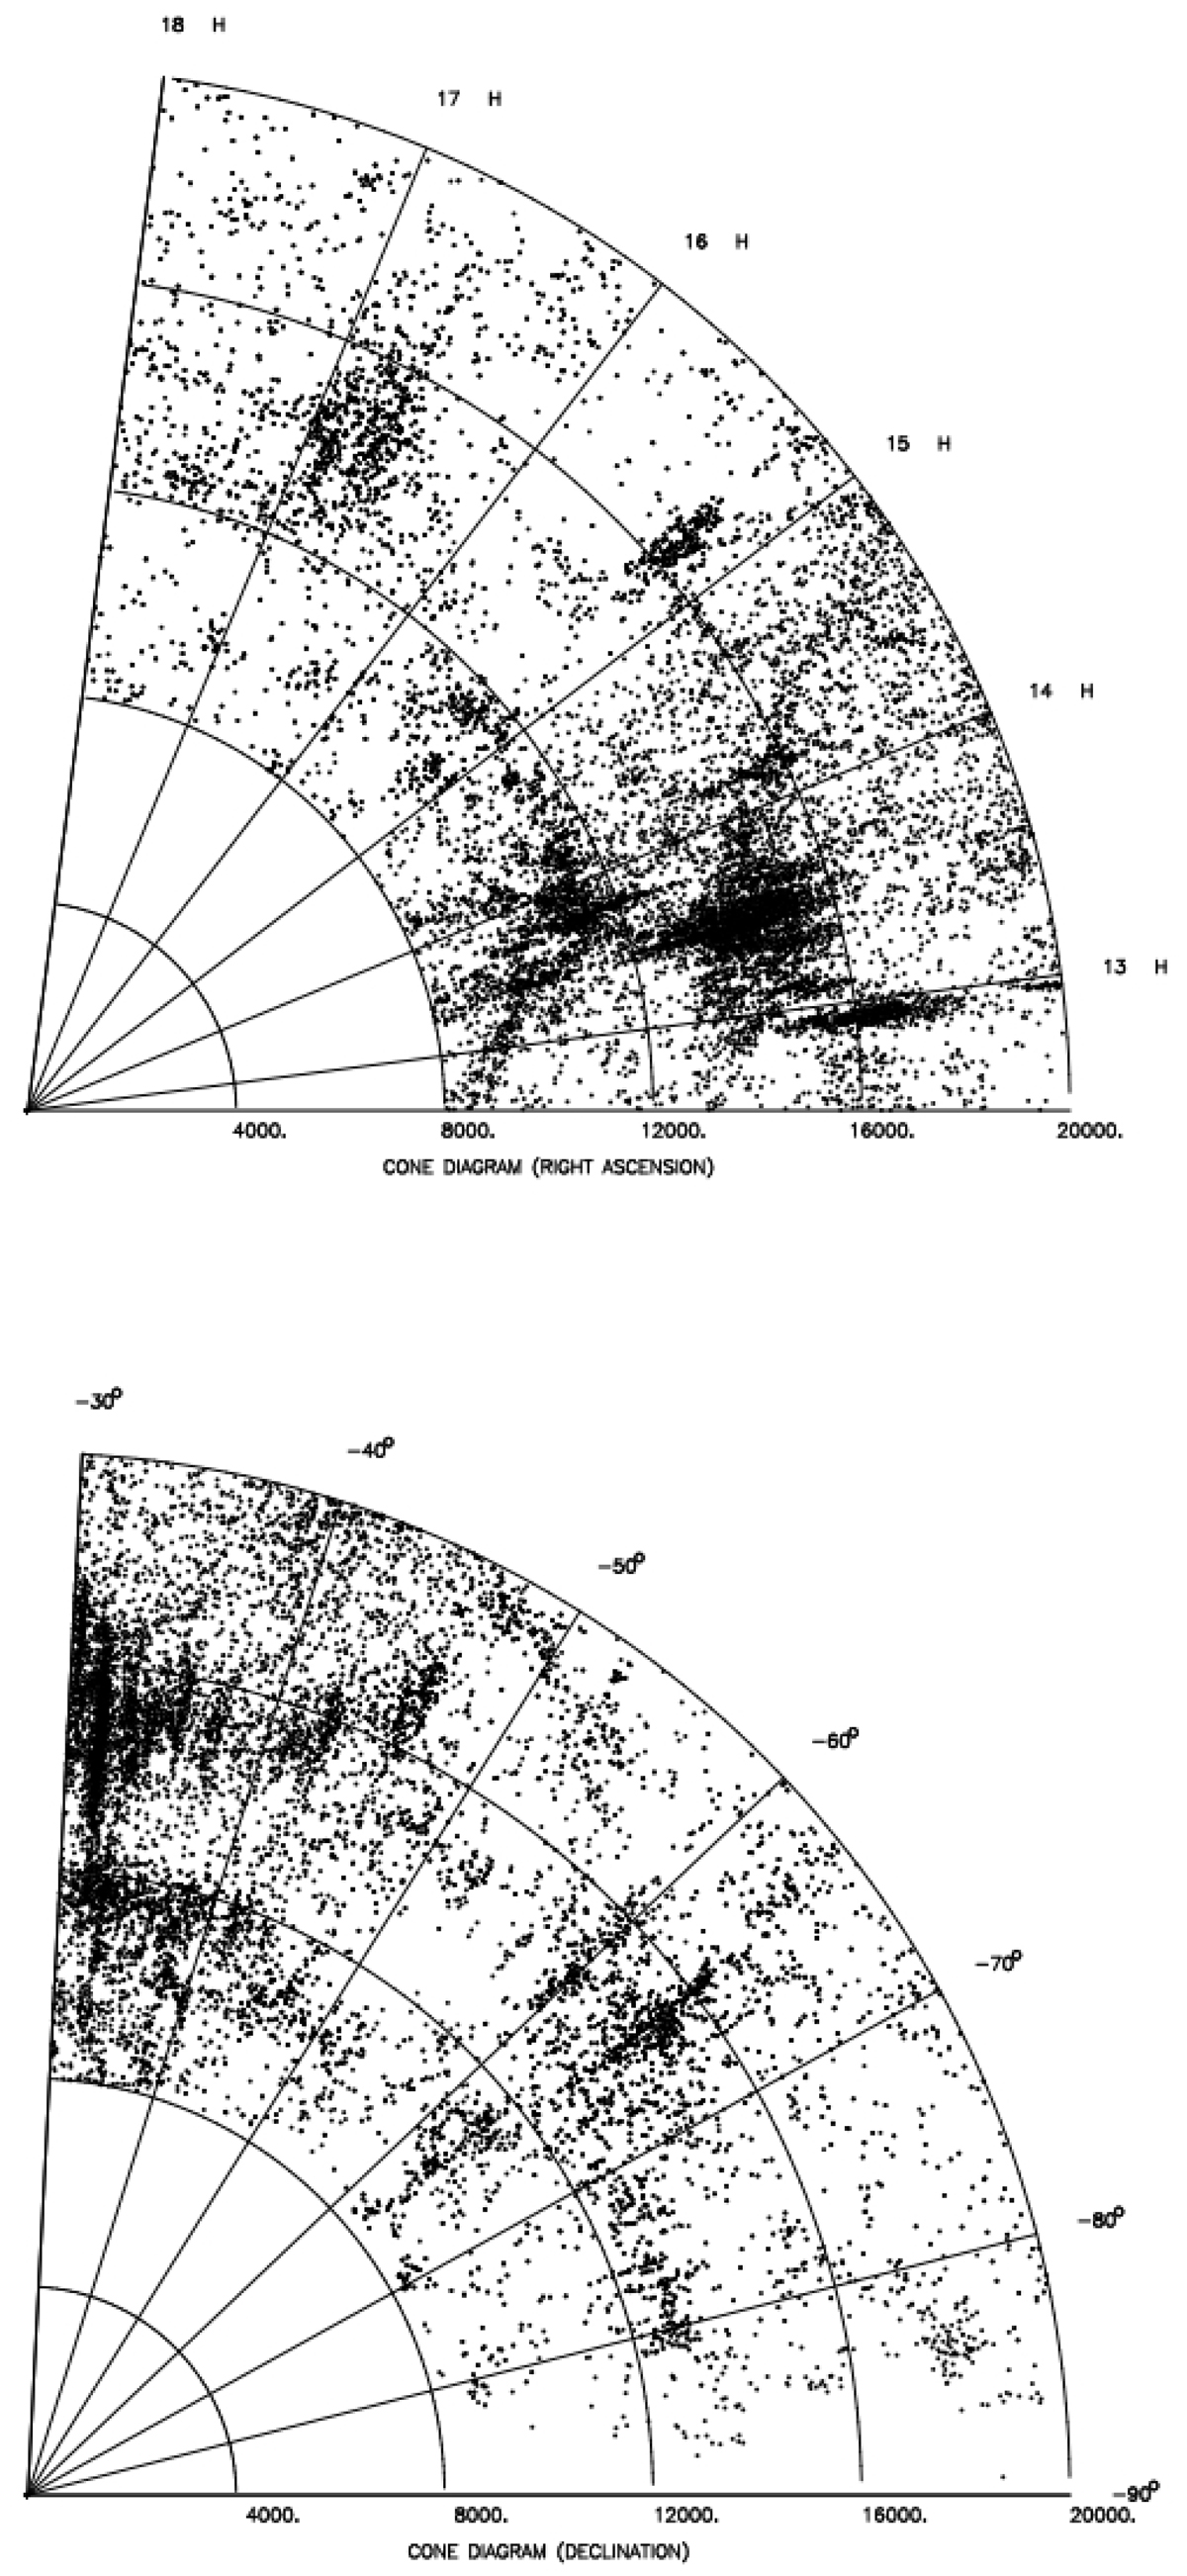
Download original image
Wedge diagram in RA and Dec of the complete region between the Triangulum Australis and the Shapley clusters from RA = 12h30 to RA = 18h and from Dec = −30° to Dec = −90°. The Dec diagram is enlarged by a factor of 1.5 for clarity.
Current usage metrics show cumulative count of Article Views (full-text article views including HTML views, PDF and ePub downloads, according to the available data) and Abstracts Views on Vision4Press platform.
Data correspond to usage on the plateform after 2015. The current usage metrics is available 48-96 hours after online publication and is updated daily on week days.
Initial download of the metrics may take a while.