Fig. 3.
Download original image
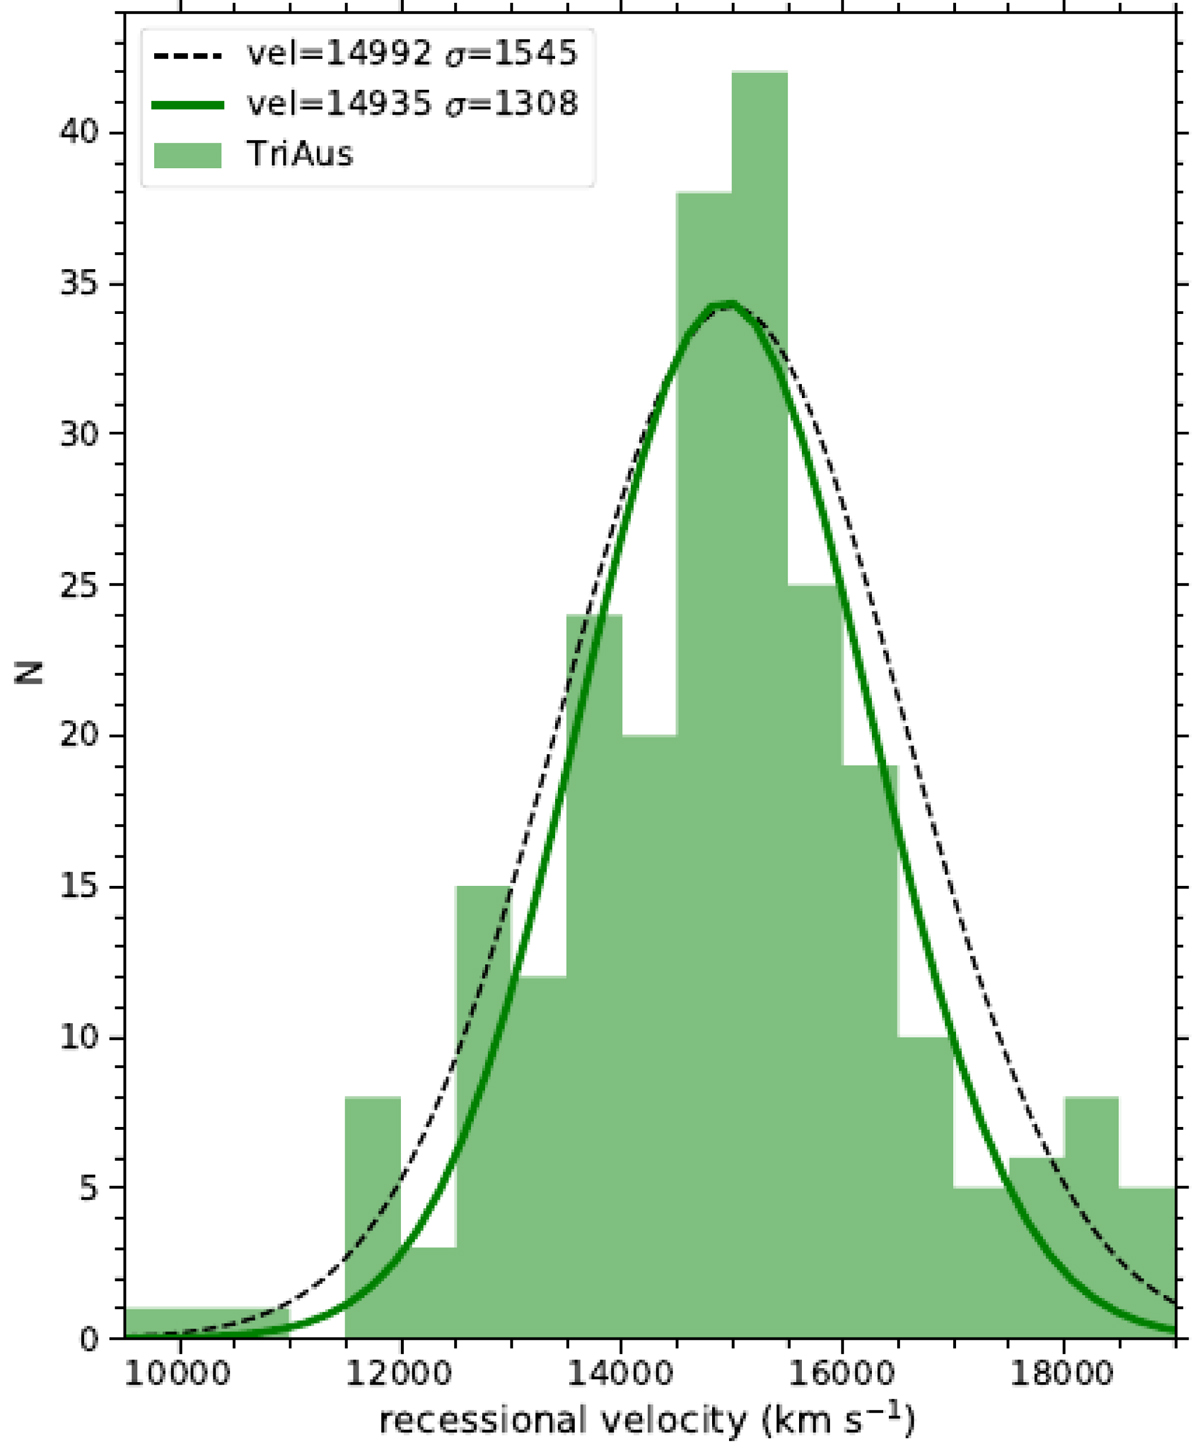
Histogram of galaxy recessional velocities in the TriAus cluster with all recession velocities available in the range of 9500 ≤ v ≤ 19 000 km s−1, with a step size of 500 km s−1. The lines show Gaussian distributions fitted to the data including all galaxies (dashed line) and excising the substructure of 26 galaxies (solid line).
Current usage metrics show cumulative count of Article Views (full-text article views including HTML views, PDF and ePub downloads, according to the available data) and Abstracts Views on Vision4Press platform.
Data correspond to usage on the plateform after 2015. The current usage metrics is available 48-96 hours after online publication and is updated daily on week days.
Initial download of the metrics may take a while.