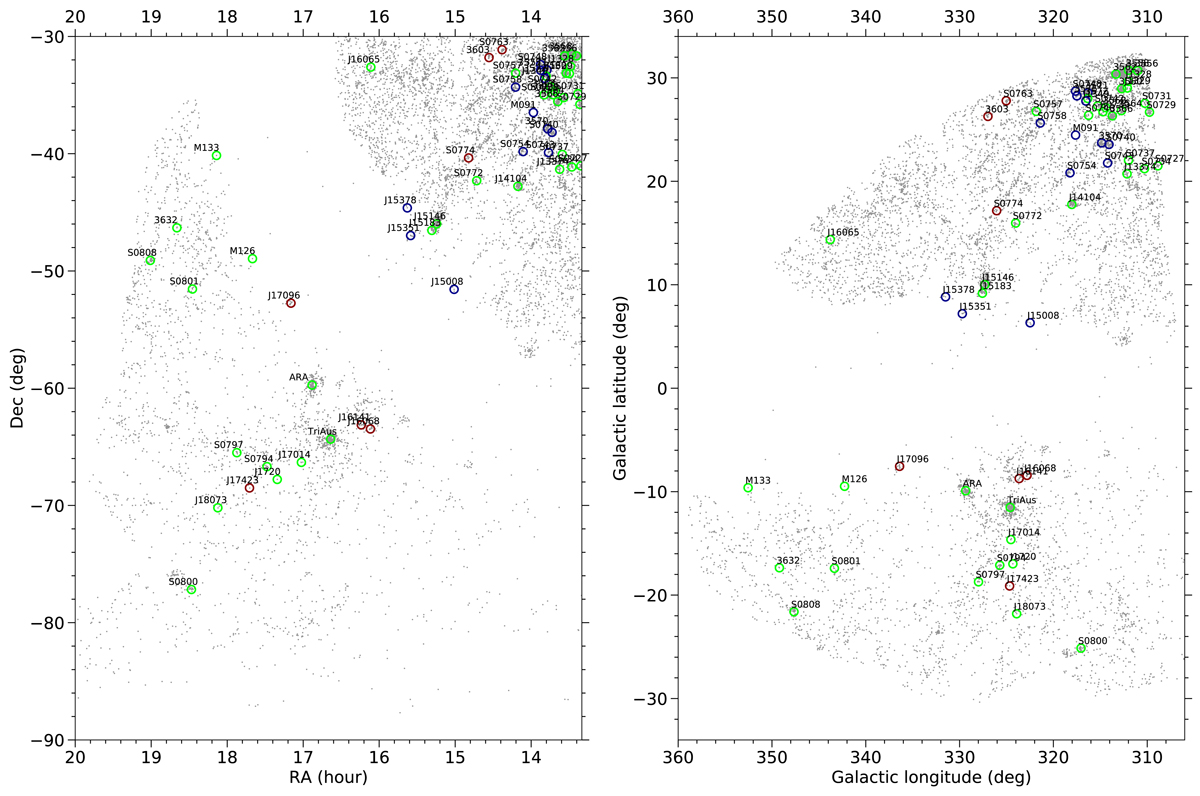
Fig. 10.
Download original image
TriAus and Shapley regions represented in RA, Dec (left), and in l,b coordinates (right) with the plane of the Milky Way crossing the figure. The positions of the discussed clusters in Tables 2 and 3 are represented in blue, green, and red circles in the ranges of 8000 ≤ v < 12 000 km s−1, 12 000 ≤ v < 18 000 km s−1, and 18 000 ≤ v < 20 000 km s−1, respectively.
Current usage metrics show cumulative count of Article Views (full-text article views including HTML views, PDF and ePub downloads, according to the available data) and Abstracts Views on Vision4Press platform.
Data correspond to usage on the plateform after 2015. The current usage metrics is available 48-96 hours after online publication and is updated daily on week days.
Initial download of the metrics may take a while.