| Issue |
A&A
Volume 667, November 2022
|
|
|---|---|---|
| Article Number | A130 | |
| Number of page(s) | 13 | |
| Section | Astrophysical processes | |
| DOI | https://doi.org/10.1051/0004-6361/202244696 | |
| Published online | 17 November 2022 | |
Constraining leptonic emission scenarios for the PeVatron candidate HESS J1702−420 with deep XMM-Newton observations⋆
1
Astroparticule et Cosmologie, Université de Paris-Cité, CNRS/IN2P3, 75013 Paris, France
e-mail: This email address is being protected from spambots. You need JavaScript enabled to view it.
2
Université Paris-Saclay, Université Paris-Cité, CEA, CNRS, AIM de Paris-Saclay, 91191 Gif-sur-Yvette, France
Received:
5
August
2022
Accepted:
15
September
2022
Abstract
Aims. We aim to search for a hidden leptonic accelerator, such as a high-Ė pulsar, associated with the unidentified TeV object HESS J1702−420A.
Methods. We carried out a 72 ks X-ray observation with the XMM-Newton satellite and analyzed the resulting data jointly with the publicly available HESS spectral energy distribution (SED) results to derive constraints on the leptonic contribution to the TeV emission of HESS J1702−420A. A set of scripts dedicated to the multi-wavelength modeling of X-ray and γ-ray data, based on Gammapy, Naima, and Xspec, has been developed in the context of this work and made publicly available along with this paper.
Results. No object clearly associated with HESS J1702−420A was found in the XMM-Newton data. After excluding the unidentified object Suzaku src B as a possible X-ray counterpart and classifying it as a new cataclysmic variable source candidate, we derived strict upper limits on the level of diffuse X-ray emission in the HESS J1702−420A region: F(2 − 10 keV)≲5.4 × 10⁻⁵ keV cm−2 s−1 at 2σ (≈95.5%) confidence level. A tight constraint on the magnetic field was derived, under a one-zone leptonic scenario, by jointly fitting the XMM-Newton spectra and the HESS SED: B ≲ 1.45 μG at 2σ level. We additionally report the serendipitous discovery of a new extended X-ray source with a hard spectral index of 1.99 ± 0.45, named XMMU J170147.3−421407 which is likely Galactic. Its classification as a high-speed runaway pulsar wind nebula (PWN), possibly associated with HESS J1702−420A, is not obvious but cannot be ruled out either.
Conclusions. The hard γ-ray object HESS J1702−420A remains unidentified, but the absence of a clear X-ray counterpart strongly challenges simple leptonic scenarios. The only remaining possible leptonic counterpart for HESS J1702−420A appears to be a newly discovered X-ray source with extended morphology and hard spectral index, which may be a PWN powered by a high-speed runaway pulsar.
Key words: gamma rays: general / X-rays: general / radiation mechanisms: non-thermal / pulsars: general / acceleration of particles / methods: data analysis
The FITS images used to produce Figs. 1 and B.1 are only available at the CDS via anonymous ftp to cdsarc.cds.unistra.fr (130.79.128.5) or via https://cdsarc.cds.unistra.fr/viz-bin/cat/J/A+A/667/A130
© L. Giunti et al. 2022
 Open Access article, published by EDP Sciences, under the terms of the Creative Commons Attribution License (https://creativecommons.org/licenses/by/4.0), which permits unrestricted use, distribution, and reproduction in any medium, provided the original work is properly cited.
This article is published in open access under the Subscribe-to-Open model. This email address is being protected from spambots. You need JavaScript enabled to view it. to support open access publication.
1. Introduction
HESS J1702−420 is an extreme particle accelerator discovered during the first HESS Galactic plane survey campaign (Aharonian et al. 2006). Due to its hard power law spectrum and lack of high-energy cutoff, it was soon recognized as a promising candidate accelerator of PeV-energy hadronic cosmic rays (i.e., pevatron). Still, the lack of associated objects at other wavelengths has hindered the general understanding of the origins of its TeV γ-ray emission (Aharonian et al. 2008; Lau et al. 2018), particularly with regard to whether it is produced by the inverse-Compton up-scattering of low-energy photon fields by ultra-relativistic e± (leptonic processes) or by the inelastic collision of CR hadrons with interstellar medium nuclei (hadronic processes).
The HESS Collaboration recently published an updated analysis of the region based on deep observations of HESS J1702−420, leading to the discovery of a new small-scale (0.06 ± 0.02stat ± 0.03syst° in radius) emission zone called HESS J1702−420A with an extremely hard power law spectrum (index of 1.53 ± 0.19stat ± 0.20syst) above TeV, possibly extending up to 100 TeV (Abdalla et al. 2021, hereby A21). If modeled with a simple one-zone hadronic (leptonic) model, this object can be equally well interpreted as an accelerator of protons (electrons) up to at least 0.8 PeV (100 TeV) (A21).
It was pointed out in A21 that HESS J1702−420A overlaps with the position of an unidentified X-ray point source called Suzaku src B, discovered by Fujinaga et al. (2011; hereafter F11). This object has not been properly characterized to date, due to its intrinsic faintness and its location at the border of the Suzaku field of view in the F11 pointing. The discovery of HESS J1702−420A has renewed the interest around the nature of Suzaku src B, since it has opened the possibility of finding the first multi-wavelength association for (at least part of) the TeV emission of HESS J1702−420. Thus, we proposed and subsequently obtained a deep observation (72 ks) with the highly sensitive XMM-Newton telescope to characterize Suzaku src B and understand whether it may be a pulsar associated with HESS J1702−420A as well as to constrain leptonic TeV emission scenarios based on the presence of a putative low-brightness X-ray pulsar wind nebula (PWN).
The XMM-Newton data were processed with a collection of tools including standard X-ray analysis packages, such as Xspec and Sherpa (Arnaud 1996; Freeman et al. 2001; Doe et al. 2007), and a new set of Python scripts dedicated to the multi-wavelength fitting of X-ray and γ-ray data with physically motivated models. Our scripts rely on the Gammapy1 package (Donath et al. 2015) version 0.19 (Donath et al. 2021) for the X-ray and γ-ray data handling and fitting within a unified framework. The multi-wavelength spectral modeling can be performed using an arbitrary combination of the functions included in the Xspec and Naima (Zabalza 2015) libraries, a task that was not easy to achieve with previously existing tools. The new scripts, described in Appendix A, were developed on an open-source basis and are made publicly available along with this paper (Giunti & Terrier 2022) to ensure a full analysis reproducibility and to encourage their application to other studies.
The paper is structured as follows: we start by describing the new X-ray data and their analysis in Sect. 2. We provide a physical interpretation of the results in Sect. 3 and we conclude with a summary in Sect. 4.
2. X-ray observations and data analysis
To search for possible X-ray counterparts of HESS J1702−420A, we proposed a 72 ks XMM-Newton observation, which was then carried out on September 26th 2021. The observation was centered on the position of Suzaku src B, l = 344.093° and b = −0.167° in the Galactic coordinate system (F11). The region was observed using the three EPIC instruments on board the XMM-Newton satellite in full frame mode. After the flare screening, the remaining exposure time is 63 ks and 44 ks for the MOS and PN cameras, respectively.
Figure 1 shows the background-subtracted and vignetting-corrected image obtained stacking the MOS1, MOS2, and PN data in the energy band 2 − 10 keV, with two inset plots zooming on HESS J1702−420A (upper-right panel) and a newly discovered diffuse X-ray emission region (bottom-right panel). The large-scale arc features that pollute the bottom-left corner of the image are due to straylight (single reflections from a bright X-ray source outside the field of view), which did not, however, affect the analysis of the relevant objects in the central and upper parts of the field of view.
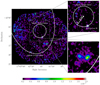 |
Fig. 1. Flux image in the 2 − 10 keV energy band obtained from the dedicated XMM-Newton follow-up observation, in the international celestial reference system (ICRS) frame. The image is in units of 10−7 ph cm−2 s−1 per 4″ × 4″ pixel, and it has been smoothed with a σ = 7″ Gaussian filter. The TeV morphological models of HESS J1702−420A and HESS J1702−420B are overlaid. |
We focused separately on Suzaku src B (Sect. 2.1), the new extended X-ray source (Sect. 2.2) and the HESS J1702−420A region (Sect. 2.3). The regions that were used for spectral extraction and background estimation in all analyses are reported in Fig. B.2. To verify that the analysis systematic uncertainties were under control, we tested different region assumptions, obtaining consistent results, after taking into account the statistical errors. Because of high absorption, the spectral analyses were restricted to the 1 − 10 keV energy range. In all cases we used a Wstat2 fit statistic3, which provides the best likelihood estimates for Poisson-distributed data with an independent data-driven background estimation.
2.1. Spectral analysis of Suzaku src B
Suzaku src B is a faint and unidentified X-ray point-like source, discovered by F11 with a deep 216 ks Suzaku pointing and subsequently detected by Chandra (2CXO J170157.2−421026, based on a ≲10 ks observation made in 2013). Previous measurements did not provide enough statistics to perform a spectral analysis for this object, making a source classification difficult. Thanks to the superior effective area of the XMM-Newton satellite, we were able, for the first time, to measure its spectral properties. We used a 15″ circular “on” region (which optimizes the signal to background ratio) to extract the source spectrum, that was modeled with Xspec (version 12.12.0), assuming a TbAbs-absorbed (Wilms et al. 2000) power law model.
Figure 2 (top left panel) also shows that the X-ray spectrum of Suzaku src B is well fitted by a heavily absorbed power law, nh = (5.1 ± 1.1)×1022 cm−2, with a hard spectral index of 1.51 ± 0.30. The presence of an Fe line is visible in the spectrum, especially in the PN camera, because of its better effective area at high energies. When adding a Gaussian to the model, the fit statistics are improved by −2Δlog(ℒ) = 13.5 (corresponding to a significance of 3.3σ for 2 degrees of freedom). The best fit line centroid is 6.62 ± 0.06 keV, while the de-absorbed flux of Suzaku src B, integrated in the 2 − 10 keV energy band and corrected for the finite emission fraction contained within the “on” region4, is of 2.2 ± 0.2 × 10⁻¹³ erg cm−2 s−1. The bottom left panel of Fig. 2 compares the emission profile of Suzaku src B to the angular resolution of XMM-Newton, showing that the source is point-like and not surrounded by a diffuse X-ray nebula.
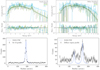 |
Fig. 2. Spectral and morphological properties of the bright source Suzaku src B and XMMU J170147.3−421407. Top panel: XMM-Newton spectra of both sources. The extraction and background regions are shown in Fig. B.2. All spectra are fitted with an absorbed power-law model except for Suzaku src B where a Gaussian line is added to model the Fe–K line complex. The “on” Gaussian line for the PN data is shown in the figure. Bottom panel: X-ray profiles in the 2–10 keV energy band for both sources, extracted from a 390″ square box around their centroid position. The PSF was estimated from the same box profile using the 2D calibration PSF images at a reference energy of 3 keV. |
2.2. A new diffuse source: XMMU J170147.3−421407
The new X-ray observation led to the discovery of a diffuse source located ≈0.12° away from the center of HESS J1702−420A, approximately along its 2σ emission contour (see the bottom right inset of Fig. 1). Based on its position, we named this object XMMU J170147.3−421407. As seen in Fig. 1, XMMU J170147.3−421407 is strongly asymmetric and composed of two substructures, referred to here as the eastern and western lobes, with different shapes and brightnesses. Both lobes are significantly extended in comparison with the XMM-Newton PSF, with apparent sizes of about 1.5′ (see Fig. 2, bottom right panel). Due to the low probability of discovering two extended X-ray sources on the same line of sight and to the presence of a diffuse emission bridge connecting the two lobes, we conclude that they most likely belong to the same extended X-ray object.
To characterize this new object we extracted two spectra for its eastern and western lobes, as well as an overall spectrum encompassing the full source. The spectra were fit with an absorbed power-law model, using Xspec, and the instrumental and astrophysical background were estimated from the “off” region indicated in Fig. B.2 (top right panel). The results are presented in Table 1. Both lobes have a hard spectral index (Γ = 1.6 − 1.8) and highly absorbed spectra (nh ≈ 3 × 1022 cm−2), confirming that they likely belong to the same physical object. The spectrum from the entire diffuse structure has an index of 1.99 ± 0.45, which is slightly softer than the average index of the two independent substructures. This is likely due to the fact that the box used for full source region also encompasses the bridge between the eastern and western lobes (see Fig. B.2), whose X-ray spectrum must be softer.
XMMU J170147.3−421407 is clearly detected in the 2 − 10 keV band (see Fig. 1) but not at lower energies (see the 0.5 − 2 keV image in Fig. B.1), due to the high absorption along the line of sight. Instead, in the 0.5 − 2 keV band, a point source appears to the South of XMMU J170147.3−421407 (see Fig. B.4). This source has an infrared counterpart (GLIMPSE G344.0085−001748) and a Gaia counterpart (Source id 5966304379880060544 in Gaia DR3 Forveille & Kotak 2021). The parallax of the Gaia source is of 5.763 ± 0.045 mas, equivalent to a distance of about 170 pc. This nearby distance rules out an association of the optical source with XMMU J170147.3−421407 whose high absorption indicates a larger distance (see Sect. 3.2).
In summary, the newly discovered X-ray object XMMU J170147.3−421407 has an extension of about 3′ (along its longer axis), with two substructures likely belonging to same object, a high absorption and a hard spectral index. The possible association of this source with HESS J1702−420A is discussed in Sect. 3.2.
2.3. Spectral analysis of the HESS J1702−420A region
Due to the absence of a clear X-ray signal, we derived upper limits on the diffuse X-ray emission in the HESS J1702−420A region (Sect. 2.3.1). Under a one-zone leptonic hypothesis, we then obtained upper limits on the average magnetic field by jointly fitting the X-ray (XMM-Newton) and γ-ray (H.E.S.S.) data (Sect. 2.3.2). The multi-wavelength X-ray and γ-ray data modeling was performed using the custom Gammapy-based scripts, as described in Appendix A. As a crosscheck, we repeated our analysis (presented in Sect. 2.3.1) using the standard Sherpa X-ray software (Freeman et al. 2001; Doe et al. 2007), obtaining consistent results (see Fig. B.5).
Obtaining a reliable upper-limit on an extended region is a challenging task since it requires an accurate description of the instrumental and astrophysical backgrounds in the XMM-Newton field of view. As the instrumental background can strongly vary across the field of view5, it could not be estimated in a reliable way from different regions in the camera. Therefore we used a “double subtraction technique” (see, e.g., Acero et al. 2009, 2013) with a 0.06° circle (corresponding to the 1σ size of HESS J1702−420A) as the “on” region and a nearby “off” region of the same size (see Fig. B.2). In each region the instrumental background was estimated locally from archival filter wheel closed (FWC) observations6. The “off” region was used to estimate the astrophysical background which we modeled as a TbAbs-absorbed power law model. In the “on” region, a model was added on top of the astrophysical background, in order to look for a possible X-ray signal in the HESS J1702−420A region; namely, we tested an absorbed power law (Sect. 2.3.1) and an absorbed electron synchrotron model (Sect. 2.3.2). The spectral parameters of the astrophysical background estimated from the “off” region were jointly fitted with the source model in the “on” region. Due to strong spatial variation of the instrumental spectral lines in the PN camera and despite our double subtraction method, the reliability of the PN instrumental background was not satisfactory for such an extended region and we therefore limited this analysis to MOS1 and MOS2 data.
2.3.1. Upper limits on the diffuse X-ray emission
We explored the multi-dimensional likelihood surface by varying the flux normalization of the additional signal model (a TbAbs-absorbed power law) and simultaneously marginalized over all the free background nuisance parameters. This allowed us to derive likelihood profiles for the de-absorbed X-ray signal flux in the HESS J1702−420A region, for different assumptions on its spectral index and absorption column density (see Fig. 3). The assumed values for nh and Γ correspond to extreme cases that are expected to enclose the real ones. We then computed the (3, 2, 1) σ upper limits on the de-absorbed energy flux by integrating the corresponding spectra between 2 and 10 keV:
 (1)
(1)
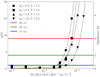 |
Fig. 3. Likelihood profiles for the de-absorbed differential flux at 2.5 keV of a putative X-ray signal inside the 0.06°-radius HESS J1702−420A region, for different values for the assumed absorption column density (nh) and spectral index (Γ). |
The upper limits obtained are reported in Table B.1. Each combination of assumed nh and Γ generates upper limits with relative differences within ≈30%. If we conservatively consider the highest upper limit for each combination, the corresponding 3σ (2σ, 1σ) constraints on the diffuse X-ray emission in the HESS J1702−420A region are:
 (2)
(2)
2.3.2. Upper limits on the average magnetic field
In order to constrain the average magnetic field inside the 0.06°-radius HESS J1702−420A region, we performed a multi-wavelength modeling of the X-ray and TeV γ-ray emission using the new set of scripts described in Appendix A. To describe a hypothetical X-ray signal in the HESS J1702−420A region, we defined an electron synchrotron model with TbAbs absorption (obtained as a combination of the corresponding Naima and Xspec models within a common Gammapy framework). The synchrotron model depends on the ambient magnetic field value B and on the parameters of the assumed e± distribution, here an exponential-cutoff power law (ECPL):
![Mathematical equation: $$ \begin{aligned} \frac{\mathrm{d}N_{\rm e}}{\mathrm{d}E_{\rm e}}(E_{\rm e}) = A_{\rm e} \left(\frac{E_{\rm e}}{E_{\rm e}^*}\right)^{-\Gamma _{\rm e}} \text{ exp}\left[-\left(\frac{E_{\rm e}}{E_{\rm e}^\text{cut}}\right)\right]. \end{aligned} $$](/articles/aa/full_html/2022/11/aa44696-22/aa44696-22-eq3.gif) (3)
(3)
The same electron population was used also to predict the corresponding VHE γ-ray emission due to inverse-Compton up-scattering of cosmic microwave background (CMB) photons. The choice of such a minimal one-zone leptonic model was justified by the absence of a clear X-ray signal, which did not motivate more complex assumptions.
We adjusted the parameters of the electron distribution (Eq. (3)) to the publicly available TeV SED of HESS J1702−420A (A21) that was re-scaled to account for the finite emission fraction contained inside the 0.06°-radius spectral extraction region7. We then froze the value of the electron spectral index and fit all the remaining model parameters simultaneously to the XMM-Newton data spectra and H.E.S.S. SED data points. This allowed us to compute the likelihood profiles for the magnetic field that are shown in Fig. 4 (left panel). The resulting magnetic field upper limits are reported in Table B.2. As an example, the right panel of Fig. 4 shows the inverse-Compton and synchrotron models corresponding to the 1, 2, and 3σ upper limits on B, for a particular choice of (fixed) electron cutoff and absorption column density.
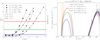 |
Fig. 4. Multi-wavelength fit of XMM-Newton and HESS data using a one-zone electron synchrotron model. Left: likelihood profiles for the average magnetic field inside the 0.06°-radius HESS J1702−420A region, assuming a one-zone leptonic model, for different values of assumed absorption column density (nh) and electron cutoff energy ( |


Independently of the assumed values for the nuisance parameters, the magnetic field is constrained to be lower than 1.45 μG at 2σ, approximately corresponding to a 95.5% confidence level. This value is low, compared to the average Galactic magnetic field of ≈3 μG, a fact that challenges the leptonic emission hypothesis for HESS J1702−420A, at least under a simple one-zone scenario.
3. Discussion
This section presents the implications of the new XMM-Newton observation on the nature of HESS J1702−420A, focusing on its possible association with Suzaku src B (Sect. 3.1) and XMMU J170147.3−421407 (Sect. 3.2).
3.1. HESS J1702−420A association with Suzaku src B
A21 suggested that the unidentified source Suzaku src B could be a powerful isolated pulsar responsible for the VHE γ-ray emission coming from a possible association of HESS J1702−420A via a leptonic (inverse-Compton) emission scenario. This idea is now challenged by the non-detection of an extended X-ray synchrotron nebula around Suzaku src B, which appears to be point-like in the XMM-Newton data (see Fig. 2, bottom-left panel). This argument is, however, inconclusive, since evolved γ-ray bright PWNe can have suppressed X-ray emission due to the complete cooling of their most energetic electrons (Acero 2017). However the spectral analysis presented in Sect. 2.1 can be used to discuss a possible pulsar-PWN association between Suzaku src B and HESS J1702−420A.
An X-ray absorption column density as high as nh = (5.1 ± 1.1)×10−22 cm−2 implies that Suzaku src B is located further away than 7 kpc. This is shown in Fig. 5 (left panel), which compares the absorption level required by the X-ray measurement with the total cumulative hydrogen column density measured in the Mopra (Braiding et al. 2018) and SGPS (McClure-Griffiths et al. 2005) radio surveys, averaged over a 15″ radius circle centered on Suzaku src B. The total gas density integrated up to a distance of 7 kpc never reaches that derived from the X-ray spectral fit. The gas velocities were converted to distance measures using the Galaxy model presented in Vallée (2016), and assuming that all the gas up to −150 km s−1 is located at the near kinematic distance. The H.E.S.S. experiment is capable of detecting point-like sources around 7 kpc away only if they are intrinsically bright (≳1034 erg s−1) (HESS Collaboration 2018), with a required brightness for extended sources that is even higher. Therefore, regardless of the real nature of Suzaku src B, the high X-ray absorption measurement by itself does not suggest an association with the extended source HESS J1702−420A.
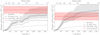 |
Fig. 5. Cumulative hydrogen column density in the direction of Suzaku src B (left) and XMMU J170147.3−421407 (right). The shaded gray region indicates the total level of systematic uncertainties, due the assumption of an average conversion factor XCO = 1.5 × 1020 cm−2 (K km s−1)−1 (Strong et al. 2004), which impacts the H2 measurement up to 30%, and an optically thin medium which can lead to underestimations of the HI content up to factor of 2 (Lau et al. 2018). The red band indicates the modeled column density required by the X-ray observations, with statistical errors only (see Table 1). |
Perhaps the most convincing reason to reject a classification of Suzaku src B as an isolated pulsar comes from the detection of an Fe spectral line in its spectrum, which implies instead an accreting compact object such as a cataclysmic variable (CV) system with thermal emission from the disk. This hypothesis is supported by the measured energy of the Fe line, (6.62 ± 0.06) keV, which is compatible with a mixture of the 6.4 keV and 6.7 keV Fe lines that are observed in other magnetized CVs (Xu et al. 2016). The hard measured X-ray spectrum is also in line with the expectation for magnetized CVs (Bernardini et al. 2012; Scaringi et al. 2010). Additional support to this hypothesis is provided by the evidence of spectral variability deriving from a comparison between the new flux measurement in the 2 − 10 keV band and the one carried out in 2008 with Suzaku by F11, the former being significantly higher (by a factor of 10) than the latter. This fact, also illustrated in Fig. B.3, indicates a strong flux increase between 2008 and 2021, which is not an expected feature for an isolated pulsar.
The existence of a possible infrared counterpart to Suzaku src B, called GLIMPSE G344.0901−00.1658, also points in the same direction.
In conclusion, our deep XMM-Newton observation provides sufficient evidence to affirm that, regardless of its real nature, Suzaku src B is not an isolated pulsar associated with HESS J1702−420A. Further studies will be needed to investigate its possible classification as a magnetized CV.
3.2. HESS J1702−420A association with XMMU J170147.3−421407
After excluding the possiblity of an association between HESS J1702−420A and Suzaku src B (Sect. 2.1) and estimating an unrealistically low magnetic field inside the HESS J1702−420A region, under a single-zone leptonic hypothesis (Appendix B.2), the simple leptonic scenario for the origin of HESS J1702−420A appears to be constrained. An open question remains as to whether XMMU J170147.3−421407 (Sect. 2.2) may be a PWN associated with HESS J1702−420A. Indeed, the chance of discovering an extended X-ray source with hard spectral index nearby a hard γ-ray source such as HESS J1702−420A based on mere chance is not expected to be high.
To confirm that a PWN is associated with HESS J1702−420A, XMMU J170147.3−421407 must first be shown to be a Galactic object, rather than an extra-Galactic one (e.g., an active Galactic nucleus, AGN). We therefore compared the absorption measure obtained from the X-ray fit to the cumulative hydrogen density on the line of sight, with the same method presented in Sect. 3.1, to investigate whether XMMU J170147.3−421407 might be located within the Milky way or otherwise. As shown in Fig. 5 (right panel), the best estimate that we can provide for the distance of XMMU J170147.3−421407 (given by the intersection of the solid red and black lines) is ≈4.7 kpc. Despite the large statistical and systematic uncertainties, suggesting that the actual source distance could be in the ≈2 − 8 kpc range, its interpretation as a Galactic object appears to be favorable.
Another element that must be taken into account is the strongly asymmetric morphology of XMMU J170147.3−421407 characterized by two distinct lobes with a hard X-ray index connected by a softer bridge. Despite being immediately suggestive of a microquasar interpretation, this peculiar shape is not incompatible with a PWN interpretation either. Indeed, previously reported cases of energetic PWNe show very similar structures, with double-jet morphologies characterized by extremely hard X-ray spectral indices (Maitra et al. 2017).
The remaining piece of evidence to be discussed is the ≈0.12° offset between the centroids of HESS J1702−420A and XMMU J170147.3−421407 which complicates their association since the X-ray emission from other known PWNe usually coincides with their hardest TeV emission peak (HESS Collaboration 2019). Still, it remains plausible that XMMU J170147.3−421407 could be a PWN powered by a yet undetected pulsar that has drifted away from the center of HESS J1702−420A due to a large proper motion, similarly to the Mouse and Geminga bow-shock nebulae, for instance (Klingler et al. 2018); geminga. In order to explore this hypothesis, we computed the cooling time of the electrons that may be responsible for the TeV emission of HESS J1702−420A. This value corresponds to an upper limit on their age, and can be used to set a lower limit on the putative pulsar’s runaway speed. The electron cooling time via inverse-Compton emission on CMB photons can be estimated using the analytic approximation presented in Eq. (40) of Khangulyan et al. (2014), while the synchrotron cooling time was computed following Blumenthal & Gould (1970). Figure 6 compares the inverse-Compton and synchrotron cooling times as a function of the electron energy, for different values of magnetic field B. The energy of the putative electrons producing the 50 − 100 TeV γ-ray emission of HESS J1702−420A via inverse Compton was estimated to be in the 100 − 400 TeV range (indicated by the yellow band in Fig. 6), using Eq. (1) from LHAASO Collaboration (2021). If we assume for example that B ≲ 1 μG, electrons in the 100 − 400 TeV energy range are predominantly cooled within a time scale of ≈30 kyr (inverse-Compton dominated losses). This means that the putative electron population responsible for the VHE emission of HESS J1702−420A must have an age of te ≤ 30 kyr. Assuming that HESS J1702−420A and XMMU J170147.3−421407 are connected, such a limit on the electron age implies that the X-ray source must be running away at a speed v ≳ dtan(0.12° )/te, where d is the distance from Earth of HESS J1702−420A. For a distance d of 2 (8) kpc, the resulting lower limit on the velocity of XMMU J170147.3−421407 is of ≈140 (550) km s−1, which is entirely compatible with the typical values for young runaway pulsars (Hobbs et al. 2005; Verbunt et al. 2017).
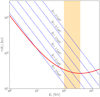 |
Fig. 6. Electron cooling time due to the inverse-Compton (red) and synchrotron (blue) processes. The yellow band indicates electron energy in the range 200 − 400 TeV, as needed to create the TeV emission of HESS J1702−420A (see the main text). |
In conclusion, we find that there is at least one scenario (high-speed runaway PWN in an inverse-Compton dominated cooling environment) in which an association between HESS J1702−420A and XMMU J170147.3−421407 is possible. We note, however that by requiring a B ≲ 1 μG, this is not an obvious interpretation and it will need to be further investigated. In particular, observations with better angular resolution (both in the X-ray and radio bands) will facilitate the search for a point-like source inside the diffuse structure of XMMU J170147.3−421407 whose discovery would potentially confirm its PWN nature and strengthen its association with HESS J1702−420A.
4. Conclusions
In this paper, we describe a new deep X-ray observation of HESS J1702−420A, the hard VHE γ-ray emission region inside HESS J1702−420, carried out with XMM-Newton. For a number of other initially unidentified HESS sources, the discovery of X-ray counterparts has represented the smoking gun pointing to a PWN classification, which implies a leptonic origin of their bulk TeV emission (HESS Collaboration 2012, 2019; Burgess et al. 2022). Here, we demonstrate that the case of HESS J1702−420A is different: this object is completely undetected in the X-ray range – a fact that poses a challenge to the simple leptonic interpretation of its TeV emission.
We first studied Suzaku src B, the only obvious candidate counterpart of HESS J1702−420A, and concluded that it is not an isolated pulsar powering a γ-ray bright PWN. This conclusion derived from a number of clues such as its point-like X-ray morphology, its large distance from Earth, its variable spectrum with a clear Fe line, and the existence of a possible infrared counterpart. All these elements taken into consideration indicate that Suzaku src B can indeed be considered a new cataclysmic variable source candidate.
In the absence of a clear X-ray detection, we derived upper limits on the diffuse de-absorbed X-ray flux inside a 0.06°-radius region corresponding to the 1σ contour of HESS J1702−420A: F(2 − 10 keV)≲5.4 × 10⁻⁵ keV cm−2 s−1 at 2σ (≈95.5%) confidence level. Assuming a one-zone leptonic model, in which the same electron population is radiating both in the X-ray (synchrotron) and VHE γ-ray (inverse-Compton) bands, we derived a tight constraint on the magnetic field by jointly fitting the XMM-Newton spectra and the HESS spectral energy distribution (SED): B ≤ 1.45 μG. This argument discourages a leptonic interpretation for the γ-ray emission of HESS J1702−420A, at least under a minimal one-zone hypothesis.
Finally, we report the discovery of a new X-ray source with extended (≈3′ along its longer axis) morphology and hard spectral index (1.99 ± 0.45), named XMMU J170147.3−421407. Given its absorption measure (nh ≈ 3 × 1022 cm−2), this unidentified object is most likely Galactic. Its peculiar shape, characterized by two distinct lobes connected by a diffuse bridge, is compatible with previously reported cases of PWNe with double-jet morphologies. Its ≈0.12° offset from the center of HESS J1702−420A does not prevent an association, provided that XMMU J170147.3−421407 is a PWN powered by a high-speed runaway pulsar (v ≳ 140 − 550 km s−1) and that the electrons inside HESS J1702−420A are primarily cooled down by inverse-Compton losses on the CMB field. In that case, a multi-zone leptonic scenario in which XMMU J170147.3−421407 is powered by freshly injected electrons and HESS J1702−420A by electrons with an age ≲30 kyr could not be excluded. One way to probe it could be to look for a faint X-ray or radio tail between the X-ray source and HESS J1702−420A. Still, we note that this hypothesis requires an extremely low magnetic field (B ≤ 1 μG) in the HESS J1702−420A region, and therefore does not appear to be straightforward.
In conclusion, the hard γ-ray object HESS J1702−420A remains unidentified, but the absence of a clear X-ray counterpart strongly challenges simple leptonic scenarios. The only remaining possibility for a leptonic interpretation of HESS J1702−420A appears to be an association with a nearby extended X-ray source with hard spectral index, which could be powered by a high-speed young pulsar. This possibility will need to be further investigated by means of X-ray or radio observations with better angular resolution. Finally, this work contains a multi-wavelength X-ray and γ-ray modeling based on a new set of scripts based on Gammapy, Naima and Xspec (Giunti & Terrier 2022). These scripts demonstrate the potential of the open-science approach and may be applied in the future to other analysis cases.
In the case where a background spectra is read, a Wstat is used in Xspec but the fit statistic is still labeled Cstat.
For a 15″ radius extraction region, the encircled energy fraction is about 70%. This loss of flux is corrected in the effective area computation using the arfgen tool with the modelee parameter.
Considering that the 1σ radius of a two-dimensional Gaussian encloses 1 − e−1/2 ≈ 0.3935 of its integral, we multiplied the SED provided by A21 by a factor of 0.39.
This means performing a likelihood-based match between the measured and model-predicted data after taking into account the instrument response functions.
Acknowledgments
The authors acknowledge financial support from Agence Nationale de la Recherche (grant ANR- 17-CE31-0014) and from LabEx UnivEarthS (ANR-10-LABX-0023 and ANR-18-IDEX-0001). This research made use of Astropy (http://www.astropy.org) (Astropy Collaboration 2013); astropy:2018, Numpy (Harris et al. 2020), iminuit (Dembinski 2020) and Matplotlib (Hunter 2007).
References
- Abdalla, H., Aharonian, F., Ait Benkhali, F., et al. 2021, A&A, 653, A152 [NASA ADS] [CrossRef] [EDP Sciences] [Google Scholar]
- Acero, F. 2017, Astrophys. Space Sci. Lib., 446, 47 [NASA ADS] [CrossRef] [Google Scholar]
- Acero, F., Ballet, J., Decourchelle, A., et al. 2009, A&A, 505, 157 [NASA ADS] [CrossRef] [EDP Sciences] [Google Scholar]
- Acero, F., Gallant, Y., Ballet, J., Renaud, M., & Terrier, R. 2013, A&A, 551, A7 [NASA ADS] [CrossRef] [EDP Sciences] [Google Scholar]
- Aharonian, F., Akhperjanian, A. G., Bazer-Bachi, A. R., et al. 2006, ApJ, 636, 777 [NASA ADS] [CrossRef] [Google Scholar]
- Aharonian, F., Akhperjanian, A. G., Barres Almeida, U., et al. 2008, A&A, 477, 353 [NASA ADS] [CrossRef] [EDP Sciences] [Google Scholar]
- Arnaud, K. A. 1996, ASP Conf. Ser., 101, 17 [Google Scholar]
- Astropy Collaboration (Robitaille, T. P., et al.) 2013, A&A, 558, A33 [NASA ADS] [CrossRef] [EDP Sciences] [Google Scholar]
- Astropy Collaboration (Price-Whelan, A. M., et al.) 2018, AJ, 156, 123 [Google Scholar]
- Bernardini, F., de Martino, D., Falanga, M., et al. 2012, A&A, 542, A22 [NASA ADS] [CrossRef] [EDP Sciences] [Google Scholar]
- Blumenthal, G. R., & Gould, R. J. 1970, Rev. Mod. Phys., 42, 237 [Google Scholar]
- Braiding, C., Wong, G. F., Maxted, N. I., et al. 2018, PASA, 35, e029 [NASA ADS] [CrossRef] [Google Scholar]
- Burgess, D. A., Mori, K., Gelfand, J. D., et al. 2022, ApJ, 930, 148 [NASA ADS] [CrossRef] [Google Scholar]
- Dembinski, H., Ongmongkolkul, P., Deil, C., et al. 2022, https://doi.org/10.5281/zenodo.6389982 [Google Scholar]
- Doe, S., Nguyen, D., Stawarz, C., et al. 2007, ASP Conf. Ser., 376, 543 [NASA ADS] [Google Scholar]
- Donath, A., Deil, C., Arribas, M. P., et al. 2015, Int. Cosmic Ray Conf., 34, 789 [NASA ADS] [Google Scholar]
- Donath, A., Deil, C., Terrier, R., et al. 2021, https://doi.org/10.5281/zenodo.5721467 [Google Scholar]
- Evans, I. N., Primini, F. A., Glotfelty, K. J., et al. 2010, ApJS, 189, 37 [NASA ADS] [CrossRef] [Google Scholar]
- Forveille, T., & Kotak, R. 2021, A&A, 649, E1 [NASA ADS] [CrossRef] [EDP Sciences] [Google Scholar]
- Freeman, P., Doe, S., & Siemiginowska, A. 2001, SPIE Conf. Ser., 4477, 76 [NASA ADS] [Google Scholar]
- Fujinaga, T., Bamba, A., Dotani, T., et al. 2011, PASJ, 63, S857 [NASA ADS] [CrossRef] [Google Scholar]
- Giunti, L., & Terrier, R. 2022, https://doi.org/10.5281/zenodo.7092736 [Google Scholar]
- Harris, C. R., Millman, K. J., van der Walt, S. J., et al. 2020, Nature, 585, 357 [NASA ADS] [CrossRef] [Google Scholar]
- HESS Collaboration (Abramowski, A., et al.) 2012, A&A, 548, A46 [NASA ADS] [CrossRef] [EDP Sciences] [Google Scholar]
- HESS Collaboration (Abdalla, H., et al.) 2018, A&A, 612, A1 [NASA ADS] [CrossRef] [EDP Sciences] [Google Scholar]
- HESS Collaboration (Abdalla, H., et al.) 2019, A&A, 621, A116 [NASA ADS] [CrossRef] [EDP Sciences] [Google Scholar]
- Hobbs, G., Lorimer, D. R., Lyne, A. G., & Kramer, M. 2005, MNRAS, 360, 974 [Google Scholar]
- Hunter, J. D. 2007, Comput. Sci. Eng., 9, 90 [NASA ADS] [CrossRef] [Google Scholar]
- Khangulyan, D., Aharonian, F. A., & Kelner, S. R. 2014, ApJ, 783, 100 [Google Scholar]
- Klingler, N., Kargaltsev, O., Pavlov, G. G., et al. 2018, ApJ, 861, 5 [NASA ADS] [CrossRef] [Google Scholar]
- Lau, J. C., Rowell, G., Voisin, F., et al. 2018, MNRAS, 483, 3659 [Google Scholar]
- Maitra, C., Acero, F., & Venter, C. 2017, A&A, 597, A75 [NASA ADS] [CrossRef] [EDP Sciences] [Google Scholar]
- LHAASO Collaboration (Cao, Z., et al.) 2021, Science, 373, 425 [Google Scholar]
- McClure-Griffiths, N. M., Dickey, J. M., Gaensler, B. M., et al. 2005, ApJS, 158, 178 [NASA ADS] [CrossRef] [Google Scholar]
- Piron, F., Djannati-Atai, A., Punch, M., et al. 2001, A&A, 374, 895 [NASA ADS] [CrossRef] [EDP Sciences] [Google Scholar]
- Posselt, B., Pavlov, G. G., Slane, P. O., et al. 2017, ApJ, 835, 66 [CrossRef] [Google Scholar]
- Scaringi, S., Bird, A. J., Norton, A. J., et al. 2010, MNRAS, 401, 2207 [NASA ADS] [CrossRef] [Google Scholar]
- Strong, A. W., Moskalenko, I. V., Reimer, O., Digel, S., & Diehl, R. 2004, A&A, 422, L47 [NASA ADS] [CrossRef] [EDP Sciences] [Google Scholar]
- Vallée, J. P. 2016, AJ, 151, 55 [Google Scholar]
- Verbunt, F., Igoshev, A., & Cator, E. 2017, A&A, 608, A57 [NASA ADS] [CrossRef] [EDP Sciences] [Google Scholar]
- Wilms, J., Allen, A., & McCray, R. 2000, ApJ, 542, 914 [Google Scholar]
- Xu, X.-J., Wang, Q. D., & Li, X.-D. 2016, ApJ, 818, 136 [NASA ADS] [CrossRef] [Google Scholar]
- Zabalza, V. 2015, Proc. Int. Cosmic Ray Conf., 922 [Google Scholar]
Appendix A: New recipes for the multi-wavelength modeling of X-ray and γ-ray data
We have developed a set of Python scripts dedicated to the multi-wavelength fit of X-ray and γ-ray data with physically motivated models, based on the Gammapy, Naima, and Xspec packages. These were developed on GitHub8 in the context of this work, but they may be generally applied to any spectral analysis of X-ray data (alone or jointly with γ-ray spectral or 3D data). They are therefore made available for download on the Zenodo archive (Giunti & Terrier 2022), to encourage their re-use and improvement in an open-source and open-science spirit.
The idea behind the analysis scripts is to create a framework in which the X-ray and γ-ray data are handled in a consistent way, thanks to the Dataset class of Gammapy, and fit together using the model libraries provided by Xspec and Naima. The main building blocks of the scripts are the StandardOGIPDataset and the SherpaSpectralModel classes. The StandardOGIPDataset is a special type of Gammapy Dataset dedicated to X-ray spectral data, implementing X-ray-specific features such as the energy “grouping”. The SherpaSpectralModel is instead a class that wraps the Xspec models (contained in the sherpa.astro.xspec module) in such a way that they can be used for fitting with Gammapy. Together with the NaimaSpectralModel feature of Gammapy, this allows us to adjust the electron or proton distribution parameters directly to the measured X-ray and γ-ray data using the “forward-folding”9 technique (Piron et al. 2001). For example (as demonstrated in Section 2.3.2), this framework makes it possible to easily fit X-ray data with a combination of absorption and electron synchrotron models, eventually including also black-bodies and spectral lines, while simultaneously modeling the inverse-Compton γ-ray based on the same electron distribution.
Appendix B: Additional material
 |
Fig. B.2. Spectral extraction regions for the three analyses described respectively in Sections 2.1 (upper left panel), 2.2 (upper right panel), and 2.3 (lower panel). In all cases the “on” region is shown in red, the background control region in green and the masked fluctuations in white. In the upper right panel, the “on” regions used for the spectral analysis of the Eastern and Western lobes of XMMU J170147.3−421407 are shown in cyan. All images show the XMM-Newton data (sum of PN and MOS cameras) in the 2 − 10 keV band. |
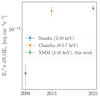 |
Fig. B.3. Integral de-absorbed X-ray flux of Suzaku src B as measured by Suzaku (F11), Chandra (2CXO J170157.2-421026) (Evans et al. 2010) and XMM-Newton (this work). |
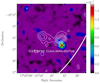 |
Fig. B.4. XMM-Newton flux image in the 0.5 − 2 keV energy band (color bar in units of 10−7 ph cm−2 s−1 per 4″×4″ pixel) with white contours showing the 2 − 10 keV data in the same region. More details are provided in the text. |
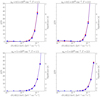 |
Fig. B.5. Representation of a successful crosscheck of the likelihood profile estimation performed with our custom Gammapy-based code (red) and the standard Sherpa tool (blue). For each combination of assumed nh and Γ, the results obtained with the two methods are completely compatible. |
Integral de-absorbed flux (see Equation 1) upper limits in the 2 − 10 keV energy band for the HESS J1702−420A region, in units of 10−14 TeV cm−2 s−1, as a function of the assumed absorption column density (nh) and spectral index (Γ).
Magnetic field upper limits in the HESS J1702−420A region, assuming a one-zone leptonic model, as a function of the assumed absorption column density (nh) and intrinsic cutoff of the putative electron population ( ).
).
All Tables
Integral de-absorbed flux (see Equation 1) upper limits in the 2 − 10 keV energy band for the HESS J1702−420A region, in units of 10−14 TeV cm−2 s−1, as a function of the assumed absorption column density (nh) and spectral index (Γ).
Magnetic field upper limits in the HESS J1702−420A region, assuming a one-zone leptonic model, as a function of the assumed absorption column density (nh) and intrinsic cutoff of the putative electron population ().
All Figures
|
Fig. 1. Flux image in the 2 − 10 keV energy band obtained from the dedicated XMM-Newton follow-up observation, in the international celestial reference system (ICRS) frame. The image is in units of 10−7 ph cm−2 s−1 per 4″ × 4″ pixel, and it has been smoothed with a σ = 7″ Gaussian filter. The TeV morphological models of HESS J1702−420A and HESS J1702−420B are overlaid. |
| In the text | |
|
Fig. 2. Spectral and morphological properties of the bright source Suzaku src B and XMMU J170147.3−421407. Top panel: XMM-Newton spectra of both sources. The extraction and background regions are shown in Fig. B.2. All spectra are fitted with an absorbed power-law model except for Suzaku src B where a Gaussian line is added to model the Fe–K line complex. The “on” Gaussian line for the PN data is shown in the figure. Bottom panel: X-ray profiles in the 2–10 keV energy band for both sources, extracted from a 390″ square box around their centroid position. The PSF was estimated from the same box profile using the 2D calibration PSF images at a reference energy of 3 keV. |
| In the text | |
|
Fig. 3. Likelihood profiles for the de-absorbed differential flux at 2.5 keV of a putative X-ray signal inside the 0.06°-radius HESS J1702−420A region, for different values for the assumed absorption column density (nh) and spectral index (Γ). |
| In the text | |
|
Fig. 4. Multi-wavelength fit of XMM-Newton and HESS data using a one-zone electron synchrotron model. Left: likelihood profiles for the average magnetic field inside the 0.06°-radius HESS J1702−420A region, assuming a one-zone leptonic model, for different values of assumed absorption column density (nh) and electron cutoff energy ( |
| In the text | |
|
Fig. 5. Cumulative hydrogen column density in the direction of Suzaku src B (left) and XMMU J170147.3−421407 (right). The shaded gray region indicates the total level of systematic uncertainties, due the assumption of an average conversion factor XCO = 1.5 × 1020 cm−2 (K km s−1)−1 (Strong et al. 2004), which impacts the H2 measurement up to 30%, and an optically thin medium which can lead to underestimations of the HI content up to factor of 2 (Lau et al. 2018). The red band indicates the modeled column density required by the X-ray observations, with statistical errors only (see Table 1). |
| In the text | |
|
Fig. 6. Electron cooling time due to the inverse-Compton (red) and synchrotron (blue) processes. The yellow band indicates electron energy in the range 200 − 400 TeV, as needed to create the TeV emission of HESS J1702−420A (see the main text). |
| In the text | |
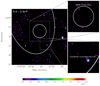 |
Fig. B.1. Same as figure 1, but integrated in the 0.5 − 2 keV energy band. |
| In the text | |
|
Fig. B.2. Spectral extraction regions for the three analyses described respectively in Sections 2.1 (upper left panel), 2.2 (upper right panel), and 2.3 (lower panel). In all cases the “on” region is shown in red, the background control region in green and the masked fluctuations in white. In the upper right panel, the “on” regions used for the spectral analysis of the Eastern and Western lobes of XMMU J170147.3−421407 are shown in cyan. All images show the XMM-Newton data (sum of PN and MOS cameras) in the 2 − 10 keV band. |
| In the text | |
|
Fig. B.3. Integral de-absorbed X-ray flux of Suzaku src B as measured by Suzaku (F11), Chandra (2CXO J170157.2-421026) (Evans et al. 2010) and XMM-Newton (this work). |
| In the text | |
|
Fig. B.4. XMM-Newton flux image in the 0.5 − 2 keV energy band (color bar in units of 10−7 ph cm−2 s−1 per 4″×4″ pixel) with white contours showing the 2 − 10 keV data in the same region. More details are provided in the text. |
| In the text | |
|
Fig. B.5. Representation of a successful crosscheck of the likelihood profile estimation performed with our custom Gammapy-based code (red) and the standard Sherpa tool (blue). For each combination of assumed nh and Γ, the results obtained with the two methods are completely compatible. |
| In the text | |
Current usage metrics show cumulative count of Article Views (full-text article views including HTML views, PDF and ePub downloads, according to the available data) and Abstracts Views on Vision4Press platform.
Data correspond to usage on the plateform after 2015. The current usage metrics is available 48-96 hours after online publication and is updated daily on week days.
Initial download of the metrics may take a while.