Fig. 2.
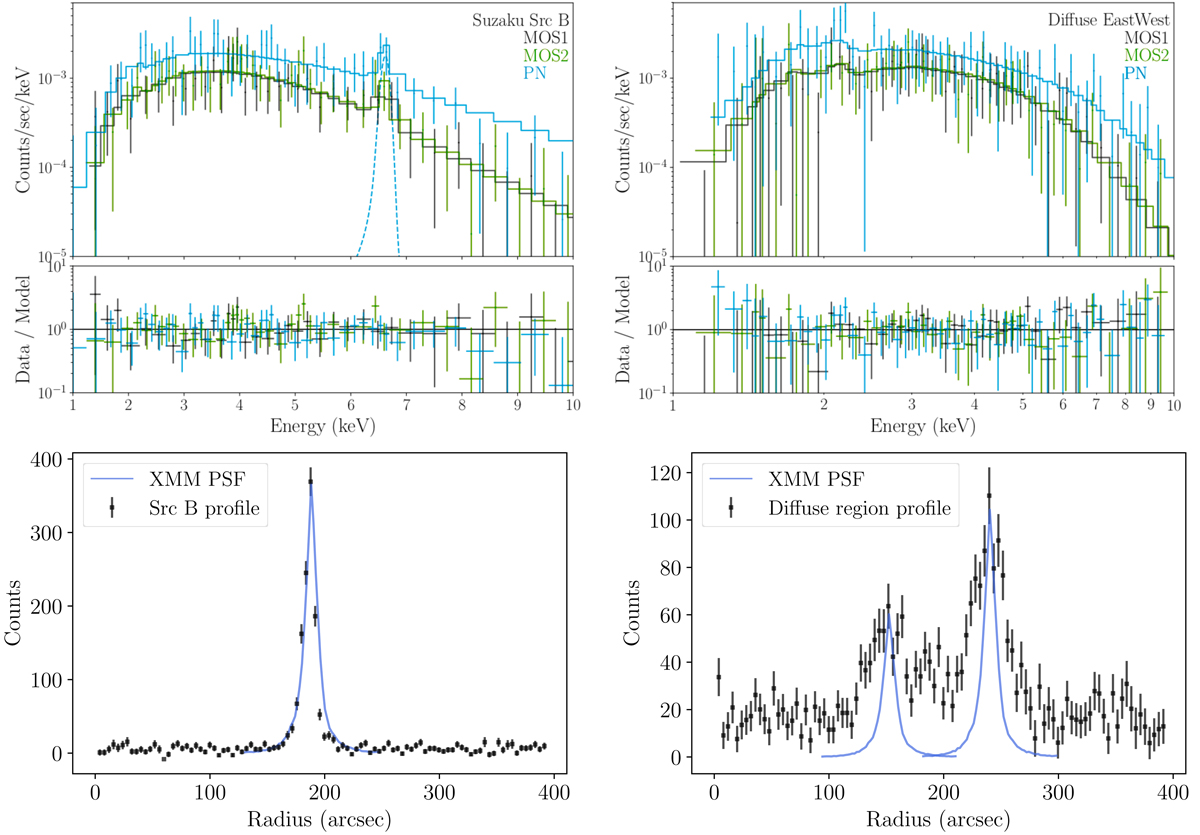
Download original image
Spectral and morphological properties of the bright source Suzaku src B and XMMU J170147.3−421407. Top panel: XMM-Newton spectra of both sources. The extraction and background regions are shown in Fig. B.2. All spectra are fitted with an absorbed power-law model except for Suzaku src B where a Gaussian line is added to model the Fe–K line complex. The “on” Gaussian line for the PN data is shown in the figure. Bottom panel: X-ray profiles in the 2–10 keV energy band for both sources, extracted from a 390″ square box around their centroid position. The PSF was estimated from the same box profile using the 2D calibration PSF images at a reference energy of 3 keV.
Current usage metrics show cumulative count of Article Views (full-text article views including HTML views, PDF and ePub downloads, according to the available data) and Abstracts Views on Vision4Press platform.
Data correspond to usage on the plateform after 2015. The current usage metrics is available 48-96 hours after online publication and is updated daily on week days.
Initial download of the metrics may take a while.