Fig. 5.
Download original image
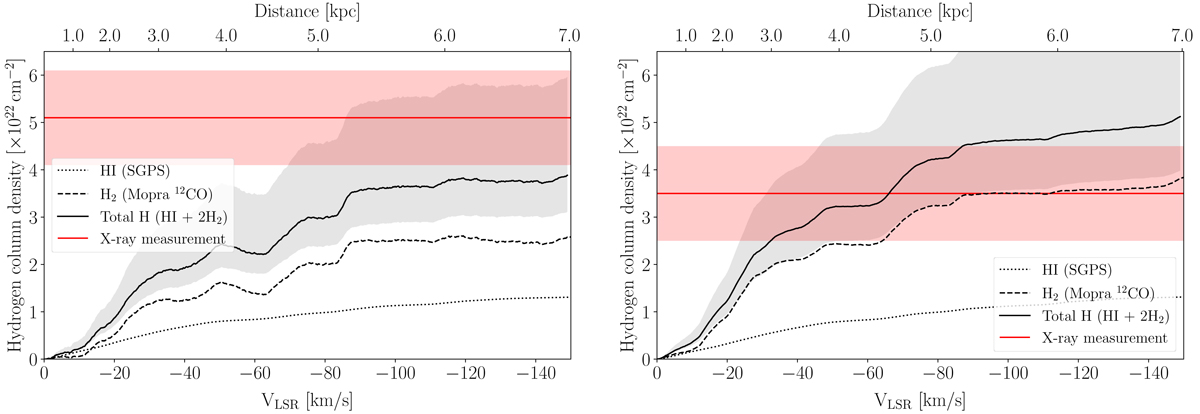
Cumulative hydrogen column density in the direction of Suzaku src B (left) and XMMU J170147.3−421407 (right). The shaded gray region indicates the total level of systematic uncertainties, due the assumption of an average conversion factor XCO = 1.5 × 1020 cm−2 (K km s−1)−1 (Strong et al. 2004), which impacts the H2 measurement up to 30%, and an optically thin medium which can lead to underestimations of the HI content up to factor of 2 (Lau et al. 2018). The red band indicates the modeled column density required by the X-ray observations, with statistical errors only (see Table 1).
Current usage metrics show cumulative count of Article Views (full-text article views including HTML views, PDF and ePub downloads, according to the available data) and Abstracts Views on Vision4Press platform.
Data correspond to usage on the plateform after 2015. The current usage metrics is available 48-96 hours after online publication and is updated daily on week days.
Initial download of the metrics may take a while.