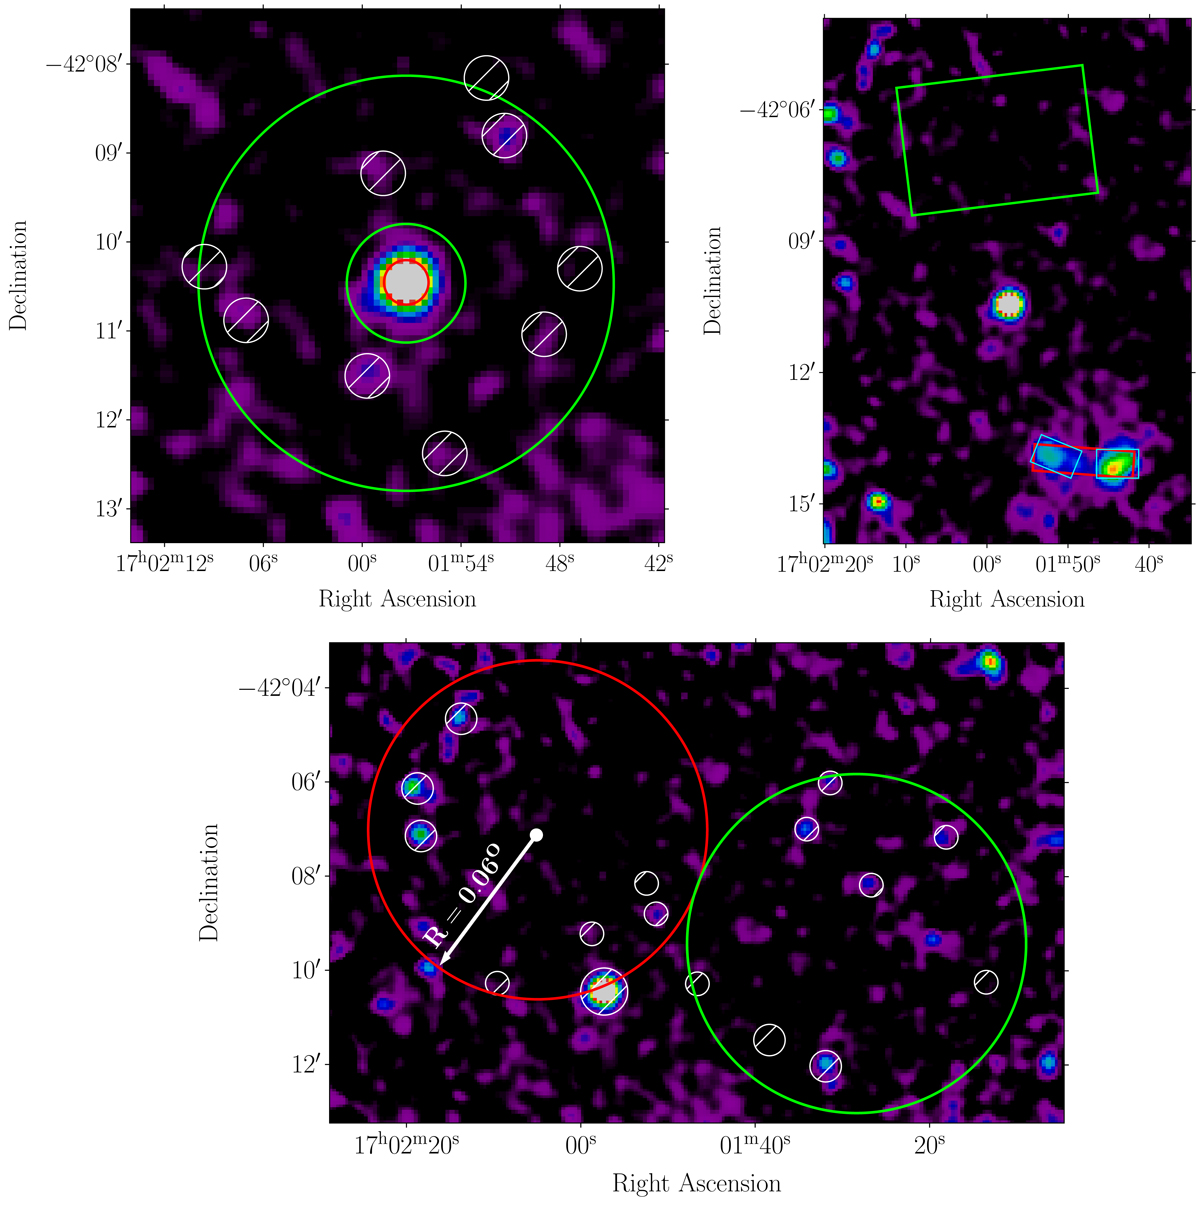
Fig. B.2.
Download original image
Spectral extraction regions for the three analyses described respectively in Sections 2.1 (upper left panel), 2.2 (upper right panel), and 2.3 (lower panel). In all cases the “on” region is shown in red, the background control region in green and the masked fluctuations in white. In the upper right panel, the “on” regions used for the spectral analysis of the Eastern and Western lobes of XMMU J170147.3−421407 are shown in cyan. All images show the XMM-Newton data (sum of PN and MOS cameras) in the 2 − 10 keV band.
Current usage metrics show cumulative count of Article Views (full-text article views including HTML views, PDF and ePub downloads, according to the available data) and Abstracts Views on Vision4Press platform.
Data correspond to usage on the plateform after 2015. The current usage metrics is available 48-96 hours after online publication and is updated daily on week days.
Initial download of the metrics may take a while.