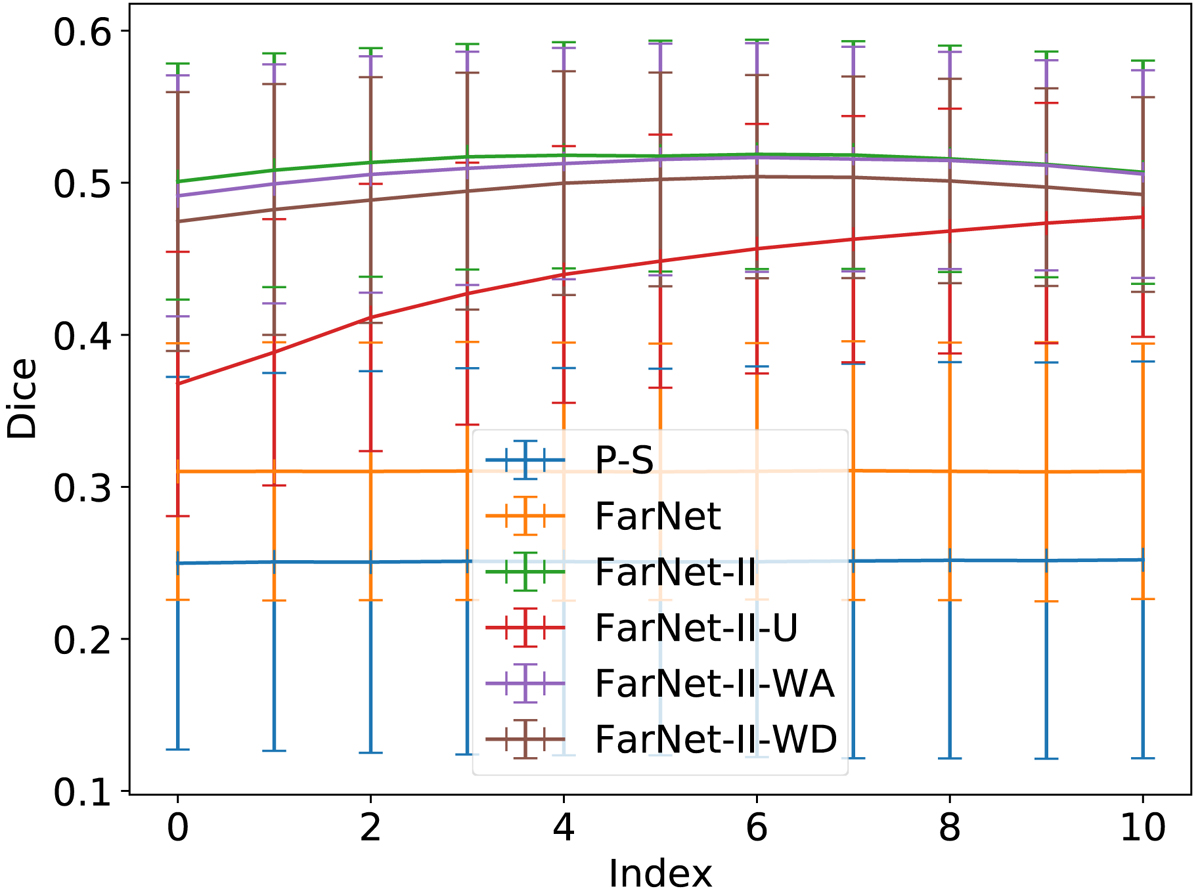
Fig. 7.
Download original image
Dice coefficient per method, as a function of the position of the images on the output sequences of 11 elements. This figure includes the ablated versions of FarNet-II. Thresholds for reliable detection for FarNet (Pi > 100) and the phase-sensitive method (S > 400) were not taken into account. Every region on outputs from FarNet with more than five contiguous pixels and a probability over 0.2 was used to compute the value. The vertical bars represent the standard deviation of the mean Dice coefficient over the 37 validation sets used in the study.
Current usage metrics show cumulative count of Article Views (full-text article views including HTML views, PDF and ePub downloads, according to the available data) and Abstracts Views on Vision4Press platform.
Data correspond to usage on the plateform after 2015. The current usage metrics is available 48-96 hours after online publication and is updated daily on week days.
Initial download of the metrics may take a while.