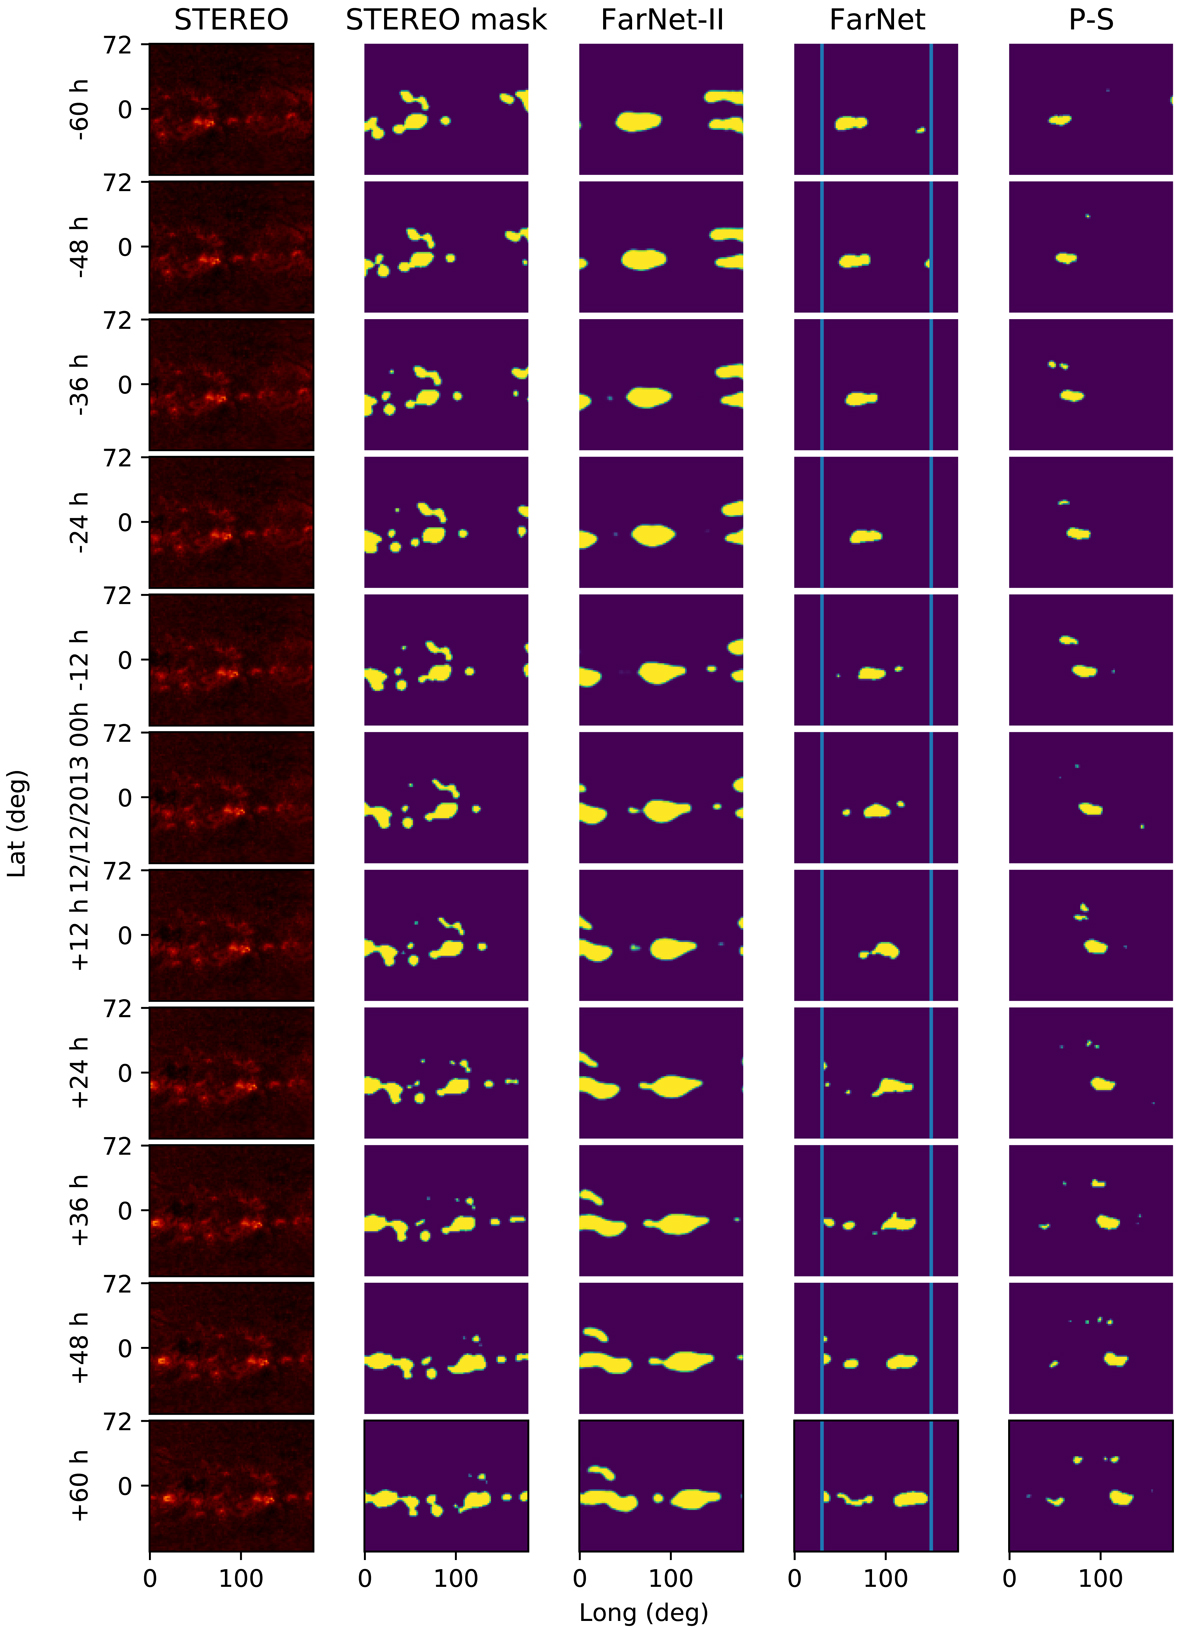
Fig. 3.
Download original image
Comparison of an output sequence, centered on December 12, 2013, for each method. The first column shows the square root of the STEREO data used to compute the activity masks. The second column shows the activity masks. Third to fifth columns show outputs from FarNet-II, FarNet, and the phase-sensitive method, respectively, for the region corresponding to the EUV masks on the second column. In Cols. 2–5, the color gradient goes from purple for zero or values near zero to yellow for values near one or one. Outputs from FarNet are only valid on the central range of 120 degrees of longitude (vertical blue lines). Seismic strength and integrated probability were not taken into account to select the regions on the outputs from FarNet and the phase-sensitive method. Every region that passed the post-processing was included.
Current usage metrics show cumulative count of Article Views (full-text article views including HTML views, PDF and ePub downloads, according to the available data) and Abstracts Views on Vision4Press platform.
Data correspond to usage on the plateform after 2015. The current usage metrics is available 48-96 hours after online publication and is updated daily on week days.
Initial download of the metrics may take a while.