Fig. 9
Download original image
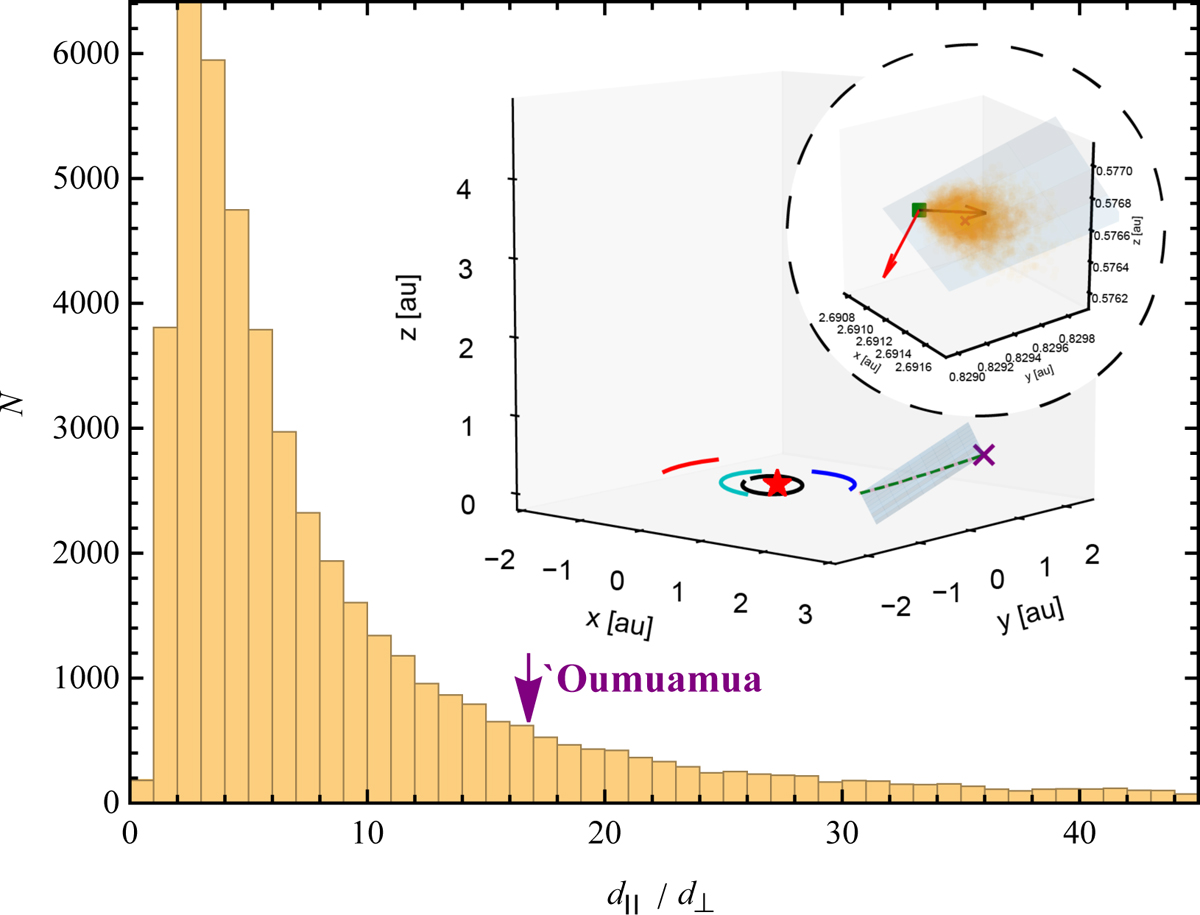
Fig. 9 – Histogram of the ratio between the parallel deviation and the normal deviation. The radiation-pressure-induced deviation from a Keplerian trajectory during Oumuamua’s sojourns through the inner Solar System are shown with the dashed green line. The red star represents the Sun, and solid black, cyan, blue, and red arcs indicate the orbits of Mercury, Venus, Earth, and Mars, respectively. The purple cross indicates the position of Oumuamua at the last record. In total, 5 × 10⁴ light-sail models with randomized initial spin orientations are integrated from Oumuamua’s discovery position for the same period of time. An additional Keplerian trajectory without radiation force is integrated, with which an orbital plane is defined. The circular inset panel zooms in to show Oumuamua’s last position (purple cross) surrounded by all light-sail models at the end of integration. And deviations from the Keplerian orbit (green square in the plane) are measured in the parallel and perpendicular directions to the orbital plane (indicated by two red arrows). The distribution of the ratio of the parallel displacement to the normal displacement peaks at ~3, while Oumuamua lies at ~17, which is obtained by applying the nongravitational acceleration suggested by Micheli et al. (2018).
Current usage metrics show cumulative count of Article Views (full-text article views including HTML views, PDF and ePub downloads, according to the available data) and Abstracts Views on Vision4Press platform.
Data correspond to usage on the plateform after 2015. The current usage metrics is available 48-96 hours after online publication and is updated daily on week days.
Initial download of the metrics may take a while.