| Issue |
A&A
Volume 674, June 2023
|
|
|---|---|---|
| Article Number | A47 | |
| Number of page(s) | 27 | |
| Section | Interstellar and circumstellar matter | |
| DOI | https://doi.org/10.1051/0004-6361/202142528 | |
| Published online | 29 May 2023 | |
The mechanical alignment of dust (MAD)
I. The spin-up process of fractal grains by a gas-dust drift
1
Universität Heidelberg, Zentrum für Astronomie, Institut für Theoretische Astrophysik,
Albert-Ueberle-Straße 2,
69120
Heidelberg, Germany
e-mail: This email address is being protected from spambots. You need JavaScript enabled to view it.
2
Universität Heidelberg, Interdisziplinäres Zentrum für Wissenschaftliches Rechnen,
Im Neuenheimer Feld 205,
69120
Heidelberg, Germany
Received:
26
October
2021
Accepted:
12
February
2023
Abstract
Context. Observations of polarized light emerging from aligned dust grains are commonly exploited to probe the magnetic field orientation in astrophysical environments. However, the exact physical processes that result in a coherent large-scale grain alignment are still far from being fully constrained.
Aims. In this work, we aim to investigate the impact of a gas-dust drift on a microscopic level, potentially leading to a mechanical alignment of fractal dust grains and subsequently to dust polarization.
Methods. We scanned a wide range of parameters of fractal dust aggregates in order to statistically analyze the average grain alignment behavior of distinct grain ensembles. In detail, the spin-up efficiencies for individual aggregates were determined utilizing a Monte Carlo approach to simulate the collision, scattering, sticking, and evaporation processes of gas on the grain surface. Furthermore, the rotational disruption of dust grains was taken into account to estimate the upper limit of possible grain rotation. The spin-up efficiencies were analyzed within a mathematical framework of grain alignment dynamics in order to identify long-term stable grain alignment points in the parameter space. Here, we distinguish between the cases of grain alignment in the direction of the gas-dust drift and the alignment along the magnetic field lines. Finally, the net dust polarization was calculated for each collection of stable alignment points per grain ensemble.
Results. We find the purely mechanical spin-up processes within the cold neutral medium to be sufficient enough to drive elongated grains to a stable alignment. The most likely mechanical grain alignment configuration is with a rotation axis parallel to the drift direction. Here, roundish grains require a supersonic drift velocity, while rod-like elongated grains can already align for subsonic conditions. We predict a possible dust polarization efficiency in the order of unity resulting from mechanical alignment. Furthermore, a supersonic drift may result in a rapid grain rotation where dust grains may become rotationally disrupted by centrifugal forces. Hence, the net contribution of such a grain ensemble to polarization drastically reduces.
In the presence of a magnetic field, the drift velocity required for the most elongated grains to reach a stable alignment is roughly one order of magnitude higher compared to the purely mechanical case. We demonstrate that a considerable fraction of a grain ensemble can stably align with the magnetic field lines and report a possible dust polarization efficiency of 0.6–0.9, indicating that a gas-dust drift alone can provide the conditions required to observationally probe the magnetic field structure. We predict that magnetic field alignment is highly inefficient when the direction of the gas-dust drift and magnetic field lines are perpendicular.
Conclusions. Our results strongly suggest that mechanical alignment has to be taken into consideration as an alternative driving mechanism where the canonical radiative torque alignment theory fails to account for the full spectrum of available dust polarization observations.
Key words: dust / extinction / ISM: magnetic fields / ISM: kinematics and dynamics / polarization / methods: numerical
© The Authors 2023
 Open Access article, published by EDP Sciences, under the terms of the Creative Commons Attribution License (https://creativecommons.org/licenses/by/4.0), which permits unrestricted use, distribution, and reproduction in any medium, provided the original work is properly cited.
This article is published in open access under the Subscribe to Open model. This email address is being protected from spambots. You need JavaScript enabled to view it. to support open access publication.
1 Introduction
Magnetic fields play a quintessential role in the physics of the interstellar medium (ISM) of galaxies as well as the subsequent star formation. Observationally, the magnetic field orientation can be probed by polarization measurements of aligned elongated dust grains. The fact that an ensemble of dust grains aligns coherently on large scales within the ISM was already independently proposed decades ago by Hiltner (1949a,b) and Hall (1949). Originally, this phenomenon was interpreted as a consequence of a supersonic velocity difference between the gas and the dust content of the ISM. Such a gas-dust drift would simply align spheroidal grains mechanically by means of minimizing their geometrical cross section (Gold 1952a,b). Hence, the dust polarization was expected to be related to the direction of the drift velocity.
Alternatively, mechanisms based on ferromagnetic alignment (e.g. Spitzer & Tukey 1949) or the alignment caused by internal paramagnetic dissipation (Davis & Greenstein 1949, 1951; Mathis 1986), respectively, were proposed. In such a case, the light polarized by dust was expected to be correlated with the magnetic field orientation. Furthermore, charged grains were believed to cause a grain precession around the direction of the magnetic field by means of the Rowland effect (Martin 1971).
However, for all of these magnetic-field-associated mechanisms to work, the dust requires a significant amount of grain rotation. Considering the average galactic field strength of about 10 μG, it seemed to be questionable whether ferromagnetic alignment or paramagnetic dissipation alone could account for the observed dust polarization. For instance, dust grains exposed to gas collisions would easily be kicked out of a long-term stable alignment (Jones & Spitzer 1967; Purcell & Spitzer 1971).
One way to remedy the situation was suggested in Jones & Spitzer (1967) by considering super-paramagnetic dust where small pallets of iron were baked into the grain material itself. Later, in Dolginov & Mytrophanov (1976) and Purcell (1979), it was noted that the Barnett effect (Barnett 1917) would be much more efficient in coupling paramagnetic grains to the magnetic field lines.
Moreover, considering the diffusive processes involved in the grain growth, the dust surface is usually expected to be highly irregularly shaped (Mathis & Whiffen 1989; Lazarían 1995b; Greenberg et al. 1995; Dominik & Tielens 1997; Beckwith et al. 2000; Wada et al. 2007; Kim et al. 2021). It was already pointed out in Purcell (1975, 1979) that regular dust grains may be subject to some long-term torques, leading to a rapid grain rotation. Purcell (1979) identified three processes for the potential spin-up of dust, namely the following: (i) the conversion of atomic (H) to molecular hydrogen (H2) on the grain surface, (ii) the rebound of colliding gas particles, and (iii) the absorption and subsequent emission of photo-electrons. However, it was first noticed by Dolginov & Mytrophanov (1976) that irregular grains may experience some additional systematic torques. The proposed systematic torques are inevitably related to the grains’ surface and would subsequently lead to super-thermal rotation compensating for random gas collisions. Hence, from then onward, an irregular shape of interstellar grains became an integral parameter for the description of grain alignment.
The spin-up process of such irregularly shaped grains in the presence of a radiation field was studied in Draine & Weingartner (1996) using the Discrete Dipole SCATtering (DDSCAT) code (see Draine & Flatau 1994). It was numerically demonstrated that starlight can lead to substantial radiative torques (RATs) acting on an irregular grain. In follow-up studies, further phenomena such as H2 formation (Draine & Weingartner 1997) and the thermal flipping of grains (Weingartner & Draine 2001) were incorporated. Later, an analytical model (AMO) of RAT alignment was provided by Lazarían & Hoang (2007a) based on a microscopic toy model in combination with numerical calculations using DDSCAT. The latter work initiated a series of studies (e.g. Hoang & Lazarían 2008, 2009, 2016; Lazarían & Hoang 2008, and references therein) dealing with the physical implications of RATs. Eventually, the AMO allowed for accurate modeling of synthetic dust polarization observations (e.g. Cho & Lazarían 2005; Bethell et al. 2007; Hoang & Lazarían 2014; Hoang et al. 2015; Reissl et al. 2016, 2020, 2021; Bertrang & Wolf 2017; Valdivia et al. 2019; Seifried et al. 2020; Kuffmeier et al. 2020), assuming a set of free alignment parameters to fine tune the model. More recently, an approach was presented in Hoang & Lazarían (2016) and Herranen et al. (2021) based on exact light scattering solutions of RAT physics to constrain the remaining free parameters of the AMO for a large ensemble of irregular grain shapes.
Actual observations suggest a certain predictive capability of the AMO (Andersson & Potter 2007, 2010; Whittet et al. 2008; Matsumura et al. 2011; Vaillancourt & Andersson 2015). For instance, a hallmark of RAT alignment is that the grain rotation scales with the strength of the radiation field. Hence, the AMO predicts for the grain alignment efficiency and the subsequent dust polarization to drop toward dense starless cores. This prediction appears to be partly supported by corresponding core observations (see e.g. Alves et al. 2014; Jones et al. 2015, 2016). However, other observations cast some doubt on whether the AMO covers the full range of observed grain alignment physics. For instance, Le Gouellec et al. (2020) present a statistical analysis of several observations of star-forming cores and conclude that the grain alignment efficiency seems to be higher as predicted by the AMO.
Moreover, abrupt changes in the polarization direction allows the surmise that the magnetic field lines do not necessarily dictate the grain alignment direction (Rao et al. 1998; Cortes et al. 2006; Tang et al. 2009). Indeed, it was already noted in Lazarían & Hoang (2007a) that dust grains may align in the direction of a strong directed radiation field. However, it is commonly speculated in literature that a sudden change in the polarization direction and the high degree of dust polarization of some cores may better be accounted for by means of mechanical alignment, especially in the presence of molecular outflows (see e.g. Sadavoy et al. 2019; Takahashi et al. 2019; Kataoka et al. 2019; Cortes et al. 2021; Pattle et al. 2021, and references therein). In particular, observations of a proto-stellar system presented in Kwon et al. (2019) strongly suggest that more than one grain alignment mechanism seems to be simultaneously at work. The required gas-dust drift may arise due to magnetohydrodynamic turbulence (Yan & Lazarían 2003) or resonant drag instabilities (Hopkins & Squire 2018; Squire et al. 2021).
To date, an analytical description of mechanic alignment comparable to the AMO of RAT alignment is still a matter of ongoing research. Attempts to model the impact of mechanical alignment to dust polarization remain mostly qualitative in nature (see e.g. Kataoka et al. 2019). An early model was provided in Lazarían (1994) based on the original Gold alignment mechanism by incorporating internal dissipation of energy within the grain. This first attempt to account for mechanically driven dust alignment in the presence of a magnetic field, however, did not take the increased spin-up efficiency of irregularly shaped grains into consideration. Hence, this model required a super-sonic gas-dust drift (see also Lazarían 1995a, 1997) to work at all. A description of mechanical alignment based on a toy model similar to that of the AMO was provided in Lazarían & Hoang (2007b). This description also allowed for a subsonic alignment, but the grain shape itself still remained a free parameter. About a decade later, numerical studies were provided by Das & Weingartner (2016) and Hoang et al. (2018), describing the physical processes of the mechanical torque (MET) acting on irregular grain shapes. Here, the irregular grains were modeled by means of cubical structures and Gaussian random spheres. However, these studies remain inconclusive concerning the exact set of parameters that would allow for long-term stable mechanical alignment since they only provide limited data for a few distinct grain shapes.
The aim of this paper is to examine the effectiveness of mechanical alignment of dust (MAD) for large ensembles of distinct fractal grain shapes. In our study the grain shapes are modeled as fractal aggregates composed of smaller building blocks. We present a novel method to simulate the spin-up process of such aggregates by means of Monte-Carlo (MC) simulations. The paper is structured as follows: First, in Sect. 2 we introduce the methods and grain parameters applied to mimic the growth of fractal dust aggregates. Then, in Sect. 3 we present the gas-dust interaction processes considered in our simulations. In Sect. 4 we outline the MC scheme applied to simulate specific mechanical alignment efficiencies. The physical processes and conditions that give rise to METs, drag torques, and paramagnetic torques are discussed in Sects. 5–7, respectively. The equations governing the grain alignment dynamics are introduced in Sect. 8. We outline the considered methods and measures to account for dust destruction and polarization in Sect. 9. Our results are presented Sect. 10. Finally, Sect. 11 is devoted to the summary and outlook.
2 Dust grain model
The process of aggregation of small primary particles (so-called monomers) leads to complex fractal dust grains (see e.g. Beckwith et al. 2000). The total number of monomers Nmon scales with
 (1)
(1)
where kf is a scaling constant in the order of unity, amean is the mean monomer radius, Df is the fractal dimension of the entire aggregate, and Rgyr is the radius of gyration (see below). Note that a grain with Df = 1.0 would be like a rod while a grain with Df = 3.0 would be spherical. The range of Df depends on the formation history of an individual grain. Diffusive grain growth processes such as aggregate-monomer collisions result in roundish grains with higher fractal dimensions while aggregateaggregate collisions lead to more elongated aggregates with a lower Df. A recent study by Hoang (2022) suggests that the gas-dust drift itself has an impact on the final grain shape.
In this paper, we construct fractal dust grains with the algorithm as outline in Skorupski et al. (2014). Monomers are consecutively added to an aggregate with Nmon > 2. Each new monomer position  is semi-randomly sampled where we demand a connection point to the aggregate with at least one other monomer and the distance from the center of mass needs to follow a scaling law (see Filippov et al. 2000) that can be written as:
 (2)
(2)
After each iteration we move all monomer positions such that the center of mass of the aggregate coincides with the origin of the coordinate system.
While dust aggregates with Df < 2.0 are observed in the laboratory (e.g. Bauer et al. 2019) for interstellar conditions such elongated grains are most likely short lived since they are to fragile to withstand super-thermal rotation (Lazarían 1995b). However, smaller grains consisting only of a few dozens of monomers may survive (Chakrabarty et al. 2007). Hence, in our study we consider a set of typical fractal dimensions of Df ∈ {1.6, 1.8, 2.0, 2.2, 2.4, 2.6}.
Commonly, fractal dust grain models are constructed utilizing a constant monomer size (see e.g. Kozasa et al. 1992; Shen et al. 2008). However, laboratory data suggest that a plethora of different materials form fractal aggregates composed of monomers with variable sizes (Karasev et al. 2004; Chakrabarty et al. 2007; Slobodrian et al. 2011; Kandilian et al. 2015; Salameh et al. 2017; Baric et al. 2018; Kelesidis et al. 2018; Wu et al. 2020; Zhang et al. 2020; Kim et al. 2021). The size distribution of the monomers itself may follow a lognormal distribution (Köylü & Faeth 1994; Lehre et al. 2003; Slobodrian et al. 2011; Bescond et al. 2014; Kandilian et al. 2015; Liu et al. 2015; Wu et al. 2020; Zhang et al. 2020)
![Mathematical equation: $p\left( {{a_{{\rm{mon}}}}} \right) = {1 \over {\sqrt {2\pi } \ln \left( {{\sigma _{{\rm{mon}}}}} \right){a_{{\rm{mon}}}}}}\exp \left[ { - \left( {{{\ln \left( {{a_{{\rm{mon}}}}/{a_{{\rm{mean}}}}} \right)} \over {\ln \left( {{a_{{\rm{mon}}}}} \right)}}} \right)} \right],$](/articles/aa/full_html/2023/06/aa42528-21/aa42528-21-eq4.png) (3)
(3)
where σmon is the standard deviation of possible monomer sizes. In order to construct our dust aggregates we take typical laboratory values of σmon = 1.25 nm, amean = 16 nm, and for the scaling factor we choose kf = 1.3 (Salameh et al. 2017; Wang et al. 2019; Wu et al. 2020; Zhang et al. 2020; Kim et al. 2021). All monomer sizes are sampled from Eq. (3) within the limits of amon ∈ [10 nm; 100 nm] until a certain volume of
 (4)
(4)
is reached. This choice is also consistent with the model based on observations of dust extinction as presented in Mathis & Whiffen (1989) with amon = 5 nm. whereas in more recent studies aggregate models are utilized with a monomer sizes in the order of amon ≈ 100 nm (e.g Seizinger et al. 2012; Tazaki et al. 2019). We note that the sizes of the last three monomer are biased such that an exact effective radius of
 (5)
(5)
is guaranteed for each individual grain.
Finally, the inertia tensor of the entire aggregate is calculated. This allows for a unique coordinate system to be defined for each grain where the moments of inertia  are along the grain’s principal axes â1, â2, and â3, respectively (compare Fig. 1 and also Appendix A for greater details). In total we construct individual grains with 100 random seeds and a set of distinct sizes of aeff ∊ {50 nm, 100 nm, 200 nm, 400 nm, 800 nm} for each fractal dimension Df leading to an ensemble of 3000 unique grains. As material of the dust we assume silicate with a typical material density of ρdust = 3000 kg m−3.
3 Gas-dust interaction
3.1 The gas velocity distribution for drifting dust
The momentum transfer from the gas phase onto the dust surface depends on the number of impinging gas particles per unit time and their velocity υg. All gas quantities are defined with respect to the lab-frame {ê1, ê2, ê3}. The correlation between the lab-frame and the target-frame is depicted in Fig. 2.
As for the gas component we assume an ideal gas of hydrogen atoms surrounding the dust grain. Hence, the velocities of individual atoms is governed by the Maxwell-Boltzmann distribution. This distribution predicts for the most likely velocity of all gas atoms to be
 (6)
(6)
whereas
 (7)
(7)
is the average velocity. Here, the quantities Tg, mg, and kB are the gas temperature, the gas mass, and the Boltzmann constant, respectively.
If the gas and the dust phase decouple the grains move with a velocity υd relatively to the gas leading leading to a drift velocity of ∆ |υ| = |υg − υd|. In this case the Maxwell-Boltzmann distribution needs to be modified to account for the gas-dust drift. For this we introduce the dimensionless velocity s = υ/υth and subsequently the gas-dust drift may be represented by |∆s| = |sg − sd|. We emphasize that in this paper the drift ∆s is always antiparallel to the ê1 vector of the lab-frame. Without loosing generality for any element of the solid angle, dΩ = sin ϑdφdϑ, the dimensionless drift velocity may be written as ∆s = (∆s cos ϑ, ∆s sin ϑ, 0)T. Here, the quantity s represents an arbitrary gas velocity and ϑ and φ are the polar angle and the azimuthal angle with respect to the lab-frame. Hence, |s − ∆s|2 = (s − ∆s cos ϑ)2 + (∆s sin ϑ)2 = s2 + ∆s2 − 2s∆s cos ϑ. Consequently, the gas velocity distribution modified by the gas-dust drift within dΩ may be evaluated as (see e.g. Shull 1978; Guillet 2008; Das & Weingartner 2016, for further details)
![Mathematical equation: ${f_{{\rm{vel}}}}\left( {s,{\rm{\Delta }}s} \right){\rm{d\Omega }} = {\pi ^{ - 3/2}}{s^2}\exp \left[ { - {{\left( {{s^2} + {\rm{\Delta }}{s^2} - 2s{\rm{\Delta }}s\,\cos \vartheta } \right)}^2}} \right]{\rm{d\Omega }}.$](/articles/aa/full_html/2023/06/aa42528-21/aa42528-21-eq10.png) (8)
(8)
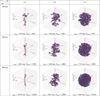 |
Fig. 1 Exemplary fractal dust grains with a number of monomers Nmon. Monomer sizes and Nmon are selected in such a way to guarantee an exact effective radius aeff. Grains in the same row possess identical radii aeff while gains in the same column are constructed with the same fractal dimension Df. The quantity aout is the radius of the smallest sphere enveloping the entire aggregate. Note that aeff approaches aout with increasing Df. Each grain’s coordinate system (target-frame) {â1, â2, â3} is unambiguously defined by its inertia tensor. |
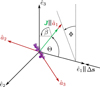 |
Fig. 2 Sketch of the relation of vectors and angles between the lab-frame {ê1, ê2, ê3} and the target-frame {â1, â2, â3}. In the applied MC setup the unit vector ê1 is antiparallel to the direction of the drift velocity Δs. The vectors ê2 and ê3 are chosen to create an orthonormal basis together with ê1 for the gas properties. The target-frame {â1, â2, â3} is defined by the moments of inertia of the dust aggregate. It is assumed that the grain is rapidly rotating around the principal axes â1 and that the angular momentum J of the grain is parallel to â1. The rotating dust may perform a stable precession with respect to Δs. Here, the quantities β, Θ, and Φ are the angles of rotation, alignment, and precession, respectively. |
3.2 The angular distribution of impinging gas panicles
For zeroc of individual gas trajectories within the enveloping sphere with radius aout are uniformly distributed i.e. isotropic. However, with an upcoming gas-dust drift Δs the gas trajectories become more likely to be parallel to the ê1 axis increasing the anisotropic component to the gas velocity field. The exact probability to find an certain angle ϑ between an individual gas direction with respect to ê1 may be evaluated as
![Mathematical equation: $\matrix{ {{P_{{\rm{\Delta }}s}}\left( \vartheta \right) = \int_0^\infty {{f_{{\rm{vel}}}}\left( {s,{\rm{\Delta }}s} \right){\rm{d}}s} } \hfill \cr { = {{\left( {2{\rm{\Delta }}s\,\cos \vartheta + \sqrt \pi \exp \left( {{\rm{\Delta }}{s^2}{{\cos }^2}\vartheta } \right)\left[ {1 + 2{\rm{\Delta }}{s^2}{{\cos }^2}\vartheta } \right]\left[ {1 + {\rm{erf}}\left( {{\rm{\Delta }}s\,\cos \vartheta } \right)} \right]} \right)\exp \left( { - {\rm{\Delta }}{s^2}/2} \right)} \over {{\pi ^{3/2}}\left[ {\left( {1 + {\rm{\Delta }}{s^2}} \right){{\rm{I}}_0}\left( {{\rm{\Delta }}{s^2}/2} \right) + {\rm{\Delta }}{s^2}{{\rm{I}}_1}\left( {{\rm{\Delta }}{s^2}/2} \right)} \right]}}} \hfill \cr } $](/articles/aa/full_html/2023/06/aa42528-21/aa42528-21-eq11.png) (9)
(9)
where erf(x) is the error function and In(x) is the modified Bessel function of the first kind. A plot of the distribution function P∆s(ϑ) is provided in Fig. 3.
3.3 The gas-dust collision probability
As soon as the dust starts to drift with respect to the gas the average gas velocity 〈υth〉 increases with respect to the reference frame of the grain because of the modified Maxwell-Boltzmann distribution. We mimic this process with an event-queue sampling a number of individual gas velocities υi beforehand from Eq. (8). Hence, each new gas particle is intersecting the enveloping sphere with radius aout with a rate of
 (10)
(10)
Here, we assumed a sphere with a radius four times larger than aout in order to guarantee the correct distribution of gas velocities and surface exposure (see also Sect. 4). The next time interval between two gas injection events in our MC experiment is then
 (11)
(11)
In detail, after each interval ∆ti,we inject a new gas particle from the surface of the enveloping sphere but with a random direction. Here, magnitude of the velocity follows Eq. (8) whereas the probability of the intersection direction on the surface of the enveloping sphere is sampled from Eq. (9). Naturally, each gas particle that enters the enveloping sphere does not necessarily collide with the aggregate. The exact gas-dust collision rate depends on the fraction of occupied volume within the enveloping sphere as well as the shape of the grain.
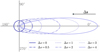 |
Fig. 3 Distribution function P∆s(ϑ). The gas-dust drift of Δs is antiparallel with the axis ê1 while the dust grain is situated in the origin of the lab-frame. For a gas-dust drift of Δs = 0 the gas velocity field is isotropic concerning the trajectories of individual gas particles. With Δs > 0 the gas is more likely to approach the gain with an trajectory parallel to Δs. Note that for a drift with Δs ≥ 1 the probability to find a gas particle approaching the dust under an angle of ϑ = 180° is already virtually zero. |
3.4 Gas sticking probability and desorption
Instead of being reflected specularly from the grain surface a fraction of the colliding gas particles may stick on the grain surface. The sticking mechanisms itself is still a matter of debate since the sticking and scattering of hydrogen heavily depends on the ability of the gas and dust phase to form a long lasting bond. This process is governed grain surface properties (Katz et al. 1999; Pirronello et al. 1999), dust materials (Katz et al. 1999; Cazaux & Tielens 2002), and the temperatures of the gas and dust phase (Hollenbach & Salpeter 1971; Habart et al. 2004; Le Bourlot et al. 2012).
Currently we are lacking these information despite substantial efforts to model the sticking probability. A commonly used sticking function may be written as
![Mathematical equation: $S\left( {{T_{\rm{d}}}} \right) = {\left[ {1 + 0.4\sqrt {{{{T_{\rm{d}}} + {T_{\rm{g}}}} \over {100\,{\rm{K}}}}} + 0.2\left( {{{{T_{\rm{g}}}} \over {100\,{\rm{K}}}}} \right) + 0.08{{\left( {{{{T_{\rm{g}}}} \over {100\,{\rm{K}}}}} \right)}^2}} \right]^{ - 1}}$](/articles/aa/full_html/2023/06/aa42528-21/aa42528-21-eq14.png) (12)
(12)
and is derived on the basis of statistical considerations (see Hollenbach & McKee 1979, and references therein). We note that this function provides phenomenologically the correct temperature dependency of sticking as presented in Fig. 4 but the exact coefficients may vastly differ for different grain materials and gas species.
We assume that the gas sticks sufficiently long enough on the grain surface to thermalize meaning the sticking gas particle reaches the same temperature as the dust grain. Consequently, the gas leaves the grain surface with an average velocity of
 (13)
(13)
by means of desorption.
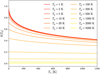 |
Fig. 4 Gas sticking probability S (Td) as a function of the dust grain temperature Td and different gas temperatures Tg. Both increasing gas and dust temperatures would decrease the probability for a gas particle to stick on the surface of a dust grain. We emphasize that 1 − S (Td) is the probability of gas scattering. |
4 The Monte Carlo (MC) simulation
By reason of the complex topology of the grain surface and the different processes involved in the gas-dust interaction we aimto calculate the resulting mechanical torque Γmech by means of MC simulations. For each dust aggregate we inject a gas particle in intervals of ∆tint from a random position on the surface of the enveloping sphere with radius 4aout. Using exactly aout for the surrounding sphere to inject gas particles may lead to an incorrect exposure of the grain surface due to self-shielding effects. The trajectories through the enveloping sphere are traced until the particle hits the dust or leaves the sphere. If gas hits the dust the particles may stick on the grain surface with a probability of S (Td), (see Eq. (12)) and may desorb at a later time step. For simplicity we assume that the gas cannot interact with itself.
Considering the discrete nature gas-dust interactions the MET as a result of gas impinging on the dust grain surface may be written as  where ∆Li is the change in angular momentum and T = ∑i ∆ti is the total simulation time. We note that with an increasing number of collisions Ncoll all MC simulation results eventually converge. Hence, we do not control for T but demand a total number of impinging gas particle of Ncoll = 103 for each MC simulation to terminate (see Appendix B).
Each MC simulation run is characterized by the set of dust parameters {aeff, Df, Td, seed} as well as the gas parameters {ng, Tg, ∆s}. As for the astrophysical environment we assume the typical conditions of the cold neutral medium (CNM) as listed in Table 1. Concerning the dust orientation we use Θ ∈ [0°; 180° ] for the alignment and β ∈ [0°; 360°] for the rotation with a resolution of 2°. We assume a rapid rotation around â1 and average all results over β in a final step.
Applied values of gas density ng, gas temperature Tg, dust temperature Td, gas-dust drift ∆s, and magnetic field strength B typical for the cold neutral medium (CNM).
5 Gas-induced torques
5.1 Colliding and scattering of gas particles on dust grains
The rate of gas particles within the velocity range [s, s + d s] colliding onto the surface of a perfectly spherical grain with radius aeff is  . The transfer of angular momentum per collision at a particular position r of the surface is
  cos δ. Here,
  is the normal vector of the dust surface and
  is the position on the surface where a distinct gas particle collides normalized by aeff. Note that the factor
  accounts for the fact that a gas particle impinging under any angle δ > 0° with respect to the normal
  of the grain surface cannot fully transfer its momentum. For instance, a gas particle touching the grain perfectly parallel to its surface, that is δ = 90° would not transfer any momentum at all. The resulting torque over all collision events is then Γcoll= ∫ ∆Lcolldℛcoll.
For dust where the grain surface can completely analytically be parameterized by the surface element  this yields a net torque of
 (14)
(14)
due to gas-dust collisions. Consequently, the dimension-less quantity Qcoll represents the efficiency of collision and encompasses both the grain surface topology as well as the torque amplification by the gas-dust drift. For instance Qcoll = |Qcoll| = 0 for a perfectly spherical grain but also for ∆s = 0 independent of grain shape.
In our MC simulation, the collision torque is the sum over all singular collision events. At the i-th gas-dust collision a small force Fi = mgυi/∆ti is exerted onto the grain surface. The collision torque changes then by a discrete amount of  . The resulting net MC torque of collision after a total simulation time T is
 (15)
(15)
Any sum of a finite amount of random vectors i.e. the direction of the gas trajectories of the impinging gas would not approximate the zero vector (given a large enough number of random vectors) but describe a random walk. Consequently, the efficiency Γcoll cannot reach zero in our MC simulations for a drift that is approaching ∆s = 0 as demanded by physical principles. Hence, we introduce the anisotropy factor of the gas direction defined as
 (16)
(16)
where γ = 1 represents an unidirectional gas stream and for γ = 0 the gas collisions are isotropic. It is important to note that this factor is similar to the one utilized, for example, in Hoang et al. (2014) to quantify the anisotropy of the radiation field. Finally, the collision torque efficiency can be evaluated as
 (17)
(17)
Exactly the same line of arguments holds for the efficiency Qsca of scattered gas particles. For a completely specularly reflecting grain surface Qsca = Qcoll. However, only a fraction of gas particles scatter because some particles may stick on the grain surface and desorp at a later times step. The scattering rate is ℛsca = ℛcoll (1 − S (Td)). In general the relation between the efficiency of scattering and the efficiency of collision is Qsca < Qcoll.
5.2 Thermal desorption of gas
The rate of gas particles that leave the surface of a spherical grain by means of desorption is related to  , (see Sect. 3.4). For simplicity we assume that the gas particles evaporate perpendicular to the grain surface i.e. parallel to the normal vector
  . The transfer of angular momentum yields then
  . Consequently, an analytical expression of the desorption torque reads
 (18)
(18)
The desorption torque resulting from our MC simulated can be written as
 (19)
(19)
Hence, the corresponding torque efficiency after Ndes desorption events from the grain surface can be evaluated via
 (20)
(20)
5.3 The total mechanical torque (MET)
From the section above follows that the total MET may be written as
 (21)
(21)
with a total mechanical efficiency of
 (22)
(22)
In our study the efficiency Qmech of each individual dust grain is a result of a MC simulation. Hence, this quantity comes inevitably with a certain level of numerical background noise (see Appendix B). This adds some additional ambiguity concerning the exact zero points of êiQmech. Here, we utilize a Savitzky-Golay filter (see Savitzky & Golay 1964) with a window length of a few degrees to minimize the MC noise while keeping the overall trends intact.
In Fig. 5 we present the individual components of Qmech as a function of the alignment angle Θ for an exemplary dust grain. For a gas-dust drift of ∆s = 0.1, the efficiencies are not well defined since the gas-dust interaction is dominated by the random component of the velocity field. With an increasing ∆s the characteristics of the efficiencies such as curve shape and zero points become significant. The exact curve of Qmech is now mostly due to the surface topology. Note that the magnitude of Qmech increases by about three orders of magnitude when the drift jumps from ∆s = 0.1 to ∆s = 1.0. However, the increase of Qmech is about two orders of magnitude for the jump from ∆s = 1.0 to ∆s = 10.0. This is because both the anisotropy as well as the average magnitude of the gas velocity affect the efficiency Qmech. The isotropic component of the gas velocity field deceases while simultaneously the average gas velocity increases for an ∆s = 10.0.
We emphasize that the curves of the efficiencies plotted in Fig. 5 are not representative because even grains with an identical fractal dimension Df and radius aeff. However, a different seed may have vastly different characteristics concerning mechanical alignment.
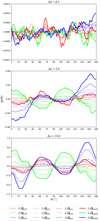 |
Fig. 5 Exemplary efficiencies of gas collision Qcoll, desorption Qdes, and scattering scattering Qsca as well as the total mechanical efficiency Qmech over alignment angle Θ and typical CNM conditions. All efficiencies are averaged over the angle β. The panels are for the different gas-dust drift of ∆s = 0.1 (top), ∆s = 1.0 (middle), and ∆s = 10.0 (bottom), respectively. We emphasize that all efficiencies are simulated for the grain with size aeff = 400 nm and fractal dimension Df = 2.0 depicted in the very center of Fig. 1. |
6 The drag torques of a rotating grain
Each gas particle that leaves the grain surface, may it be because of scattering or desorption, carries part of the total angular momentum of the gain away (see e.g. Purcell 1979; Draine & Weingartner 1996). We assume a rapid rotation of the dust grain with an angular velocity of ω parallel to â1. The additional velocity component a gas particle acquires by leaving the grain surface is  . Hence, the resulting transfer of angular momentum associated with the gas drag is
  , (see Das & Weingartner 2016). The resulting gas drag torque may be written as the analytical expression
 (23)
(23)
whereas the gas drag efficiency Qgas is parallel to â1. Consequently, the gas drag acts onto the rotating dust grain with a characteristic timescale of
 (24)
(24)
Note that, in contrast to the mechanical efficiency |Qmech|, the gas drag efficiency |Qgas| > 0 even for a perfectly spherical grain. We simulate the total gas drag that results from grain ration in our MC setup via
 (25)
(25)
where N1 is the number of gas particles leaving the grain surface. Hence, the unitless gas drag efficiency may be evaluated as
 (26)
(26)
While the gas drag should act exactly along the axes â1 of the target-frame we report some small nonzero values for the components |â2Qgas| ≪ |â1Qgas| and |â3Qgas| ≪ |â1Qgas|, respectively. The existence of such component is already noted in Das & Weingartner (2016). However, we cannot find any systematic angular dependencies and the magnitudes are of the same order as the overall MC noise level of about ±2.5 % (see Appendix B). Thus, in the following sections we assume |Qgas| = |â1Qgas|.
In Fig. 6 we show the gas drag timescale τgas for different radii aeff. The gas timescale appears to be only marginally dependent on the fractal dimension Df but is heavily governed by the gas-dust drift ∆s. As outlined in Sect. 5.3 this is because ∆s influence both the anisotropy as well as the average magnitude of the gas velocity field. The overall slope and magnitude of τgas is comparable to that presented in Weingartner & Draine (2003) for grain sizes aeff > 50 nm.
Another torque that may dampen the spin-up process of grains is by means of photon emission (see Purcell 1979; Draine & Lazarían 1999). Since the dust has typically temperatures in the order of Td ∊ [10 K; 1000 K], the dust emission is for the most part in the infrared (IR) regime of wavelengths. As outlined in Draine & Lazarían (1999) this IR damping torque may be written as
 (27)
(27)
Here, the constant c is the speed of light and the quantity
 (28)
(28)
represents the unitless efficiency of absorption Qabs(λ) weighted over the wavelength λ by the Planck function Bλ(Td). Similar to Qmech and Qgas the efficiency Qabs(λ) depends on the shape and material of the dust grain. The exact procedure to calculate Qabs(λ) is outlined in Appendix C in greater detail. Consequently, the characteristic timescale associated with the IR drag yields
 (29)
(29)
In Fig. 7 we present τIR for grains with different sizes aeff, fractal dimensions Df, and dust temperatures Td. Similar to the gas drag Df is the least relevant parameter of τIR compared to aeff and Td, respectively. We note that for more roundish grains i.e. Df ≥ 2.0 the correlation between τIR and follows a strict power-law while grains with Df < 2.0 seem to have a steeper slope for aeff > 200 nm.
Finally, the total drag torque acting against the mechanical spin-up process may be written as
 (30)
(30)
where
 (31)
(31)
is the total drag time. Consequently, the net grain drag is dominated by the smaller of the two timescales τgas or τIR, respectively.
In Fig. 8 we show the interplay of the gas drag and IR drag, respectively, for different gas number densities ng and dust temperatures Td. For typical CNM conditions but Td = 10 K the drag is dominated by the impinging gas. For Td = 100 K and ng ⪅ 109 m3 the total drag time is constant because of the smaller IR drag. The gas drag starts to dominate the total drag completely for gas densities ng ⪆ 1011 m3, decreasing the drag time by several orders of magnitude. Consequently, the mechanical spin-up process is expected to decrease or stagnate in that density regime. Assuming hot dust with Td = 1000 K the total drag becomes nearly independent of ng because of the effective loss of angular momentum by means of photon emission.
Additional drag mechanisms such as the collision of ions and charged dust grains or by means of a so-called plasma drag may only become of relevance for grains with a typical size of aeff < 10 nm (see Draine & Lazarían 1999). Therefore, such additional drag effects are not considered in this paper.
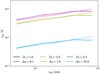 |
Fig. 6 Characteristic gas drag timescale τgas of rotating grains over the effective radius aeff. The lines represent the average values over the ensemble of dust grains with a distinct fractal dimension Df and gas-dust drift ∆s assuming typical CNM conditions. |
7 Magnetic field induced torques
For a dust grain that performs a precession with â1 around the an external magnetic field B under an alignment angle of ξ, the field orientation in the target-frame would perpetually change. An illustration of the relation between the lab-frame and the target-frame is shown in Fig. 9. In such a case the spins of free electrons within the paramagnetic material cannot follow this change in field orientation instantaneously. This leads to a transfer of the angular velocity component ω⊥ perpendicular to the magnetic field into dust temperature as outlined in Davis & Greenstein (1951). Hence, this Davis-Greenstein (DG) dissipation process aligns the dust grain with the magnetic field orientation. The characteristic timescale associated with the paramagnetic dissipation of rotational energy is
 (32)
(32)
where μ0 is the vacuum permeability, K =χ″/ω⊥, and χ″ is the imaginary part of the magnetic susceptibility (see Davis & Greenstein 1951; Jones & Spitzer 1967, for details). Following Draine (1996) the quantity K can considered to be a constant for grains rotating with an angular velocity of ω ⪅ 109 s. For silicate grains we take K ≈ 2.3 · 10−11 K s/Td based on the estimates1 presented in Jones & Spitzer (1967) as well as in Draine (1996).
The DG torque (see e.g. Davis & Greenstein 1951; Draine 1996) acting on the grain is then defined as
 (33)
(33)
Consequently, the torque ΓDG tends to minimize the alignment angle i.e. ξ → 0° by means of paramagnetic energy dissipation over the timescale of τDG.
In Fig. 10 we present a plot of τDG over grain size aeff for different fractal dimensions Df and magnetic field strengths В assuming CNM conditions. Using the parametrization presented in Draine & Weingartner (1997) we estimate the timescale τDG for roundish grains i.e. Df ≥ 2.4, a size of aeff = 100 nm and a field strength of В = 5 × 10⁹ T to be in the order of ≈ 1013 s. This is consistent with our values as shown in Fig. 10. However, we note that more elongated grains have a paramagnetic dissipation of at least one order of magnitude larger than that of roundish grains. Similar to the IR drag time τIR, the dissipation timescales for different Df diverge even more for larger grains sizes.
Another torque associated with the magnetic field is by means of the Barnett Effect (Barnett 1917; Dolginov & Mytrophanov 1976; Purcell 1979). However, the induced Barnett torque is only responsible for the dust precession. Since we apply quantities averaged over grain precision in the following sections, we do not deal with the Barnett torque within the scope of this paper.
8 Grain alignment dynamics
In this section we outline the equation of motion related to the mechanical spin-up process and the resulting torques. Here, we distinguish between two different cases. In the first case we describe the alignment of dust grains in the mere presence of a gas-dust drift. In a second case, we investigate the grain dynamics by assuming an additional external magnetic field.
8.1 Drift velocity alignment
The grain alignment with respect to the orientation of velocity field follows a set of equations similar to that outlined in Lazarían & Hoang (2007a). We emphasize that in Lazarían & Hoang (2007a) they use a torque arising from a directed radiation field in order to account for the spin-up of the grains whereas we use the MET Гmech as outlined in the sections above.
Given the plethora of internal relaxation processes such as Barnett relaxation (Purcell 1979; Lazarían & Roberge 1997), nuclear relaxation (Lazarían & Draine 1999b) or inelastic relaxation (Purcell 1979; Lazarían & Efroimsky 1999) any sufficiently rapidly rotating grain would inevitably align the principal â1 to be (anti)parallel with J. In fact, a stable grain alignment may only be possible under the condition of suprathermal rotation i.e. 3Jth ≤ |J| as it is claimed in Hoang & Lazarían (2008). Here,  is the thermal angular momentum a grain acquires by means of random gas bombardment. Grains with a lower angular momentum than 3Jth would easily be kicked out of alignment by means of gas collision or thermal fluctuations within the grain itself (see e.g. Lazarían & Draine 1999a,b; Weingartner & Draine 2003). Since we statistically evaluate only results for grains with a suprathermal rotation, effects associated with slowly rotating grains are neglected within the scope of this paper.
Consequently, the mechanical alignment of dust grains is governed by
 (34)
(34)
Note that this system is invariant under a rotation around the normal vector ê1 i.e. independent of the precession angle Φ (see e.g. Lazarían & Hoang 2007a and also Fig. 2). We project the MET efficiency Qmech along the direction of the unit vectors â1 = J/|J| and Θ in order to derive the alignment component
 (35)
(35)
and the spin-up component
 (36)
(36)
of the MAD. By introducing the dimensionless units  and
and  the time evolution of the angular momentum and the alignment angle may be written as
 (37)
(37)
and
 (38)
(38)
whereas
 (39)
(39)
simply combines the basic physical parameters into one quantity.
A prerequisite for stable grain alignment is the presence of static points i.e.  and
and  , respectively. We evaluate the static points as outlined in Appendix D in order to determine possible attractor and repeller points of the mechanical grain alignment dynamics.
Dependent on the dust and gas parameters a distinct grain may have several attractor points in the phase space. Consequently, one grain might contribute multiple times in the ensemble statistic of stable alignment points. In order to deal with this problem we randomly sample a number of points Nsamp within the phase space. We trace the trajectories of each sample point on a timescale of ∆t ≪ ∆tdrag and count the number of sample points Ni that approach the i-th attractor point within a limit of 1% of the full range of the phase space. Subsequently, we assign a weight of wi = Ni/Nsamp to each distinct attractor point in our followup analysis.
In Fig. 11 we present the J/Θ phase space of an exemplary dust grains three distinct values of ∆s. We note that the panels in Fig. 11 correspond to the ones shown in Fig. 5. As shown in Fig. 5 for ∆s < 0.1 the grain dynamics is dominated by random gas bombardment. Hence, the grain alignment dynamics is chaotic with multiple attractor points as depicted in the top panel of Fig. 11. All attractor points possess a probability of roughly 15–25% for the grain to settle down. However, all of the attractor points have an angular momentum of 3Jth > |J| and cannot be considered to be stable on longer timescales. As the gas-dust drift reaches a value of ∆s = 1.0 only the one attractor point at Θ = 32° remains with J ≈ −380Jth. In this configuration the dust grain possesses a stable alignment configuration. At a gas-dust drift of ∆s = 10.0 the attractor point is slightly shifted from an alignment angle of Θ = 32° toward Θ = 45° with an angular velocity of J ≈ −1.7 × 10⁴ Jth. Simultaneously, a second attractor point starts to appear at Θ = 150° and J ≈ 2.4 × 10⁴Jth. An alignment with an angle of Θ = 45° remains to be the most likely with a probability of 73.3%. For typical CNM conditions and ∆s ≥ 5.0 most dust grains have one to three stable alignment configurations with 3Jth < |J|. Note that the phase portraits of Fig. 11 are only exemplary and not representative for the entire grain ensemble with aeff = 400 nm and Df = 2.0.
For the entire ensemble of considered grains we find that only a small fraction in the order of a few per mille have no attractor points at all. Hence, it appears to be possible for almost all considered grain shapes to be mechanically aligned as soon as the condition 3Jth < |J| is given.
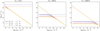 |
Fig. 8 Comparison of the characteristic timescales of the IR drag τIR, the gas drag τgas, and the total drag τdrag, respectively, dependent on gas number densitie ngas and fractal dimension Df. The lines represent the average values over the entire ensemble of grains with an effective radius of aeff = 400 nm. For the gas we assume typical CNM conditions. |
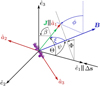 |
Fig. 9 Same as Fig. 2, but with an external magnetic field B. The precession of the grain is now with respect to the orientation of В with a precession angel of ϕ. Note that the angle ψ between the gas-dust drift Δs and В as well as the magnitude of В are free parameters in this model. In this configuration the resulting angle of alignment ξ is between В and â1 whereas the angles Θ and Φ may be expressed now as functions of ξ and ψ. |
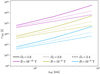 |
Fig. 10 Same as Fig. 6, but for the DG alignment timescale τdg for different strengths В of the magnetic field and typical CNM conditions. |
8.2 Magnetic field alignment
In the presence of an external magnetic field B the grain may perform a precession around the direction of B instead of the gasdust drift ∆s2. Hence, the time evolution of the grain alignment dynamics may be evaluated as
 (40)
(40)
Here, the precession angle is ϕ and the alignment angle ξ is now defined to be between B and the principal axis â1 (see Fig. 9). This approach to describe the magnetic field alignment in terms of the vectors â1,  , and
, and  , respectively, is similar to the one presented in Draine & Weingartner (1996; see also e.g. Lazarían & Hoang 2007a; Das & Weingartner 2016).
Note that the MET efficiency Qmech derived by our MC simulations is defined by the alignment angle Θ. The transformation of Qmech into the coordinate system of Eq. (40) reads
 (41)
(41)
(see e.g. Draine & Weingartner 1996, 1997, for furter details), while the precession angle is
 (42)
(42)
By assuming an external magnetic field the alignment component F and the spin-up component H of the MET efficiency may now be written as
![Mathematical equation: $\matrix{ {F\left( {\xi ,\psi ,\phi } \right)} \hfill & = \hfill & {{{\hat e}_1}{Q_{{\rm{mech}}}}\left( { - \sin \,\psi \cos \,\xi \cos \,\phi - \cos \,\psi \sin \,\xi } \right)} \hfill \cr {} \hfill & {} \hfill & { + \,\,{{\hat e}_2}{Q_{{\rm{mech}}}}\left[ {\cos {\rm{\Phi }}\left( {\cos \,\psi \cos \,\xi \cos \,\phi - \sin \,\psi \sin \,\xi } \right)} \right.} \hfill \cr {} \hfill & {} \hfill & {\left. { + \,\,\sin {\rm{\Phi }}\,{\rm{cos}}\,\xi \sin \,\phi } \right] + {{\hat e}_3}{Q_{{\rm{mech}}}}\left[ {\cos \,{\rm{\Phi }}\,{\rm{cos}}\,\xi \sin \,\phi } \right.} \hfill \cr {} \hfill & {} \hfill & { + \left. {\,\sin \,{\rm{\Phi }}\left( {\sin \,\psi \sin \,\xi - \cos \,\psi \cos \,\xi \cos \,\phi } \right)} \right]} \hfill \cr } $](/articles/aa/full_html/2023/06/aa42528-21/aa42528-21-eq66.png) (43)
(43)
and
 (44)
(44)
(see e.g. Weingartner & Draine 2003; Lazarían & Hoang 2007a). The grain precession is expected to be much faster than the grain alignment timescale (Draine & Weingartner 1997). This allows for the alignment component and the spin-up component to be averaged over the precession angle ϕ via
 (45)
(45)
and
 (46)
(46)
respectively. Finally, splitting the equation of grain dynamics into its individual variables gives
 (47)
(47)
and
 (48)
(48)
where
 (49)
(49)
is a measure of the impact of the applied gas parameters as well as the magnetization of the grain.
Note that the characteristic DG alignment time τDG goes with the field strength B−2 (see Eq. (32) and also Fig. 10). Furthermore, silicate grains are believed to harbor small clusters of pure iron (see e.g. Jones et al. 2013, and references therein) increasing the susceptibility χ of the dust material and subsequently the quantity K may be larger as assumed in Sect. 7. Since both magnetic field strength B and the quantity K are free parameters in our alignment models the quantity δm may vary by several orders of magnitude. Hence, we introduce the amplification factor fmag in Eq. (49) to explore the impact of the two parameters of grain magnetization, i.e. possible variations in the magnetic field strength B and the susceptibility χ of the grain material, respectively.
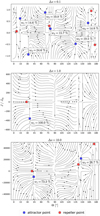 |
Fig. 11 Phase portrait for the correlation between the angular momentum J/Jth and the alignment angle Θ. The plotted grain dynamic is calculated with the parameters of the gas and the considered MET efficiency Qmech being identical to those presented in Fig. 5. Note that negative values of J represent the case when the vectors of the grain’s principal axis â1 and J are antiparallel and vice versa. The weights wi describe the probability to reach a certain attractor point from any arbitrary starting point within the phase portrait. |
9 Dust destruction and polarization
9.1 Rotational disruption of dust grains
Rapidly rotating grains may be disrupted by means of centrifugal forces. Rotational disruption in the context of RATs was recently studied in Hoang et al. (2019). A similar process may occur in the presence of a strong MET. Following Hoang et al. (2019) a dust grain might become rotationally disrupted when the grain exceeds the critical angular momentum of
 (50)
(50)
Here, the quantity Smax is the tensile strength related to the dust material. We emphasize that for fractal aggregates the magnitude of Smax is still a matter of debate. An analytical expression for a solid body is discussed in Hoang (2020). However, numerical simulations suggest that the tensile strength Smax of fractal grains may vary by several orders of magnitude depending on monomer size and initial grain shape (Seizinger et al. 2013; Tatsuuma et al. 2019). We estimate the tensile strength by
 (51)
(51)
as outlined in Greenberg et al. (1995) where 〈Ncon〉 is the average number of connections between all monomers within the dust aggregate and the quantity h is associated with the overlap at each connection point. Here, we assume the overlap to be h ≈ 10−3 amean and apply a binding energy of Eb = 1.22 × 10⁻²¹ J (Greenberg et al. 1995).
The porosity 𝒫 ϵ [0; 1] of a grain quantifies the amount of empty space within the grain aggregate where 𝒫 = 0 would represent a solid body. However, 𝒫 is not well defined in literature. For instance in Ossenkopf (1993) the porosity is calculated based on the geometric cross section of the dust grain whereas a method based on comparing the moments of inertia is utilized in Shen et al. (2008). Hence, the values of 𝒫 provided in the literature may differ within a few percent. For the fractal grains presented in this paper we apply the expression
 (52)
(52)
as suggested by Kozasa et al. (1992), where the critical radius  and Rgyr is the radius of gyration. Since Rgyr is connected to the total number of monomers Nmon and the fractal dimension Df (see Eq. (1)) this seems to be the natural way to define the porosity of the fractal aggregates utilized in this paper. We emphasise that all aggregates applied in this study are shifted to have the center of mass coinciding with the origin of the coordinate system (see Sect. 2). Consequently, the radius of gyration may be written as
 (53)
(53)
In Fig. 12 we present the resulting tensile strength Smax over fractal dimension Df. We note that smax converges as the fractal dimension Df → 3. However, for more elongated grains we report that smax differs by three orders of magnitude for different grain sizes where the largest grains have the smallest smax.
For the average number of connections 〈Ncon〉 we find typically values of about 2–4 independent of Df but a porosity 𝒫 ≫ 0.9 for D ≤ 1.8 and aeff ≥ 400 nm. Furthermore, for interstellar dust a porosity ≫ ≈ 0.2 is usually applied (Guillet et al. 2018). Considering the low tensile strength and subsequent threshold Jdisr together with the high porosity it is highly unlikely to find such elongated grains in greater numbers in the CNM.
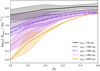 |
Fig. 12 Estimated tensile strength Smax over fractal dimension Df for all the considered grain sizes aeff. |
9.2 Dust polarization measure
The maximally possible polarization of a grain is determined by its differential cross section parallel and perpendicular to its axis of rotation. However, several factors may reduce the maximal polarization. One factor an imperfect alignment i.e. an alignment angle of Θ > 0° for drift alignment or an angle ξ > 0°, respectively, in case of magnetic field alignment. A way to quantify imperfect alignment and subsequently the reduction is polarization is by means of the Rayleigh reduction factor (RRF)
 (54)
(54)
(Greenberg 1968), where 〈cos2 Θ〉 is the ensemble average over all alignment angles Θ of the individual grains. For instance R = 1 stands for perfect alignment, i.e. Θ = 0°, and R = 0 may represent a completely randomized ensemble of dust grains3.
Note that we use a slightly modified RRF by introducing the quantity ζ = Natt/Ntot where Natt is the number of grains possessing at least one attractor point with an angular momentum J in between 3Jth < |J| < Jdisr and Ntot is the total number considered grains per set of input parameters. For instance ζ = 0 for an ensemble of completely randomized grains (3Jth < |J|) but also for the case when the entire grain ensemble becomes rotationally disrupted (|J| > Jdisr).
Finally, we evaluate the ensemble average by
 (55)
(55)
in order to get the RRF of mechanical alignment. Note that we only add up attractor points within the range 3Jth < |J| < Jdisr. Furthermore, attractor points at an alignment angle of Θ = 0° or Θ = 180°, respectively would contribute equally to the net dust polarization. Hence, we map all attractor points with Θ > 90° in the following sections to Θ → 180° - Θ in order to get more data points for the statistics of dust polarization. We follow exactly the same procedure to calculate the RRF for the alignment angle ξ in case of the magnetic field alignment.
10 The alignment behavior of grain ensembles
10.1 The mechanical spin-up process
In Fig. 13 we present the angular momentum |J| for typical CNM conditions. In this plot, the quantities of gas number density ng, gas temperature Tg, dust temperature Td, and the gas-dust drift ∆s are varied independently.
Increasing ng allows for the angular momentum |J| to grow continuously because of the higher collision rate aa42528-21Rco11. Hence, the MET Γmech increases while the drag timescale τdrag decreases simultaneously. Since the CNM dust temperature is assumed to be Td = 15 K, the total drag is identical with the gas drag (compare Fig. 8). Consequently, the mechanical spin-up process and the total drag reach a balance and the dust grains reach subsequently their terminal angular momentum.
Phenomenologically, all fractal dimensions Df show a similar spin-up behavior. Naturally, elongated grains with Df = 1.6 are more efficient ’propellers’ than more spherical grains compared e.g. to those with Df = 2.4. The difference between the particular fractal dimensions is about one order of magnitude. Hence, grains with Df = 1 .6 can already be considered to reach a stable mechanical alignment (3Jth < |J|) for ng ≈ 104 m3 while grains with Df = 2.4 require on average a gas number density of nf ≈ 107 m3. All grain sizes reach their terminal angular velocity bellow the threshold of rotational disruption (|J| < Jdisr). Hence, all grains can fully contribute to polarization for gas number densities of ng > 107 m3.
For CNM conditions and an increasing gas temperature Tg the angular momentum |J| is increasing for the entire considered range of Tg ∈ [1 K, 106 K]. This is because the gas drag becomes only relevant for Tg > 106 K. We emphasize that Tg appears to be constant in Fig. 13 because the thermal angular velocity Jth depends on the gas temperature Tg as well. For the same reason Jdist decreases with an increasing Tg. Grains with a fractal dimension of Df = 2.4 are in the alignment regime while more elongated grains are rationally disrupted for Tg > 105 K.
As shown in Fig. 13 for an increase in dust temperature Td the angular momentum |J| remains constant for lower dust temperatures Td < 30 K and starts then to decline. Since, |J| < Jdisr grains cannot be rationally disrupted by an increase in Td for the applied set of parameters. This is a result of the infrared drag acting on the dust grain damping the mechanical spin-up process most efficiently for higher dust temperatures. Hence, a stable mechanical alignment with 3Jth < |J| < Jdisr can only be reported within Td ∈ [1 K, 30 K] for a fractal dimension of Df = 2.4 and Td ∈ [1 K, 100 K] for Df = 1.6.
The angular momentum |J| increases with an increasing gasdust drift ∆s. Here, the mechanical spin-up process of grains with a fractal dimension of Df = 1.6 is the most efficient where the condition 3Jth < |J| is already given for ∆s ≈ 10−3. In turn grains with Df = 2.4 require a slightly higher drift of ∆s ≈ 10−2. Grains with Df = 1.6 become already destroyed at ∆s = 1.0 while grains with Df = 2.4 can still contribute to polarization for a drift up to ∆s = 30.0.
We emphasize that the mechanical spin-up processes presented in Fig. 13 may be influenced by additional effects of grain destruction. For instance, by sputtering when an impinging gas particle has a sufficiently large energy to separate individual monomers from the aggregate may provide an relevant process to destroy dust grains (see e.g. Shull 1978; Draine & Salpeter 1979; Dwek & Arendt 1992). Consequently, our results may be modified in the higher end of the regimes of gas number density Πg, gas temperature Tg, and the gas-dust drift ∆s, respectively. Especially, in the range of gas parameters where ∆s > 10 or Tg > 105 K, grains may be efficiently destroyed by sputtering. Such grains would not contribute to the net dust polarization either. However, considering the effects related to sputtering goes beyond the scope of this paper.
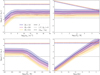 |
Fig. 13 Average angular momentum |J/Jth| (solid lines) over gas number density ng (top left), gas temperature Tg (top right), dust temperature Td (bottom left), and gas-dust drift ∆s (bottom right), respectively, and typical CNM conditions. All results are for the ensemble of dust grains with a size of aeff = 400 nm and a fractal dimension Df = 1.6 (purple), Df = 2.0 (pink), and Df = 2.4 (yellow), respectively. The solid lines represent the ensemble average of the angular momenta while the shaded areas indicate the range of one standard deviation of all data points are situated. Dotted lines are the threshold of J/Jth = 3 where a stable alignment is assumed while dashed lines is the average of the corresponding critical angular momentum J = 〈 Jdisr〉 where dust grains are estimated to become rotationally disrupted. We note that we plot only the average threshold 〈 Jdisr〉 of rotational disruption for clarity while the range of Jdisr is about one order of magnitude. |
10.2 Distribution of the mechanical alignment directions
In Fig. 14 we present exemplary distributions of the alignment angle θ for grains with different fractal dimensions Df and typical CNM conditions but a lower gas number density of ng = 106 m−3 (compare Fig. 13). Alignment angles of Θ = 0° and Θ = 90°, respectively, are the most likely configurations whereas Θ ≈ 45° is generally a less favorable alignment. In Fig. 14 we also compare weighted as well as unweighted attractor points (see Sect. 9.2). We report that the weighting broadens slightly the peaks at Θ = 0° and Θ = 90°, respectively. This result holds for all gas and dust parameters considered in this paper. We note that for the particular set of input parameters applied in Fig. 14 the preferential alignment direction is Θ = 0° meaning the rotation axis â1 of the grains is (anti)parallel to ∆s. The exception are grains with Df ≥ 2.4 where an alignment with Θ = 90° i.e. â1 is perpendicular to ∆s is the least likely configuration. However, this result cannot be generalized. For instance for a gas number densities ng > 1010 m−3 the peak at Θ = 90° would vanish as well for grains with Df ≤ 2.0.
As shown in Fig. 14 for a gas number density of ng = 106 m−3 the ensemble of grains with a fractal dimension of Df = 1.6 has the most aligned grains within the range 3Jth <|J| < Jdisr. Here, the exact ratio of grains that possess at least one attractor is ζ = 95.1 %. In turn, the grains with Df = 2.0 and Df = 2.4 have a ratio of ζ = 80.2 % and ζ = 36.8 %, respectively, because a fraction of all these grains are already below the limit of |J| < 3Jth (see also Fig. 13).
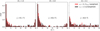 |
Fig. 14 Histograms of the distribution of the alignment angle Θ of all attractor points with an angular momentum J within the range of 3Jth < |J| < Jdisr. The parameter ζ is the ratio of grains with at least one attractor within that range to the total number of considered dust grains. The histograms are for grains with a size of aeff = 400 nm and a fractal dimension of Df = 1.6 (left), Df = 2.0 (middle), and Df = 2.4 (right), respectively. Red bars are weighted attractor points while gray bars are the unweighted ones. We assume CNM conditions but 5 with a gas number density of ng = 106 m−3. |
10.3 Mechanically induced dust polarization
As presented in the sections above various parameter sets allow for a mechanically induced grain rotation with an angular momentum J within the range 3Jth < |J| < Jdisr. The most likely alignment directions are at Θ = 0° and Θ = 90°, respectively. Consequently, mechanical alignment may result in a high degree of dust polarization.
In Fig. 15 we present the resulting RRF to quantifying the dust polarization of grain ensembles and for different fractal dimensions Df. We emphasize that the panels in Fig. 15 show exactly the same range of input parameters as the panels in Fig. 13. Increasing the gas number density ng in a CNM environment leads to an almost perfect alignment of grains i.e. a RRF R close to unity. For grains with a fractal dimension of Df = 1.6 at ng > 104 m3 the alignment is with a R aa42528-21≥ 0.97 while grains with a Df = 2.4 become alignment with a R ≈ 0.95 for ng > 107 m3. Since all grains reach their terminal angular momentum before they become rotationally disrupted the high net polarization efficiency retains for higher densities.
We report that the RRF barely depends on gas temperature Tg for typical CNM conditions. Hence, almost all of the grains remain within 3Jth < |J| < Jdisr and subsequently the RRF is close to unity independent of Tg and Df. Because of the IR emission of photons the grain rotation is heavily governed by the dust temperature for Td < 30 K. For Td = 30 K the ensemble of grains with Df = 2.4 is already completely randomized while elongated grains with Df = 1.6 do no longer contribute to polarization up to a dust temperature of about Td = 300 K.
Concerning the gas-dust drift ∆s grains with a fractal dimension of Df = 1.6 are most efficiently spun-up. Hence, an ensemble of such Df = 1.6 grains start to have a net polarization for ∆s = 10−3 while more roundish shaped grains with Df = 2.4 require a ∆s = 10−2. With an increasing ∆s all grains shapes may eventually become effectively aligned. Considering rotational disruption grains with a fractal dimension of Df = 1.6 reach their peak polarization at ∆s = 0.1 while grains with Df = 2.4 require a much higher drift of about ∆s = 10.0 to become rotationally disrupted. At a gas-dust drift of ∆s = 30 elongated grains are almost completely destroyed while the ensembles with Df ≤ 2.4 would still contribute to the net polarization. In contrast to the other input parameters for the increasing gas-dust drift it most important to take rotational disruption into account.
In compression to the classical Gold alignment mechanism (Gold 1952a,b) a super-sonic drift (∆s > 1) is not required to account for dust polarization. A grain alignment for a subsonic-drift is consistent with the analytical model presented in Lazarían & Hoang (2007b) as well as the numerical results of Das & Weingartner (2016) and Hoang et al. (2018), respectively. However, the latter studies consider only a limited number of individual grains and lack the information about the distribution of the alignment angle Θ required to evaluate any net polarization of an ensemble of dust grains.
10.4 Grain size dependency
So far, we have focused on grains with an effective radius of aeff = 400 nm. In Fig. 16 we present the distribution of alignment angles Θ for grains with a fractal dimension of Df = 2.0 but different effective radii aeff. Similar to the distribution shown in Fig. 14 the predominate direction of mechanical grain alignment is Θ = 0° followed by Θ = 90° whereas an alignment with Θ ≈ 45° is the least likely. Here, we note a clear trend concerning the ratio ζ of dust grains that have a stable alignment within 3Jth < |J| < Jdisr where larger dust grains are more efficiently spun up. Only a fraction of ζ = 60.8 % of gains with an effective radius of aeff = 50 nm are effectively mechanically aligned while larger grains with aeff = 200 nm and aeff = 800 nm have a higher ratio of ζ = 84.9 % and ζ = 92.6 %, respectively. We attribute this finding to the fact that larger grains are more efficiently spun-up because of the increased surface area of the larger irregular grains. In Fig. 17 we present the angular momentum |J| dependent on the effective grain radius aeff in comparison with the corresponding RRF R dependent on fractal dimensions as well as gas-dust drift. As noted above larger dust grains are more efficiently spun-up by mechanical alignment. The trend is in general in agreement with the grain size dependency of the angular momentum |J| presented in Hoang et al. (2018). However, they predict a power-law relation between |J| and aeff.We emphasize that our dust grains do not follow strictly a power-law since larger grains are disproportionately spun-up. We attribute this mismatch to the fact that Hoang et al. (2018) simply scaled their distinct cubical shapes to get grains of different aeff whereas we mimic grain growth by precalculating grains for different fractal dimensions for each grains size bin individually.
In detail, for a gas-dust drift of Δs = 0.01 only grains with aeff > 400 nm and a fractal dimension of Df = 1.6 and Df = 2.0, respectively, surpass the limit 3Jth < |J| while more roundish grains with Df = 2.0 require a radius of aeff = 800 nm to align. Consequently, smaller grains cannot contribute the polarization while only the largest elongated grains reach a RRF close to unity.
For ∆s = 0.1 larger grains with aeff ≥ 200 nm and a fractal dimension of Df ≤ 2.0, most grains are within the range of 3Jth < |J| < Jdisr. Hence, the corresponding RRF is R > 0.85 for such grains. The magnitude of the angular momenta of grains with a fractal dimension of Df = 2.4 are only slightly above the 3Jth limit. Hence, such grains can only reach an RRF in the range R ∈ [0.5,0.85].
For the a thermal drift of ∆s = 1 .0 all the more roundish grains with a fractal dimension of Df = 2.0 and Df = 2.4, respectively, are almost completely within the range 3Jth < |J| < Jdisr of stable alignment. Here, the RRF is close to unity independent grain size. The exception are the smallest grains with Df = 2.0 and most of the elongated grains with Df = 1.6 where the grain ensemble becomes partly rotationally disrupted. For the latter ensemble the characteristic interplay of the spin-up process and the rotational disruption limit leads to a dip in the RRF of R = 0.4 for aeff = 200 nm whereas grains at the opposite side of the size distribution reach a RRF close to R = 0.8.
In contrast to that for elongated grains we see the opposite trend where the range of one standard deviation seems to become larger with an increasing grain size. Here, grains with aeff = 50 nm are roundish even for a fractal dimension Df = 1.6 because of the low number of monomers whereas grains with aeff = 800 nm are almost a rod with much larger angular momenta. Hence, small variations of the grain shape such as a forking structures especially in the outskirts of the grain may lead to vastly different alignment behavior.
The RRF plotted in Fig. 17 reveals that grains with a fractal dimension of Df > 2.4 cannot contribute to the polarization for a typical CNM environment. In contrast to that a grain ensemble with Df = 1.6 starts to polarize light for sizes of aeff ≥ 100 nm.
This plot demonstrates once more that the parameter of grains size aeff alone is not sufficient to quantify the mechanical alignment of dust grains since the net-polarization is highly dependent on the grain shape as well.
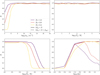 |
Fig. 15 RRF R corresponding to the conditions presented in Fig. 13. Solid lines represent the ensemble of grains fulfilling the alignment condition 3Jth < \J\ while for dashed lines rotational disruption is also taken into account i.e. all grains rotating with |J| > Jdisr cannot contribute to polarization. |
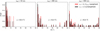 |
Fig. 16 Same as Fig. 14 but for grains with a fractal dimension of Df = 2.0 and CNM conditions for the different grain sizes of aeff = 50 nm (left), aeff = 200 nm (middle), and aeff = 800 nm (right), respectively. |
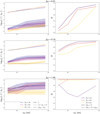 |
Fig. 17 Left panel: same as Fig. 13 but over all considered grain sizes aeff. Right panel: RRF R corresponding to the conditions presented on the left panel. |
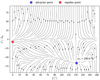 |
Fig. 18 Same as Fig. 11 but for magnetic alignment with a gas-dust drift of Δs = 0.1, an amplification factor of fmag = 1 and an angle Ψ = 15°. |
10.5 The spin-up process of (super)paramagnetic grains
Grain alignment dependent on the magnetization of paradigmatic grains is extensively studied in Hoang et al. (2014) and Hoang & Lazarían (2016), respectively, in the context of RATs. In our study we only consider silicate grains and model the magnetic field strengths as well as the impact of possible iron inclusions within the dust grains itself by the amplification factor fmag introduced in Sect. 8.2. We also emphasize that we do not scrutinize the exact conditions required for the alignment direction to switch from the mechanical alignment to magnetic field alignment within the scope of this paper.
In Fig. 18 we show a J/ξ phase portrait exemplary for the magnetic field alignment with an amplification factor of fmag = 1 and an angle Ψ = 15° between Δs and B. The phase portrait is to be compared with that presented in Fig. 11. For this particular grain we report an alignment with an angle ξ = 135° assuming typical CNM conditions, but with a gas-dust drift of Δs = 0.1.
This result is typical for magnetic alignment in so far as most grains have exactly one attractor in contrast to the “purely MAD” where most grains may have multiple at tractors even for a supra-sonic drift i.e. Δs > 1.0. The magnitude of |J| for this attractor is comparable to the results presented in Das & Weingartner (2016).
In Fig. 19 we present the angular momentum |J| over gas-dust drift Δs for grains aligned with the magnetic field direction assuming typical CNM conditions, and an angle of ψ = 15°. The processes involved are outlined in Sect. 8.2 in detail. In contrast to a purely MAD (see Fig. 13) the alignment in the magnetic field direction of the most elongated grains require the gas-dust drift Δs to be about one order of magnitude higher in order to surpass the limit 3Jth < |J|. The spin-up process for different fractal dimensions is nearly identical for a sub-sonic drift. Concerning the rotational disruption of magnetically aligned grains only a small fraction of all grains may be destroyed for the drift of Δs > 1.0.
The dependency of magnetic field alignment of grains on the angle ξ is depicted in Fig. 20. The resulting angular momentum J remains roughly constant for ψ < 80°. Note that the entire ensembles of grains cannot rotationally be disrupted for this particular set of parameters. For an angle ψ ≈ 90° the spin-up process appears to be most inefficient. Provided that MAD is the only driver for the magnetic alignment of grains in astro-physical environments, a high degree of dust polarization cannot be expected in regions where the predominant directions of the magnetic field В and gas-dust drift Δs are perpendicular. This trend is very similar to grain alignment by RATs as presented e.g. in Lazarían & Hoang (2019). However, we note that the magnitude of the angular momentum |J| depends marginally on fmag and is also not correlated with the fractal dimension Df since he angular momentum |J| is higher for grains with Df = 2.0 than for grains with Df = 2.4. The exact conditions of this reversal need to be dealt with in an upcoming study.
In Hoang & Lazarían (2007), it is noted that the grain alignment considering RATs correlates with the parameter qmax = max(ê1𝒬RAT)/max(ê2𝒬RAT) where êi𝒬rat is the RAT efficiency in the i-th direction of the lab-frame. According to the AMO of RAT alignment within the range of qmax ∈ [1,2] attractor points with supra-thermal rotation become most likely. More recent studies report (Hoang & Lazarían 2016; Herranen et al. 2021) about islands in the parameter space of {qmax, ψ, δm} where grain alignment is possible i.e. Jth ≪ |J|. However, as noted in Das & Weingartner (2016), the analogous parameter qmax = max(ê1𝒬mech)/max(ê2𝒬mech) of mechanical alignment seems to be inconclusive in predicting the MAD. This is consistent with our modeling. We cannot report any trend between the gas and dust input parameters, the resulting quantity qmax, and the subsequent grain alignment behavior.
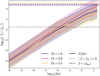 |
Fig. 19 Same as the angular momentum |J/Jth| over gas-dust drift Δs presented in Fig. 13 but for all grains aligning in direction of an external magnetic field instead of the direction of the gas-dist drift Δs. In this plot an amplification factor of fmag = 1 is applied. We emphasize that all of the angles ξ and ψ = 15°, respectively, are considered. |
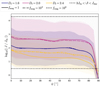 |
Fig. 20 Angular momentum |J|Jth| over the angle ψ for dust grains with a size of aeff = 400 nm and a fractal dimension of Df = 1.6 (blue), Df = 2.0 (purple), and Df = 2.4 (yellow), respectively, for typical CNM conditions but with a gas-dust drift Δs = 1.0. The results are calculated for a constant alignment angle of ξ = 15° and for an amplification factor of fmag = 1 (solid), fmag = 103 (dotted), and fmag = 106 (dash dotted), respectively, for clarity we plot only the average values of |J|Jth| The range of angular momenta is generally of the same order as in Fig. 19. |
10.6 The angular distribution of magnetic field alignment
In Fig. 21 we present exemplary cases for the correlation of the alignment angle ξ and the angle ψ between В and Δs. For typical CNM conditions and a Δs = 1.0 an alignment angle of ξ = 0° is the most likely for all ψ followed by an alignment at ξ = 90°. The only exception is close to an angle of ψ≈ 60° where the distinct shape of the spin-up component  leads to a most likely alignment at ξ = 30°. The histogram is the most pronounced for a Df = 1.6 while the distribution flattens toward higher fractal dimensions. For Df ≥ 2.4 the peak at ξ = 0° disappears almost completely. In contrast to a “purely MAD” the fraction ζ generally increases with an increasing Df. To our understanding this is due to the dependence of paramagnetic alignment timescale τdg on the moment of inertia
  . Note that grains with the same effective radius aeff have exactly the same volume independent of fractal dimension Df. Hence, the moment of inertia
  and subsequently τDG decreases toward larger values of Df and the magnetic alignment becomes more efficient.
In Fig. 22 we consider CNM conditions and a grain ensemble with Df = 2.0 while increasing the gas-dust drift Δs. For Δs = 0.1 the distribution of the alignment angle is mostly flat where alignment angles of ξ = 0° and ξ = 90°, respectively, being slightly more likely than other angles. For a gas-dust drift of Δs = 1.0 the peaks at ξ = 0° as well as ξ = 90° are more pronounced while an alignment within the range ξ ∈ [30°, 90° [ become less likely. As the gas-dust drift approaches Δs = 10.0 most of the grains align at ξ = 0° almost independent of ψ. The only exceptions are for ψ = 45° leading to a most likely alignment at ψ = 90° and for ψ = 60° with a ξ = 90°4. For the applied fractal dimension of Df = 2.0 the tendency of the ratio ζ of aligned dust grains shows that most of the grains are aligned for Δs = 0.1. This is because for a higher gas-dust drift the some grains become already rationally disrupted.
In Fig. 23 we investigate the impact of grain magnetization by varying the amplification factor fmag. For the default value of fmag = 1, an alignment with ξ = 0° has the highest probability followed by a very narrow peak at ξ = 90°. An amplification factor of fmag = 103 would lead to an alignment angle distribution comparable to that with fmag = 1. Applying the most extreme case of fmag = 106 virtually all aligned grains have an angular momentum J parallel (perpendicular) to B, i.e. ξ = 0° (ξ = 90°). Here, the grain alignment suddenly stops for angles Ψ > 45°. Note that the maximal possible angular momentum  , (see Eq. (48)) considering the grain alignment in the magnetic field direction. Hence, a higher amplification factor and subsequently a higher δm does not necessarily enhance the resulting ratio ξ. Rather, an increase of δm leads to a much lower possible values of Jmax at angles close to ξ = 45°. Consequently, the only remaining alignment configurations with 3Jth < Jmax are at ξ = 0° or ξ = 90°, respectively. For the set of parameters applied in Fig. 23 this may result in an increase in the net dust polarization. However, this trend cannot be generalized because for grain ensembles where attractor points at ξ = 45° are very rare in the first place an increase in fmag would have less of an impact. The alignment behavior presented in Fig. 19 as well as the variations of input parameters shown in the Figs. 21−23 agree in so far as the as the spin-up process for grains aligned along the magnetic field is most inefficient for as the angle between Δs and В approaches ψ ≈ 90°.
However, the RRF dependencies cannot easily be generalized. For instance, a slightly higher gas-dust drift Δs would push more grains with a fractal dimension of Df = 2.0 in the regime of rotational disruption and the RRF depicted in the left panel of Fig. 24 would behave a rather different curve. This emphasizes once again the importance to describe the grain alignment process and the subsequent dust polarization statistically over a large ensemble of grains instead of investigating the alignment behavior of individual grains.
11 Summary and outlook
This paper systematically explores the impact of the grain shape and gas-dust drift on the mechanical alignment of dust (MAD). Large ensembles of grain aggregates characterized by the fractal dimension Df and the effective radius aeff are constructed. A novel MC-based approach to model the physics of gas-dust interactions on a microscopic level is introduced. This allows for a statistical description of the grain spin-up process for an environment with an existing gas-dust drift. Finally, stable grain alignment configurations are identified in order to quantify the net polarization efficiency for each grain ensemble. Concerning the net polarization, we explore both cases separately, namely (i) the purely MAD case along the gas-dist drift velocity and (ii) the case of grain alignment with respect to the magnetic field lines. We summarize the principal results of this paper as follows:
We demonstrate that the mechanical spin-up process is most efficient for elongated grains with a fractal dimension of Df = 1 .6. Such grains require only a subsonic gas-dust drift of about ∆s = 10−3 to reach a stable grain alignment. In contrast, more roundish grains with Df ≥ 2.4 require a supersonic drift with ∆s = 10−2.
The tensile strength of large elongated grains (aeff > 400 nm, Df < 2.0) may be about 1–3 dex lower compared to the more roundish considered grain shapes (Df ≥ 2.0). Hence, such elongated grain shapes appear to be the most fragile and are rather unlikely to subsist on longer timescales in the ISM once they start to rotate.
Considering nonspherical dust, the characteristic timescales governing the alignment dynamics become closely connected to the grain shape, that is to say the fractal dimension Df. However, we find that the gas drag timescale τgas is most impacted by the gas-dust drift ∆s, whereas Df appears to be only of minor importance. Concerning the IR drag timescale, the variation of τIR is about two orders of magnitude at most for large grains with different fractal dimensions. This is also the case for the Davis-Greenstein alignment timescale τDG, where we report a variation of τDG up to two orders of magnitude between ensembles with different Df for the largest grain sizes.
Simulating the mechanical spin-up processes of fractal grains reveals that the acceleration rate of the spin-up process is roughly identical for different grain shapes. Concerning the magnitude of the ensemble average of the angular momentum J, a difference in the fractal dimension of Df = 0.4 would result in a difference in the magnitude J of about 0.5–1 dex.
For a purely MAD, we find a stable alignment with an angle of Θ = 0° to be the most likely, followed by an alignment close to Θ = 90°. Hence, most mechanically spun-up grains have a rotation axis â1 almost (anti)parallel to the direction of the gas-dust drift ∆s.
We report that a mechanically driven magnetic field alignment of fractal dust grains is indeed possible. The spin-up process for grains aligned with the magnetic field lines is found to be slightly less efficient as the purely MAD because a gas-dust drift of ∆s = 10−2 is required for a stable grain alignment independent of fractal dimension Df.
We find that the spin-up process for the magnetic alignment is rather inefficient for an angle ψ ≈ 90° between ∆s and the magnetic field B. This ψ dependency of the spin-up is comparable to that of RAT alignment.
The alignment of the purely MAD and the alignment case considering a magnetic field are rather comparable. The magnetic field B is most likely parallel to the rotation axis â1. Hence, a dust polarization efficiency with a R = 0.8–0.9 may be observed given a sufficiently high gas-dust drift ∆s.
We emphasize that all the trends discussed above are highly dependent on the applied physical properties of the gas and dust component. Our study remains agnostic concerning the exact conditions that may lead to a grain alignment in the direction of the gas-dust drift ∆s or an alignment with the orientation of the magnetic field B. Moreover, phenomena such as the H2 formation on the surface of the grains and charged dust that may heavily impact the MAD are not taken into consideration within the scope of this paper. Therefore, investigations of those phenomena will be dealt with in a forthcoming paper in tandem with quantifying the likelihood of the occurrence of drift velocity alignment versus magnetic field alignment.
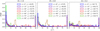 |
Fig. 21 Normalized histogram of the distribution of the alignment angle ξ for dust grains with a size of aeff = 400 nm and a fractal dimension of Df = 1.6 (left), Df = 2.0 (middles), and Df = 2.4 (right), respectively, for typical CNM conditions but with a gas-dust drift of Δs = 1.0. Here, the amplification factor is fmag = 1.0 for all panels. Color-coded is the angle ψ while ζ is the corresponding ratio of attractor points with an angular momentum J in between 3Jth < |J| < Jdisr to the total number of considered dust grains. We note that an alignment angle of ξ = 0° followed by ξ = 90°, respectively, are the preferential configurations for the magnetic field alignment (compare also Fig. 14). For clarity we only plot configurations with a ratio ζ > 2.0 % since distributions with a smaller ζ would only contribute a few but high peaks to the histogram. |
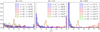 |
Fig. 22 Same as Fig. 21 but for grains with a fractal dimension of Df = 2.0 and a gas-dust drift of Δs = 0.1 (left), Δs = 1.0 (middle), and Δs = 10.0 (right), respectively. |
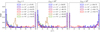 |
Fig. 23 Same as Fig. 22 but with a gas-dust drift of Δs = 1.0 and an amplification factor of fmag = 1 (left), fmag = 103 (middle), and fmag = 106 (right), respectively. |
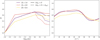 |
Fig. 24 Left panel: RRF R over the gas-dust drift ∆s for the conditions presented in Fig. 19 but for an angle ψ = 15°. Right panel: same as the left panel but for the RRF over the angle ψ but with a gas-dust drift of ∆s = 1.0 (compare Fig. 20). |
Acknowledgements
The authors thank the anonymous referee for the concise and constructive referee report. Special thanks go to Thiem Hoang, Alex Lazarían, Bruce Draine, Cornelis Dullemond and Sebastian Wolf for numerous enlightening discussions about MC algorithms and grain dynamics. We also thank Ugo Lebreuilly and Valentin Le Gouellec for providing helpful feedback. S.R., P.M., and R.S.K. acknowledge financial support from the Heidelberg cluster of excellence (EXC 2181 - 390900948) “STRUCTURES: A unifying approach to emergent phenomena in the physical world, mathematics, and complex data”, specifically via the exploratory project EP 4.4. S.R., P.M., and R.S.K. also thank for support from Deutsche Forschungsgemeinschaft (DFG) via the Collaborative Research Center (SFB 881, Project-ID 138713538) “The Milky Way System” (subprojects A01, A06, B01, B02, and B08). And we thank for funding form the European Research Council in the ERC synergy grant “ECOGAL -Understanding our Galactic ecosystem: From the disk of the Milky Way to the formation sites of stars and planets” (project ID 855130). The project made use of computing resources provided by The Land through bwHPC and by DFG through grant INST 35/1134-1 FUGG. Data are in part stored at SDS@hd supported by the Ministry of Science, Research and the Arts and by DFG through grant INST 35/1314-1 FUGG.
Appendix A The moments of inertia of a dust aggregate
The individual monomers of the presented aggregates are considered to be a perfect sphere. Hence, the k-th monomer with mass  has a strictly diagonal inertia tensor where the elements may be written as
 (A.1)
(A.1)
Applying the parallel axis theorem (Steiner’s theorem) the diagonal elements for the entire aggregate are
 (A.2)
(A.2)
 (A.3)
(A.3)
and
 (A.4)
(A.4)
respectively, whereas the off-diagonal terms in the inertia tensor are
 (A.5)
(A.5)
 (A.6)
(A.6)
and
 (A.7)
(A.7)
Here, Xk = (X1,k, X2,k, X3,k)T represents the position of the k-th monomer. By calculating the eigenvalues, the tensor may be written in an orthogonal basis with principal axis {â1, â2, â3}. In accordance with previous publications we refer to this basis as the target-frame (see e.g. Draine 1996; Lazarían & Hoang 2007a; Draine & Flatau 2013). Finally, we rotate each aggregate such that the moments of inertia  run along the principal axis. We emphasize that each dust grain’s target-frame is unique and well defined.
Appendix B Monte Carlo noise estimation
A certain level of noise is an inevitable drawback of any MC simulation. In this section we estimate the noise of our particular MC setup. For this, a subset of all dust aggregates consisting of 20 distinct grains per fractal dimension Df and size aeff is selected. Furthermore, 100 input parameter sets of gas and dust are randomly sampled within the range applied in Sect. 10.1. For each individual grain and input parameter set MC simulations are repeatedly performed for different numbers of collisions within
Ncoll ∊ [102,104]. We quantify the noise of the resulting angular momentum Jatt and the alignment angle Θatt at each attractor point via
 (B.1)
(B.1)
and
 (B.2)
(B.2)
respectively, where all differences are normalized with respect to the corresponding results at Ncoll = 104.
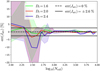 |
Fig. B.1 Distribution of the noise level of the angular momentum Jatt at distinct attractor points calculated for grains with an effective radius aeff = 400 nm and the different fractal dimensions of Df = 1.6 (solid green), Df = 2.0 (solid red), and Df = 2.4 (solid blue), respectively, dependent on the number of collisions Ncoll. All data points are normalized by the corresponding results at Ncoll = 104. Solid lines are the average of all Jatt while the shaded areas represent the minima and maxima of the noise level per Ncoll. Horizontal black lines indicate the range of ±2.6 %. |
In Fig. B.1 we present the noise level of Jatt for the exemplary grains with a size of aeff = 400 nm dependent on fractal dimension Df and Ncoll. For Ncoll < 103 we report a noise level up to ±25 %. With an increasing number of collisions Ncoll the noise range declines. Approaching Ncoll ≈ 103 the noise reaches a range below ±2.6 % and remains within that limit for Ncoll ≥ 103 independent of fractal dimensions Df. The overall trend is similar for the noise of the alignment angle Θatt at each attractor point as shown in Fig. B.2. However, the variation of the noise of Θatt is slightly larger for Ncoll ≥ 103 than that of Jatt but remains within the limit of ±2.6 % as well. We emphasize that this limit is independent of grain size.
We note that for an increasing Ncoll the run-time increases linearly for each individual run. For instance, by increasing the number of collisions from Ncoll = 103 to Ncoll = 104 the average run-time increases by a factor of about 8.5 while there is no further benefit by means of noise reduction. Running all MC simulations with Ncoll = 103, therefore, is the optimal compromise between run-time and noise. Hence, we estimate for our MAD MC setup to operate within an accuracy of ±2.6 %.
Appendix C Optical properties of dust aggregates
In order to determine the contribution of the IR drag to the grain alignment dynamics we need to calculate the efficiency of light absorption Qabs(λ) per aggregate. Usually, this quantity may be calculated for spherical grains as a series of Bessel functions and Legendre functions, respectively (e.g. Wolf & Voshchinnikov 2004) on the basis of refractive indices of distinct materials. Calculating Qabs(λ) for an entire aggregate adds considerable complexity to the problem. An exact solution for an aggregate may be achieved by the Multiple Sphere T-Matrix (MSTM) code (Mackowski & Mishchenko 2011; Egel et al. 2017). However, we find that calculating the optical properties with the help of MSTM for a larger ensemble of dust aggregates and several grain orientations cannot be achieved within a reasonable time frame. Alternatively, an approximate solution may be calculated with the dipole approximation code DDSCAT (Draine & Flatau 2013). Here, an arbitrary grain shape can approximated by a number of discrete dipoles Ndip (see e.g. DeVoe 1965; Draine & Flatau 1994, for details). The numerical limitations of DDSCAT per wavelength λ are given by
 (C.1)
(C.1)
where m is the imaginary refractive index of the grain material. Note that because of this limitation the run-time increases with  . Consequently, calculating the optical properties of an ensemble of large grain aggregates is still not feasible. In order to overcome these limitations we apply the extrapolation method suggested in Shen et al. (2008). The efficiencies Qabs(λ) are calculated for 45 different grain orientations around â1 and 200 wavelengths logarithmically distributed within the interval λ ∊ [0.2 μm, 2000 μm]. Here, we apply the refractive indices of silicate presented in Weingartner & Draine (2001). However, each solution is calculated with four different values of Ndip even though the condition given in Eq. C.1 may be violated. Finally, the efficiency Qabs(λ) is extrapolated by assuming Ndip → ∞. For about 1 % of all runs we repeat the calculations utilizing the MSTM code in order to estimate the error of this procedure. This way the Qabs(λ) for all aggregates may be calculated in a reasonable time frame.
In Fig. C.1 we present the result for to exemplary grains with a fractal dimension Df = 2.0 size of aeff = 200 nm and aeff = 800 nm, respectively. We find typical fractional errors of a few percent between the solutions of the MSTM code and the extrapolated solutions of DDSCAT for wavelengths λ > 1 μm. We note no systematic trend for different wavelength. The errors are generally larger with values up to ±10 % for λ < 1 μm. However, we consider only a maximal dust temperatures of 1000 K in our alignment models corresponding to a peak wavelength of the Planck function of λ ≈ 2.9 μm. Hence, the impact to the integral in Eq. 28 should only be marginal when using the extrapolation method of Shen et al. (2008) instead of more the more precise but time consuming MSTM calculations.
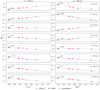 |
Fig. C.1 Plots of the efficiency of absorption Qabs(λ) for two exemplary grain shapes with a fractal dimension of Df = 2.0, different wavelengths λ (rows), and grain sizes aeff (columns). Solutions are calculated with the DDSCAT code for different values of the number of dipoles Ndip (red dot). The DDSCAT solutions are extrapolated assuming Ndip → ∞ (blue dots). The percentage values represent the error between the extrapolated solutions and the exact solutions of the MSTM code (black cross). |
Appendix D Stationary points
In this section we briefly outline general criteria to characterize the stationary points of the time evolution of the grain alignment dynamics. For convenience we write the first time derivatives of Eq. 37 and Eq. 38 as  and
and  , respectively. Each stationary point
  of this system of differential equations is defined by the sufficient conditions
 (D.1)
(D.1)
and
 (D.2)
(D.2)
Consequently,  and
and  may be approximated around
  as a Taylor series up to the first order as
 (D.3)
(D.3)
and
 (D.4)
(D.4)
respectively. This linearization defines a equation system of the form:
 (D.5)
(D.5)
Here, the Jacobian matrix may be evaluated at the corresponding static points with the imaginary eigenvalues λ1 and λ2 Under the condition ℜ(λ1) · ℜ(λ2) ≠ 0 for the real parts eigenvalues the nature of the static points can be quantified as listed in Tab. D.1.
Necessary conditions to identify a stationary point as an attractor point or repeller point, respectively.
Exactly, the same procedure is applied to characterize the stationary points  of Eq. 47 and Eq. 48. We note that criteria are presented in Draine (1996) and Lazarían & Hoang (2007a) to characterize stationary points for the particular scenarios of magnetic field alignment and RAT alignment, respectively.
Appendix E Size distribution test
Dust aggregates are usually constructed using a constant monomer size amon. However, in our study the ensemble of dust grain follows the scaling law presented in Filippov et al. (2000) to guarantee a certain fractal dimension (see Eq. 2) and simultaneously a size distribution law to account for different monomer sizes (see Eq. 3). Although such a modification is briefly discussed in Skorupski et al. (2014), it is not a priori clear that an aggregate can comply with one of the laws without violating the other. In this section we briefly explore where the aggregate may not strictly scale as demanded by the monomer size distribution and given fractal dimension.
In Fig. E.1 we present the monomer size distribution p (10 nm) for grains with a size of aeff = 400 nm. For a fractal dimension of Df > 2.0 the monomer size distribution is no longer followed for the largest values of amon. This is because for more roundish grains with aeff ≥ 400 nm it becomes increasingly unlikely to find a proper position without any overlap. In our implementation of the algorithm presented in Skorupski et al. (2014) after a few thousand attempts to connect a large monomer to an aggregate’s surface a kill counter kicks in and a new monomer size is sampled in order to ensure that each aggregate is constructed within an acceptable time frame. Consequently, smaller grains with aeff ≤ 200 nm suffer less from this limitation where even grains with Df = 2.6 follow strictly the size distribution. The fractal dimension Df of a dust aggregate can be estimated by the correlation function (see e.g. Skorupski et al. 2014)
 (E.1)
(E.1)
where r is the distance from the center of mass, l is a length with l ≪ aeff, and n(r) is the number density of connected monomers within the shell [r − l/2; r + l/2].
In Fig. E.2 we present the resulting fractal dimensions for the ensemble of grains with aeff = 400 nm. Here, the function C(r) is consistent with the demanded fractal dimension. Exceptions are at the very surface of the grains as well as toward the center. The largest deviation is for grains with Df ≤ 1.8 where the correlation function C(r) already starts to break down at r = aeff. This trend is similar for all grains sizes but smaller grains have larger variation in C(r). However, for the most elongated grains Df ≤ 1.8 the radius aeff represents only the inner most region considering the extension of the total aggregate i.e. aeff ≪ aout (see Fig. 1). Hence, we estimate the deviations from the scaling law, the size distribution of monomers on the grains surface and the inner core to influence our results only marginally.
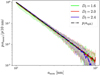 |
Fig. E.1 Distribution of the monomer size amon averaged over the grain ensemble with aeff = 400 nm for the fractal dimensions of Df = 1.6 (solid green), Df = 2.0 (solid red), Df = 2.4 (solid blue), respectively, in comparison with the distribution function p (amon), (dash dotted black). For comparison, all distributions are normalized by p (10 nm). |
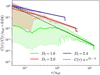 |
Fig. E.2 The same as Fig. E.1 but for the correlation function C(r) over the distance r/aeff from the center of mass. |
Appendix F List of applied physical quantities
In Table F.1 we briefly list all physical quantities utilized in this paper.
Table of the physical quantities and abbreviations utilized in this paper.
References
- Alves, F. O., Frau, P., Girart, J. M., et al. 2014, A & A, 569, A1 [Google Scholar]
- Andersson, B.-G., & Potter, S. B. 2007, ApJ, 665, 369 [NASA ADS] [CrossRef] [Google Scholar]
- Andersson, B.-G., & Potter, S. B. 2010, ApJ, 720, 1045 [NASA ADS] [CrossRef] [Google Scholar]
- Baric, V., Grossmann, H. K., Koch, W., & Mädler, L. 2018, Part. Part. Syst. Character., 35, 1800177 [CrossRef] [Google Scholar]
- Barnett, S. J. 1917, Phys. Rev., 10, 7 [NASA ADS] [CrossRef] [Google Scholar]
- Bauer, F., Daun, K., Huber, F., & Will, S. 2019, Appl. Phys. B, 125, 109 [NASA ADS] [CrossRef] [Google Scholar]
- Beckwith, S. V. W., Henning, T., & Nakagawa, Y. 2000, in Protostars and Planets IV, eds. V. Mannings, A. P. Boss, & S. S. Russell (Tucson: University of Arizona Press), 533 [Google Scholar]
- Bertrang, G. H. M., & Wolf, S. 2017, MNRAS, 469, 2869 [NASA ADS] [CrossRef] [Google Scholar]
- Bescond, A., Yon, J., Ouf, F. X., et al. 2014, Aerosol Sci. Technol., 48, 831 [CrossRef] [Google Scholar]
- Bethell, T. J., Chepurnov, A., Lazarían, A., & Kim, J. 2007, ApJ, 663, 1055 [NASA ADS] [CrossRef] [Google Scholar]
- Cazaux, S., & Tielens, A. G. G. M. 2002, ApJ, 575, L29 [NASA ADS] [CrossRef] [Google Scholar]
- Chakrabarty, R. K., Moosmüller, H., Arnott, W. P., et al. 2007, Appl. Opt., 46, 6990 [Google Scholar]
- Cho, J., & Lazarían, A. 2005, ApJ, 631, 361 [NASA ADS] [CrossRef] [Google Scholar]
- Cortes, P. C., Crutcher, R. M., & Matthews, B. C. 2006, ApJ, 650, 246 [NASA ADS] [CrossRef] [Google Scholar]
- Cortes, P. C., Gouellec, V. J. M. L., Hull, C. L. H., et al. 2021, ApJ, 907, 94 [NASA ADS] [CrossRef] [Google Scholar]
- Das, I., & Weingartner, J. C. 2016, MNRAS, 457, 1958 [NASA ADS] [CrossRef] [Google Scholar]
- Davis, L., & Greenstein, J. L. 1949, Phys. Rev., 75, 1605 [NASA ADS] [CrossRef] [Google Scholar]
- Davis, L. Jr., & Greenstein, J. L. 1951, ApJ, 114, 206 [NASA ADS] [CrossRef] [Google Scholar]
- DeVoe, H. 1965, J. Chem. Phys., 43, 3199 [NASA ADS] [CrossRef] [Google Scholar]
- Dolginov, A. Z., & Mytrophanov, I. G. 1976, Ap & SS, 43, 257 [Google Scholar]
- Dominik, C., & Tielens, A. G. G. M. 1997, ApJ, 480, 647 [Google Scholar]
- Draine, B. T. 1996, ASP Conf. Ser., 97, 16 [NASA ADS] [Google Scholar]
- Draine, B. T., & Flatau, P. J. 1994, J. Opt. Soc. Am. A, 11, 1491 [NASA ADS] [CrossRef] [Google Scholar]
- Draine, B. T., & Flatau, P. J. 2013, ArXiv e-prints [arXiv:1385.6497] [Google Scholar]
- Draine, B. T., & Lazarían, A. 1999, ApJ, 512, 740 [NASA ADS] [CrossRef] [Google Scholar]
- Draine, B. T., & Salpeter, E. E. 1979, ApJ, 231, 77 [NASA ADS] [CrossRef] [Google Scholar]
- Draine, B. T., & Weingartner, J. C. 1996, ApJ, 470, 551 [NASA ADS] [CrossRef] [Google Scholar]
- Draine, B. T., & Weingartner, J. C. 1997, ApJ, 480, 633 [NASA ADS] [CrossRef] [Google Scholar]
- Dwek, E., & Arendt, R. G. 1992, ARA & A, 30, 11 [Google Scholar]
- Egel, A., Pattelli, L., Mazzamuto, G., Wiersma, D. S., & Lemmer, U. 2017, JQSRT, 199, 103 [NASA ADS] [CrossRef] [Google Scholar]
- Filippov, A., Zurita, M., & Rosner, D. 2000, J. Colloid Interface Sci., 229, 261 [NASA ADS] [CrossRef] [Google Scholar]
- Gold, T. 1952a, Nature, 169, 322 [NASA ADS] [CrossRef] [Google Scholar]
- Gold, T. 1952b, MNRAS, 112, 215 [NASA ADS] [CrossRef] [Google Scholar]
- Greenberg, J. M. 1968, Nebulae and Interstellar Matter, eds. B. Middlehurst & L. Aller (University of Chicago Press), 7, 221 [NASA ADS] [Google Scholar]
- Greenberg, J. M., Mizutani, H., & Yamamoto, T. 1995, A & A, 295, L35 [NASA ADS] [Google Scholar]
- Guillet, V. 2008, Ph.D. Thesis, Université Paris Sud Paris XI, France [Google Scholar]
- Guillet, V., Fanciullo, L., Verstraete, L., et al. 2018, A & A, 610, A16 [NASA ADS] [CrossRef] [EDP Sciences] [Google Scholar]
- Habart, E., Boulanger, F., Verstraete, L., Walmsley, C. M., & Pineau des Forêts, G. 2004, A & A, 414, 531 [NASA ADS] [CrossRef] [EDP Sciences] [Google Scholar]
- Hall, J. S. 1949, Science, 109, 166 [NASA ADS] [CrossRef] [Google Scholar]
- Herranen, J., Lazarían, A., & Hoang, T. 2021, ApJ, 913, 63 [NASA ADS] [CrossRef] [Google Scholar]
- Hiltner, W. A. 1949a, ApJ, 109, 471 [NASA ADS] [CrossRef] [Google Scholar]
- Hiltner, W. A. 1949b, Science, 109, 165 [CrossRef] [Google Scholar]
- Hoang, T. 2020, Galaxies, 8, 52 [NASA ADS] [CrossRef] [Google Scholar]
- Hoang, T. 2022, ApJ, 928, 102 [NASA ADS] [CrossRef] [Google Scholar]
- Hoang, T., & Lazarían, A. 2007, AAS Meet. Abstr., 210, 79.01 [NASA ADS] [Google Scholar]
- Hoang, T., & Lazarían, A. 2008, MNRAS, 388, 117 [NASA ADS] [CrossRef] [Google Scholar]
- Hoang, T., & Lazarían, A. 2009, ApJ, 695, 1457 [NASA ADS] [CrossRef] [Google Scholar]
- Hoang, T., & Lazarían, A. 2014, MNRAS, 438, 680 [NASA ADS] [CrossRef] [Google Scholar]
- Hoang, T., & Lazarían, A. 2016, ApJ, 831, 159 [NASA ADS] [CrossRef] [Google Scholar]
- Hoang, T., Lazarían, A., & Martin, P. G. 2014, ApJ, 790, 6 [NASA ADS] [CrossRef] [Google Scholar]
- Hoang, T., Lazarían, A., & Andersson, B. G. 2015, MNRAS, 448, 1178 [NASA ADS] [CrossRef] [Google Scholar]
- Hoang, T., Cho, J., & Lazarían, A. 2018, ApJ, 852, 129 [NASA ADS] [CrossRef] [Google Scholar]
- Hoang, T., Tram, L. N., Lee, H., & Ahn, S.-H. 2019, Nat. Astron., 3, 766 [Google Scholar]
- Hollenbach, D., & Salpeter, E. E. 1971, ApJ, 163, 155 [NASA ADS] [CrossRef] [Google Scholar]
- Hollenbach, D., & McKee, C. F. 1979, ApJS, 41, 555 [Google Scholar]
- Hopkins, P. F. & Squire, J. 2018, MNRAS, 480, 2813 [NASA ADS] [CrossRef] [Google Scholar]
- Jones, A. P., Fanciullo, L., Köhler, M., et al. 2013, A & A, 558, A62 [NASA ADS] [CrossRef] [EDP Sciences] [Google Scholar]
- Jones, R. V., & Spitzer, L. Jr., 1967, ApJ, 147, 943 [NASA ADS] [CrossRef] [Google Scholar]
- Jones, T. J., Bagley, M., Krejny, M., Andersson, B. G., & Bastien, P. 2015, AJ, 149, 31 [Google Scholar]
- Jones, T. J., Gordon, M., Shenoy, D., et al. 2016, AJ, 151, 156 [NASA ADS] [CrossRef] [Google Scholar]
- Kandilian, R., Heng, R.-L., & Pilon, L. 2015, JQSRT, 151, 310 [NASA ADS] [CrossRef] [Google Scholar]
- Karasev, V., Onischuk, A., Glotov, O., et al. 2004, Combust. Flame, 138, 40 [Google Scholar]
- Kataoka, A., Okuzumi, S., & Tazaki, R. 2019, ApJ, 874, L6 [CrossRef] [Google Scholar]
- Katz, N., Furman, I., Biham, O., Pirronello, V., & Vidali, G. 1999, ApJ, 522, 305 [NASA ADS] [CrossRef] [Google Scholar]
- Kelesidis, G. A., Furrer, F. M., Wegner, K., & Pratsinis, S. E. 2018, Langmuir, 34, 8532 [Google Scholar]
- Kim, T. H., Takigawa, A., Tsuchiyama, A., et al. 2021, A & A, 656, A42 [NASA ADS] [CrossRef] [EDP Sciences] [Google Scholar]
- Köylü, U. O., & Faeth, G. M. 1994, J. Heat Transfer, 116, 971 [CrossRef] [Google Scholar]
- Kozasa, T., Blum, J., & Mukai, T. 1992, A & A, 263, 423 [NASA ADS] [Google Scholar]
- Kuffmeier, M., Reissl, S., Wolf, S., Stephens, I., & Calcutt, H. 2020, A & A, 639, A137 [NASA ADS] [CrossRef] [EDP Sciences] [Google Scholar]
- Kwon, W., Stephens, I. W., Tobin, J. J., et al. 2019, ApJ, 879, 25 [NASA ADS] [CrossRef] [Google Scholar]
- Lazarían, A. 1994, MNRAS, 268, 713 [CrossRef] [Google Scholar]
- Lazarían, A. 1995a, ApJ, 451, 660 [CrossRef] [Google Scholar]
- Lazarían, A. 1995b, A & A, 293, 859 [Google Scholar]
- Lazarían, A. 1997, ApJ, 483, 296 [CrossRef] [Google Scholar]
- Lazarían, A., & Draine, B. T. 1999a, ApJ, 516, L37 [CrossRef] [Google Scholar]
- Lazarían, A., & Draine, B. T. 1999b, ApJ, 520, L67 [CrossRef] [Google Scholar]
- Lazarían, A., & Efroimsky, M. 1999, MNRAS, 303, 673 [CrossRef] [Google Scholar]
- Lazarían, A., & Hoang, T. 2007a, MNRAS, 378, 910 [CrossRef] [Google Scholar]
- Lazarían, A., & Hoang, T. 2007b, ApJ, 669, L77 [CrossRef] [Google Scholar]
- Lazarían, A., & Hoang, T. 2008, ApJ, 676, L25 [CrossRef] [Google Scholar]
- Lazarían, A., & Hoang, T. 2019, ApJ, 883, 122 [CrossRef] [Google Scholar]
- Lazarían, A., & Roberge, W. G. 1997, ApJ, 484, 230 [CrossRef] [Google Scholar]
- Le Bourlot, J., Le Petit, F., Pinto, C., Roueff, E., & Roy, F. 2012, A & A, 541, A76 [NASA ADS] [CrossRef] [EDP Sciences] [Google Scholar]
- Le Gouellec, V. J. M., Maury, A. J., Guillet, V., et al. 2020, A & A, 644, A11 [NASA ADS] [CrossRef] [EDP Sciences] [Google Scholar]
- Lehre, T., Jungfleisch, B., Suntz, R., & Bockhorn, H. 2003, Appl. Opt., 42, 2021 [Google Scholar]
- Liu, C., Yin, Y., Hu, F., Jin, H., & Sorensen, C. M. 2015, Aerosol Sci. Technol., 49, 928 [NASA ADS] [CrossRef] [Google Scholar]
- Mackowski, D. W., & Mishchenko, M. I. 2011, J. Quant. Spec. Radiat. Transf., 112, 2182 [NASA ADS] [CrossRef] [Google Scholar]
- Martin, P. G. 1971, MNRAS, 153, 279 [NASA ADS] [Google Scholar]
- Mathis, J. S. 1986, ApJ, 308, 281 [CrossRef] [Google Scholar]
- Mathis, J. S., & Whiffen, G. 1989, ApJ, 341, 808 [Google Scholar]
- Matsumura, M., Kameura, Y., Kawabata, K. S., et al. 2011, PASJ, 63, L43 [NASA ADS] [Google Scholar]
- Ossenkopf, V. 1993, A & A, 280, 617 [NASA ADS] [Google Scholar]
- Pattle, K., Lai, S.-P., Wright, M., et al. 2021, MNRAS, 503, 3414 [NASA ADS] [CrossRef] [Google Scholar]
- Pirronello, V., Liu, C., Roser, J. E., & Vidali, G. 1999, A & A, 344, 681 [NASA ADS] [Google Scholar]
- Purcell, E. M. 1975, Interstellar Grains as Pinwheels, eds. G. B. Field, & A. G. W. Cameron (New York: Neale Watson Academic Publications), 155 [Google Scholar]
- Purcell, E. M. 1979, ApJ, 231, 404 [NASA ADS] [CrossRef] [Google Scholar]
- Purcell, E. M., & Spitzer, Lyman J. 1971, ApJ, 167, 31 [NASA ADS] [CrossRef] [Google Scholar]
- Rao, R., Crutcher, R. M., Plambeck, R. L., & Wright, M. C. H. 1998, ApJ, 502, L75 [NASA ADS] [CrossRef] [Google Scholar]
- Reissl, S., Wolf, S., & Brauer, R. 2016, A & A, 593, A87 [NASA ADS] [CrossRef] [EDP Sciences] [Google Scholar]
- Reissl, S., Guillet, V., Brauer, R., et al. 2020, A & A, 640, A118 [NASA ADS] [CrossRef] [EDP Sciences] [Google Scholar]
- Reissl, S., Stutz, A. M., Klessen, R. S., Seifried, D., & Walch, S. 2021, MNRAS, 500, 153 [Google Scholar]
- Sadavoy, S. I., Stephens, I. W., Myers, P. C., et al. 2019, ApJS, 245, 2 [Google Scholar]
- Salameh, S., van der Veen, M. A., Kappl, M., & van Ommen, J. R. 2017, Langmuir, 33, 2477 [Google Scholar]
- Savitzky, A., & Golay, M. J. E. 1964, Analyt. Chem., 36, 1627 [NASA ADS] [CrossRef] [Google Scholar]
- Seifried, D., Walch, S., Weis, M., et al. 2020, MNRAS, 497, 4196 [Google Scholar]
- Seizinger, A., Speith, R., & Kley, W. 2012, A & A, 541, A59 [NASA ADS] [CrossRef] [EDP Sciences] [Google Scholar]
- Seizinger, A., Speith, R., & Kley, W. 2013, A & A, 559, A19 [NASA ADS] [CrossRef] [EDP Sciences] [Google Scholar]
- Shen, Y., Draine, B., & Johnson, E. 2008, ApJ, 689, 260 [NASA ADS] [CrossRef] [Google Scholar]
- Shull, J. M. 1978, ApJ, 226, 858 [NASA ADS] [CrossRef] [Google Scholar]
- Skorupski, K., Mroczka, J., Wriedt, T., & Riefler, N. 2014, Physica A, 404, 106 [NASA ADS] [CrossRef] [Google Scholar]
- Slobodrian, R., Rioux, C., & Piche, M. 2011, Open J. Met., 1, 7 [Google Scholar]
- Spitzer, L., & Tukey, J. W. 1949, Science, 109, 461 [NASA ADS] [CrossRef] [Google Scholar]
- Squire, J., Moroianu, S., & Hopkins, P. F. 2021, MNRAS, 510, 110 [NASA ADS] [CrossRef] [Google Scholar]
- Takahashi, S., Machida, M. N., Tomisaka, K., et al. 2019, ApJ, 872, 70 [NASA ADS] [CrossRef] [Google Scholar]
- Tang, Y.-W., Ho, P. T. P., Girart, J. M., et al. 2009, ApJ, 695, 1399 [Google Scholar]
- Tatsuuma, M., Kataoka, A., & Tanaka, H. 2019, ApJ, 874, 159 [Google Scholar]
- Tazaki, R., Tanaka, H., Kataoka, A., Okuzumi, S., & Muto, T. 2019, ApJ, 885, 52 [Google Scholar]
- Vaillancourt, J. E., & Andersson, B.-G. 2015, ApJ, 812, L7 [NASA ADS] [CrossRef] [Google Scholar]
- Valdivia, V., Maury, A., Brauer, R., et al. 2019, MNRAS, 488, 4897 [NASA ADS] [CrossRef] [Google Scholar]
- Wada, K., Tanaka, H., Suyama, T., Kimura, H., & Yamamoto, T. 2007, ApJ, 661, 320 [NASA ADS] [CrossRef] [Google Scholar]
- Wang, J., Meng, X., Yan, K., & Chen, J. 2019, Processes, 7, 761 [Google Scholar]
- Weingartner, J. C., & Draine, B. T. 2001, ApJ, 548, 296 [Google Scholar]
- Weingartner, J. C., & Draine, B. T. 2003, ApJ, 589, 289 [NASA ADS] [CrossRef] [Google Scholar]
- Whittet, D. C. B., Hough, J. H., Lazarían, A., & Hoang, T. 2008, ApJ, 674, 304 [NASA ADS] [CrossRef] [Google Scholar]
- Wolf, S., & Voshchinnikov, N. V. 2004, Comput. Phys. Commun., 162, 113 [Google Scholar]
- Wu, J., Faccinetto, A., Grimonprez, S., et al. 2020, Atmos. Chem. Phys., 20, 4209 [Google Scholar]
- Yan, H., & Lazarían, A. 2003, ApJ, 592, L33 [NASA ADS] [CrossRef] [Google Scholar]
- Zhang, J.-Y., Qi, H., Shi, J.-W., Gao, B.-H., & Ren, Y.-T. 2020, Opt. Express, 28, 37249 [NASA ADS] [CrossRef] [Google Scholar]
We emphasize that this paper is strictly in SI units. Hence values of K may differ by a factor of 1 /(4π) when compared to other publications.
We emphasize that exact conditions of whether ∆s or B is the preferential direction of grain alignment is to be dealt with in an upcoming paper. Within the scope of this paper we simply assume an grain alignment with the magnetic field direction for all grains in order to explore the distribution of long-term stable attractor points.
Note that R = 0 might also represent the case where all grains coincidentally have a stable alignment at an angle of Θ = 54.7°.
The exact inter-dependencies resulting in these exceptions need to be dealt with in an upcoming paper.
All Tables
Applied values of gas density ng, gas temperature Tg, dust temperature Td, gas-dust drift ∆s, and magnetic field strength B typical for the cold neutral medium (CNM).
Necessary conditions to identify a stationary point as an attractor point or repeller point, respectively.
All Figures
|
Fig. 1 Exemplary fractal dust grains with a number of monomers Nmon. Monomer sizes and Nmon are selected in such a way to guarantee an exact effective radius aeff. Grains in the same row possess identical radii aeff while gains in the same column are constructed with the same fractal dimension Df. The quantity aout is the radius of the smallest sphere enveloping the entire aggregate. Note that aeff approaches aout with increasing Df. Each grain’s coordinate system (target-frame) {â1, â2, â3} is unambiguously defined by its inertia tensor. |
| In the text | |
|
Fig. 2 Sketch of the relation of vectors and angles between the lab-frame {ê1, ê2, ê3} and the target-frame {â1, â2, â3}. In the applied MC setup the unit vector ê1 is antiparallel to the direction of the drift velocity Δs. The vectors ê2 and ê3 are chosen to create an orthonormal basis together with ê1 for the gas properties. The target-frame {â1, â2, â3} is defined by the moments of inertia of the dust aggregate. It is assumed that the grain is rapidly rotating around the principal axes â1 and that the angular momentum J of the grain is parallel to â1. The rotating dust may perform a stable precession with respect to Δs. Here, the quantities β, Θ, and Φ are the angles of rotation, alignment, and precession, respectively. |
| In the text | |
|
Fig. 3 Distribution function P∆s(ϑ). The gas-dust drift of Δs is antiparallel with the axis ê1 while the dust grain is situated in the origin of the lab-frame. For a gas-dust drift of Δs = 0 the gas velocity field is isotropic concerning the trajectories of individual gas particles. With Δs > 0 the gas is more likely to approach the gain with an trajectory parallel to Δs. Note that for a drift with Δs ≥ 1 the probability to find a gas particle approaching the dust under an angle of ϑ = 180° is already virtually zero. |
| In the text | |
|
Fig. 4 Gas sticking probability S (Td) as a function of the dust grain temperature Td and different gas temperatures Tg. Both increasing gas and dust temperatures would decrease the probability for a gas particle to stick on the surface of a dust grain. We emphasize that 1 − S (Td) is the probability of gas scattering. |
| In the text | |
|
Fig. 5 Exemplary efficiencies of gas collision Qcoll, desorption Qdes, and scattering scattering Qsca as well as the total mechanical efficiency Qmech over alignment angle Θ and typical CNM conditions. All efficiencies are averaged over the angle β. The panels are for the different gas-dust drift of ∆s = 0.1 (top), ∆s = 1.0 (middle), and ∆s = 10.0 (bottom), respectively. We emphasize that all efficiencies are simulated for the grain with size aeff = 400 nm and fractal dimension Df = 2.0 depicted in the very center of Fig. 1. |
| In the text | |
|
Fig. 6 Characteristic gas drag timescale τgas of rotating grains over the effective radius aeff. The lines represent the average values over the ensemble of dust grains with a distinct fractal dimension Df and gas-dust drift ∆s assuming typical CNM conditions. |
| In the text | |
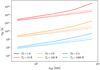 |
Fig. 7 Same as Fig. 6, but for the IR drag timescale τIR and different dust temperatures Td. |
| In the text | |
|
Fig. 8 Comparison of the characteristic timescales of the IR drag τIR, the gas drag τgas, and the total drag τdrag, respectively, dependent on gas number densitie ngas and fractal dimension Df. The lines represent the average values over the entire ensemble of grains with an effective radius of aeff = 400 nm. For the gas we assume typical CNM conditions. |
| In the text | |
|
Fig. 9 Same as Fig. 2, but with an external magnetic field B. The precession of the grain is now with respect to the orientation of В with a precession angel of ϕ. Note that the angle ψ between the gas-dust drift Δs and В as well as the magnitude of В are free parameters in this model. In this configuration the resulting angle of alignment ξ is between В and â1 whereas the angles Θ and Φ may be expressed now as functions of ξ and ψ. |
| In the text | |
|
Fig. 10 Same as Fig. 6, but for the DG alignment timescale τdg for different strengths В of the magnetic field and typical CNM conditions. |
| In the text | |
|
Fig. 11 Phase portrait for the correlation between the angular momentum J/Jth and the alignment angle Θ. The plotted grain dynamic is calculated with the parameters of the gas and the considered MET efficiency Qmech being identical to those presented in Fig. 5. Note that negative values of J represent the case when the vectors of the grain’s principal axis â1 and J are antiparallel and vice versa. The weights wi describe the probability to reach a certain attractor point from any arbitrary starting point within the phase portrait. |
| In the text | |
|
Fig. 12 Estimated tensile strength Smax over fractal dimension Df for all the considered grain sizes aeff. |
| In the text | |
|
Fig. 13 Average angular momentum |J/Jth| (solid lines) over gas number density ng (top left), gas temperature Tg (top right), dust temperature Td (bottom left), and gas-dust drift ∆s (bottom right), respectively, and typical CNM conditions. All results are for the ensemble of dust grains with a size of aeff = 400 nm and a fractal dimension Df = 1.6 (purple), Df = 2.0 (pink), and Df = 2.4 (yellow), respectively. The solid lines represent the ensemble average of the angular momenta while the shaded areas indicate the range of one standard deviation of all data points are situated. Dotted lines are the threshold of J/Jth = 3 where a stable alignment is assumed while dashed lines is the average of the corresponding critical angular momentum J = 〈 Jdisr〉 where dust grains are estimated to become rotationally disrupted. We note that we plot only the average threshold 〈 Jdisr〉 of rotational disruption for clarity while the range of Jdisr is about one order of magnitude. |
| In the text | |
|
Fig. 14 Histograms of the distribution of the alignment angle Θ of all attractor points with an angular momentum J within the range of 3Jth < |J| < Jdisr. The parameter ζ is the ratio of grains with at least one attractor within that range to the total number of considered dust grains. The histograms are for grains with a size of aeff = 400 nm and a fractal dimension of Df = 1.6 (left), Df = 2.0 (middle), and Df = 2.4 (right), respectively. Red bars are weighted attractor points while gray bars are the unweighted ones. We assume CNM conditions but 5 with a gas number density of ng = 106 m−3. |
| In the text | |
|
Fig. 15 RRF R corresponding to the conditions presented in Fig. 13. Solid lines represent the ensemble of grains fulfilling the alignment condition 3Jth < \J\ while for dashed lines rotational disruption is also taken into account i.e. all grains rotating with |J| > Jdisr cannot contribute to polarization. |
| In the text | |
|
Fig. 16 Same as Fig. 14 but for grains with a fractal dimension of Df = 2.0 and CNM conditions for the different grain sizes of aeff = 50 nm (left), aeff = 200 nm (middle), and aeff = 800 nm (right), respectively. |
| In the text | |
|
Fig. 17 Left panel: same as Fig. 13 but over all considered grain sizes aeff. Right panel: RRF R corresponding to the conditions presented on the left panel. |
| In the text | |
|
Fig. 18 Same as Fig. 11 but for magnetic alignment with a gas-dust drift of Δs = 0.1, an amplification factor of fmag = 1 and an angle Ψ = 15°. |
| In the text | |
|
Fig. 19 Same as the angular momentum |J/Jth| over gas-dust drift Δs presented in Fig. 13 but for all grains aligning in direction of an external magnetic field instead of the direction of the gas-dist drift Δs. In this plot an amplification factor of fmag = 1 is applied. We emphasize that all of the angles ξ and ψ = 15°, respectively, are considered. |
| In the text | |
|
Fig. 20 Angular momentum |J|Jth| over the angle ψ for dust grains with a size of aeff = 400 nm and a fractal dimension of Df = 1.6 (blue), Df = 2.0 (purple), and Df = 2.4 (yellow), respectively, for typical CNM conditions but with a gas-dust drift Δs = 1.0. The results are calculated for a constant alignment angle of ξ = 15° and for an amplification factor of fmag = 1 (solid), fmag = 103 (dotted), and fmag = 106 (dash dotted), respectively, for clarity we plot only the average values of |J|Jth| The range of angular momenta is generally of the same order as in Fig. 19. |
| In the text | |
|
Fig. 21 Normalized histogram of the distribution of the alignment angle ξ for dust grains with a size of aeff = 400 nm and a fractal dimension of Df = 1.6 (left), Df = 2.0 (middles), and Df = 2.4 (right), respectively, for typical CNM conditions but with a gas-dust drift of Δs = 1.0. Here, the amplification factor is fmag = 1.0 for all panels. Color-coded is the angle ψ while ζ is the corresponding ratio of attractor points with an angular momentum J in between 3Jth < |J| < Jdisr to the total number of considered dust grains. We note that an alignment angle of ξ = 0° followed by ξ = 90°, respectively, are the preferential configurations for the magnetic field alignment (compare also Fig. 14). For clarity we only plot configurations with a ratio ζ > 2.0 % since distributions with a smaller ζ would only contribute a few but high peaks to the histogram. |
| In the text | |
|
Fig. 22 Same as Fig. 21 but for grains with a fractal dimension of Df = 2.0 and a gas-dust drift of Δs = 0.1 (left), Δs = 1.0 (middle), and Δs = 10.0 (right), respectively. |
| In the text | |
|
Fig. 23 Same as Fig. 22 but with a gas-dust drift of Δs = 1.0 and an amplification factor of fmag = 1 (left), fmag = 103 (middle), and fmag = 106 (right), respectively. |
| In the text | |
|
Fig. 24 Left panel: RRF R over the gas-dust drift ∆s for the conditions presented in Fig. 19 but for an angle ψ = 15°. Right panel: same as the left panel but for the RRF over the angle ψ but with a gas-dust drift of ∆s = 1.0 (compare Fig. 20). |
| In the text | |
|
Fig. B.1 Distribution of the noise level of the angular momentum Jatt at distinct attractor points calculated for grains with an effective radius aeff = 400 nm and the different fractal dimensions of Df = 1.6 (solid green), Df = 2.0 (solid red), and Df = 2.4 (solid blue), respectively, dependent on the number of collisions Ncoll. All data points are normalized by the corresponding results at Ncoll = 104. Solid lines are the average of all Jatt while the shaded areas represent the minima and maxima of the noise level per Ncoll. Horizontal black lines indicate the range of ±2.6 %. |
| In the text | |
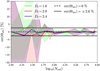 |
Fig. B.2 The same as Fig. B.1 but for the distribution of the alignment angle Θ. |
| In the text | |
|
Fig. C.1 Plots of the efficiency of absorption Qabs(λ) for two exemplary grain shapes with a fractal dimension of Df = 2.0, different wavelengths λ (rows), and grain sizes aeff (columns). Solutions are calculated with the DDSCAT code for different values of the number of dipoles Ndip (red dot). The DDSCAT solutions are extrapolated assuming Ndip → ∞ (blue dots). The percentage values represent the error between the extrapolated solutions and the exact solutions of the MSTM code (black cross). |
| In the text | |
|
Fig. E.1 Distribution of the monomer size amon averaged over the grain ensemble with aeff = 400 nm for the fractal dimensions of Df = 1.6 (solid green), Df = 2.0 (solid red), Df = 2.4 (solid blue), respectively, in comparison with the distribution function p (amon), (dash dotted black). For comparison, all distributions are normalized by p (10 nm). |
| In the text | |
|
Fig. E.2 The same as Fig. E.1 but for the correlation function C(r) over the distance r/aeff from the center of mass. |
| In the text | |
Current usage metrics show cumulative count of Article Views (full-text article views including HTML views, PDF and ePub downloads, according to the available data) and Abstracts Views on Vision4Press platform.
Data correspond to usage on the plateform after 2015. The current usage metrics is available 48-96 hours after online publication and is updated daily on week days.
Initial download of the metrics may take a while.