Fig. 6
Download original image
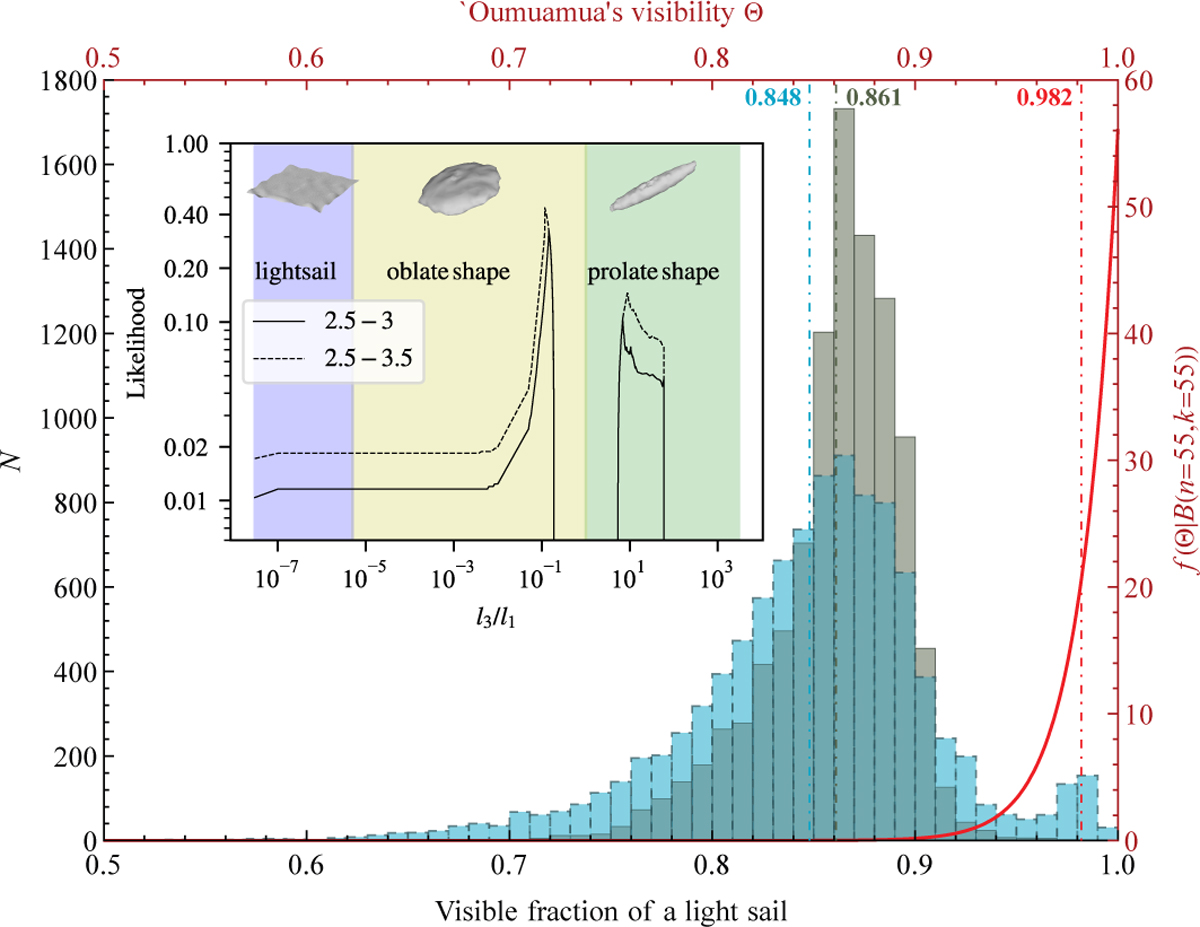
Fig. 6 – Histogram of 104 simulations of visible probability of a light sail versus posterior visible probability density distribution of Oumuamua over 49 days. The gray histogram represents the statistical result from a uniform random sampling, whereas the blue histogram is the statistical outcome from a nonuniform sampling that mimics ground-based and HST astrometry of Oumuamua. The dot-dashed gray and blue lines denote the mean values of these two statistical visibility simulations of a light sail, respectively. The dot-dashed and solid red lines represent the expected a posteriori estimation and the posterior probability distribution of Oumuamua’s visible probability (see Eq. (35)), respectively, based on the fact that Oumuamua was visible in all 55 observations. The embedded panel shows the likelihood that the amplitude of the light curve varies within the ranges ΔH ≃ (2.5,3) (Meech et al. 2017) and (2.5, 3.5) during the period October 25 = −27, 2017, for the light-sail, oblate shape, and prolate shape models.
Current usage metrics show cumulative count of Article Views (full-text article views including HTML views, PDF and ePub downloads, according to the available data) and Abstracts Views on Vision4Press platform.
Data correspond to usage on the plateform after 2015. The current usage metrics is available 48-96 hours after online publication and is updated daily on week days.
Initial download of the metrics may take a while.