| Issue |
A&A
Volume 667, November 2022
|
|
|---|---|---|
| Article Number | A49 | |
| Number of page(s) | 9 | |
| Section | Atomic, molecular, and nuclear data | |
| DOI | https://doi.org/10.1051/0004-6361/202244102 | |
| Published online | 04 November 2022 | |
Broadband spectroscopy of astrophysical ice analogues
II. Optical constants of CO and CO2 ices in the terahertz and infrared ranges
1
Prokhorov General Physics Institute of the Russian Academy of Sciences,
119991
Moscow, Russia
2
Max-Planck-Institut für Extraterrestrische Physik,
Gießenbachstraße 1,
Garching
85748, Germany
e-mail: This email address is being protected from spambots. You need JavaScript enabled to view it.
3
Aix-Marseille Univ, CNRS, CNES, LAM,
Marseille, France
4
Bauman Moscow State Technical University,
105005
Moscow, Russia
Received:
24
May
2022
Accepted:
13
July
2022
Abstract
Context. Broadband optical constants of astrophysical ice analogues in the infrared (IR) and terahertz (THz) ranges are required for modeling the dust continuum emission and radiative transfer in dense and cold regions, where thick icy mantles are formed on the surface of dust grains. Such data are still missing from the literature, which can be attributed to the lack of appropriate spectroscopic systems and methods for laboratory studies.
Aims. In this paper, the THz time-domain spectroscopy (TDS) and the Fourier-transform IR spectroscopy (FTIR) are combined to study optical constants of CO and CO2 ices in the broad THz-IR spectral range.
Methods. The measured ices were grown at cryogenic temperatures by gas deposition on a cold silicon window. We developed a method to quantify the broadband THz-IR optical constants of ices, based on the direct reconstruction of the complex refractive index of ices in the THz range from the TDS data and the use of the Kramers-Kronig relation in the IR range for the reconstruction from the FTIR data. Uncertainties introduced by the Kramers-Kronig relations were eliminated by merging the THz and IR spectra. Finally, the reconstructed THz-IR response was analyzed using classical models of complex dielectric permittivity.
Results. The complex refractive index of CO and CO2 ices deposited at the temperature of 28 K was obtained in the range of 0.312.0 THz and fitted using the analytical Lorentz model. Based on the measured dielectric constants, opacities of the astrophysical dust with CO and CO2 icy mantles were computed.
Conclusions. The method developed in this work can be used for a model-independent reconstructions of optical constants of various astrophysical ice analogs in a broad THz-IR range. Such data can provide important benchmarks for interpreting broadband observations from existing and future ground-based facilities and space telescopes. The reported results will be useful in modeling sources that exhibit a drastic molecular freeze-out, such as the central regions of prestellar cores and mid-planes of protoplanetary disks, as well as CO and CO2 snow lines in disks.
Key words: astrochemistry / methods: laboratory: solid state / ISM: molecules / techniques: spectroscopic / infrared: ISM
Both authors contributed equally to this work.
© A. A. Gavdush et al. 2022
 Open Access article, published by EDP Sciences, under the terms of the Creative Commons Attribution License (https://creativecommons.org/licenses/by/4.0), which permits unrestricted use, distribution, and reproduction in any medium, provided the original work is properly cited.
This article is published in open access under the Subscribe-to-Open model.
This Open access funding provided by Max Planck Society.
1 Introduction
The chemical and physical characterization of molecular clouds and protoplanetary disks where star and planet formation takes place remains a challenging problem in modern astrophysics. The interplay between gas phase and icy mantles that form on the surface of dust grains can significantly affect the physical and chemical properties. In particular, catastrophic molecular freeze-out, occurring at the center of pre-stellar cores (e.g., Caselli et al. 1999, 2022; Pineda et al. 2022) and also in the mid-plane of protoplanetary disks (Dutrey et al. 1998; van Dishoeck 2014; Boogert et al. 2015; Oberg & Bergin 2021, and references therein), implies that most species heavier than He reside on dust grains in these regions. In these conditions, thick icy mantles grow around dust grains, altering dust opacities and thus the thermal balance (e.g., Keto & Caselli 2010; Hocuk et al. 2017; Oka et al. 2011), as well as profoundly affecting dust coagulation processes (Chokshi et al. 1993; Dominik & Tielens 1997). Variations in dust opacities must also be taken into account when measuring masses from observations of the millimeter and sub-millimeter dust continuum emission.
The interpretation of observational data in the millimeter-and THz ranges by the Atacama Large Millimeter / submillimeter Array (ALMA) and Northern Extended Millimeter Array (NOEMA) facilities relies on the analysis of measured dust continuum emission (e.g., Widicus Weaver 2019; Jørgensen et al. 2020). However, this analysis requires the knowledge of the dust opacity, which depends on different factors, such as the grain size distribution, chemical composition, and presence of ice mantles. The latter factor may critically affect characteristics of the dust opacity.
Unfortunately, the available experimental data on the broadband complex dielectric permittivity (or optical constants) of ices are quite limited. The continuum emission measurements are typically analyzed by using model opacity values (Ossenkopf et al. 1992; Ossenkopf & Henning 1994), while most of the available experimental data provide optical constants of ices in the visible and mid-IR ranges (Hudgins et al. 1993; Ehrenfreund et al. 1997; Baratta & Palumbo 1998; Loeffler et al. 2005; Dartois 2006; Palumbo et al. 2006; Warren & Brandt 2008; Mastrapa et al. 2009).
Far-IR spectroscopy of pure molecular ices and their mixtures has been performed thus far with the aim of measuring the IR-active lattice vibrations of amorphous and crystalline phases of astrophysical ice analogues (Anderson & Leroi 1966; Ron & Schnepp 1967; Moore & Hudson 1992, 1994), without deriving their optical constants. The band strengths have been investigated using Fourier-transform IR (FTIR) spectroscopy (Giuliano et al. 2014, 2016). Also, the THz optical constants of astrophysical ice analogs have been explored in experiments, demonstrating the ability of spectroscopy in this frequency range to provide important information on the lattice structure, large-scale structural changes, and thermal history of ices (Allodi et al. 2014; Ioppolo et al. 2014; McGuire et al. 2016; Mifsud et al. 2021).
Recently, Giuliano et al. (2019) developed a new approach for quantitative model-independent measurements of the THz complex dielectric permittivity of ices grown at cryogenic conditions. These authors used the THz time-domain spectroscopy (TDS) in the transmission mode, which provides detection of both the amplitude and phase of the THz signal, obtained in a single rapid measurement. In contrast to FTIR spectroscopy, TDS enables a reconstruction of the complex dielectric response of a given ice sample directly from the measured data, without using the Kramers-Kronig relations or employing additional assumptions (Giuliano et al. 2019; Ulitko et al. 2020; Komandin et al. 2022). The developed method was applied by Giuliano et al. (2019) to quantify the dielectric response of CO ice in the 0.3–2.0 THz range. The obtained results demonstrate a good agreement with the available data on the refractive index of CO ice in the mid-IR spectral range.
While independent THz and IR measurements of astro-physical ice analogs are well known from the literature, their broadband (THz–IR) characterization still remains challenging. In this paper, we extend the spectral range of quantification of the complex dielectric permittivity by merging TDS and FTIR data. For this purpose, we combined the TDS and the FTIR spectrometers to the same cryogenic setup used to grow the ice analogs under identical conditions (see Sect. 2). Then we applied a newly developed algorithm, which allowed us to reconstruct the complex dielectric permittivity of an ice sample in the range of 0.3–12.0 THz, thus considerably extending the frequency range analyzed in Giuliano et al. (2019). This algorithm ensures efficient elimination of well-known uncertainties associated with the Kramers-Kronig relations, as discussed in Sect. 3. We used the developed method to study the optical constants of CO and CO2 ices at 11 K. The relevance of the obtained data to the astrophysical applications is highlighted by calculating opacity of the astrophysical dust covered with thick CO and CO2 ice mantles. The results are presented in Sect. 4. Our findings can now be applied for interpretation of astronomical observations in the THz–IR range.
2 Experimental procedure
The experimental data were acquired at the CASICE laboratory developed at the Center for Astrochemical Studies located at the Max Planck Institute for Extraterrestrial Physics in Garching (Germany). In this work, we combine two different instruments of the laboratory, namely, a TDS spectrometer and a FTIR spectrometer, to obtain broadband optical constants of CO and CO2 ices.
The experimental procedure, including details of the TDS instrument, was previously discussed in our first publication, that is, in Giuliano et al. (2019), while details of the FTIR instrument can be found in Müller et al. (2018). In this section, we briefly summarize the main points of the experimental setup and its operation, with an emphasis on the ice sample preparation for the TDS and FTIR measurements.
2.1 The experimental chamber
The design of the TDS and FTIR instruments allows us to use the same vacuum chamber for growing the ice samples and therefore we can switch between the two beams. As a result, the ice samples used for TDS and FTIR measurements have reproducible properties (for given deposition conditions), which makes it possible to merge THz and IR data and thus to obtain broadband optical constants for ices.
The vacuum chamber is mounted on a motor-controlled translation stage, which ensures the tuning of the cryostat position with respect to the THz beam and also allows us to move the chamber and perform measurements with the FTIR spectrometer. The chamber has a diameter of 15 cm, and can be hosted in the sample compartment of both spectrometers. It is equipped with a high-power closed-cycle cryocooler (Advanced Research Systems). A sketch of the vacuum chamber and the optical arrangement of the TDS and FTIR beams are shown in Fig. 1.
The minimum measured temperature that can be reached at the sample holder in normal operation mode is 5 K. For this set of experiments, a special configuration has been chosen in order to provide homogeneous deposition of ice on the cold substrate: the radiation shield. To this end, the radiation shield was removed from the sample holder and thus the minimum achievable temperature was 11 K. The pumping station, composed of a turbomolecular pump combined with a backing rotary pump, sets a base pressure of about 10−7 mbar when cold. The degree of water contamination in our setup was estimated from previous dedicated test experiments, showing the formation of water ice on top of the cold substrate at a rate between 20 and 60 monolayers per hour.
The optical windows and the substrate chosen for the measurements in the THz−IR range are made of high-resistivity float-zone silicon (HRFZ-Si). This material has a high refractive index of nSi ≈ 3.4, with negligible dispersion and good transparency in the desired frequency range. The silicon substrate is placed in the middle of the vacuum chamber and is mechanically and thermally connected to the cryostat.
2.2 TDS and FTIR spectrometers
The experimental setup includes a TDS system (BATOP TDS–1008), with a customized sample compartment to allocate the cryocooler during the THz measurements. The TDS beam is generated by two photoconductive antennas, which constitute the emitter and detector of the THz pulse, triggered by a femtosecond laser (TOPTICA). The TDS features a broadband spectrum spanning the range of up to 0.05–3.5 THz, the spectral maximum at ≈1.0 THz, and the spectral resolution down to ≈0.03 THz. The TDS housing is kept under purging with cold nitrogen gas during the entire experiment, to mitigate the absorption features due to the presence of atmospheric water in the THz beam path.
The transmission IR spectra of the ices were recorded using a high-resolution Bruker IFS 120/5HR FTIR spectrometer. We chose a resolution of 1 cm−1 and 64 scans taken per spectrum. To select the wavelength range in the FIR and mid-IR, we worked with a Mylar Multilayer beam splitter, a FIR-Hg source and a FIR-DTGS detector. The sample compartment of our FTIR system was kept under vacuum, with a customized flange to accommodate the cryocooler vacuum chamber during the measurements.
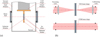 |
Fig. 1 Sketch of the experimental setup, showing the optical system, the vacuum chamber and cryocooler arrangement. (a) Bottom part of the vacuum chamber, showing the cold finger with the sample holder and ice films on it. (b) Optical paths of the TDS and FTIR beams through the ice samples. Panel a is adapted from Giuliano et al. (2019). |
2.3 The experimental protocol
To prepare ices, we used a standard procedure, keeping the same experimental conditions for both TDS and FTIR measurements. The CO or CO2 gas is introduced into the cryocooler vacuum chamber through a 6-mm-diameter stainless steel pipe, with a given gas flux controlled by a metering valve. The gas expands inside the chamber and condensates onto the cold substrate, forming ice films on both sides of the substrate.
In Sect. 3, we demonstrate that a reliable reconstruction of the broadband THz-IR optical constants requires ice layer thicknesses of (at least) a few tenths of mm. To grow such a thick ice within a reasonable time, we chose fast deposition conditions, in which a considerable amount of gas is allowed in the chamber where the pressure was kept at ≈ 10−3 mbar during the deposition. For both instruments, we collected a series of ice spectra after each step of 3 min-long deposition.
In order to grow ice samples with good optical properties at the desired thickness (see Giuliano et al. 2019, for details), the gas inlet was custom-designed. The inlet pipe was kept at a distance of ≈7 cm from the substrate. With this configuration, we can expect to deposit ice layers of high uniformity on both sides of the substrate.
The temperature of cold substrate before the deposition is kept at 11 K. However, during the deposition, the temperature increases due to gas condensation onto the substrate, leading to the surface heating rate becoming too high to be efficiently compensated by the cooling system. The maximum temperature in the end of each deposition step is ≈28 K. The system is allowed to thermally equilibrate between the deposition steps, until the substrate temperature returns to 11 K.
Before starting the ice deposition, the TDS and FTIR transmission spectra of bare substrate were collected. These reference spectra were thus used for deriving the optical constants of ice samples, as discussed below.
3 TDS and FTIR data processing
At the first step, we applied an apodization procedure (window filtering) to all measured TDS waveforms and FTIR interferograms. A Tukey window (Tukey et al. 1986) was used for the TDS data, as described in Giuliano et al. (2019). For the FTIR data, a fourth-order Blackman-Harris window was employed (Harris 1978), in order to filter out the side maxima of the interferogram while maintaining a spectral resolution of ≈1 cm−1.
Different principles underlying the TDS and FTIR spec-troscopy imply different qualities of physically relevant information contained in their signals. In particular, TDS detects the time-dependent amplitude of electric field E (t), from which the frequency-domain complex amplitude  is calculated via the Fourier transform, thus providing both the amplitude and phase information. As shown in Giuliano et al. (2019), this method enables a direct reconstruction of the complex dielectric permittivity of ice samples in the THz range as well as an accurate assessment of their thickness. On the other hand, FTIR spec-troscopy generates time-domain interferograms I (t), related (via the Fourier transform) to the power spectrum
  (Griffiths & de Haseth 1986). The latter contains only the amplitude information and, thus, the complex dielectric permittivity cannot be directly reconstructed.
Characteristic reference and sample spectra, measured with the TDS and FTIR systems for CO ices of different thicknesses (proportional to the deposition time), are depicted in Fig. 2. We notice a broad overlap of the TDS and FTIR data at frequencies near 2.0 THz. The sample spectra show significant evolution with the deposition time, revealing absorption features at different frequencies. We also plot the sensitivity curves for the TDS and FTIR measurements, represented by the respective frequency-dependent standard deviations σ (ν) which were estimated from the variability of TDS and FTIR reference spectra:
 (1)
(1)
 (2)
(2)
are the mean reference spectra of TDS and FTIR systems, respectively, calculated from N independent reference signals (measured for different experiments). To facilitate further analysis, the sensitivity curves are fitted by the power-law dependence σ (ν) = Ava, with A = 0.002 ± 10−3, a = 0.60 ± 10−2 for the TDS system, and A = 0.04 ± 10−3, a = 0.39 ± 10−2 for the FTIR system.
The collected reference and sample signals allow us to compute the transmission coefficients of ices. TDS data yield the complex transmission coefficient (by field):
 (3)
(3)
while FTIR data provide only its amplitude,
 (4)
(4)
At the next step, we have to merge these transmission spectra, that is: (i) the FTIR phase must be reconstructed and (ii) the TDS and FTIR amplitudes and phases must be matched.
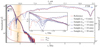 |
Fig. 2 Reference spectrum and sample spectra (by field) of CO ice films, measured by the TDS and FTIR systems at different deposition steps (and normalized to the maximum of the respective reference spectrum for convenience). The gray shading toward the lower frequencies shows the spectral range where diffraction distortions of the THz beam at the sample aperture are expected to become significant, as discussed by Giuliano et al. (2019). The orange shading indicates qualitatively the spectral range of the TDS and FTIR data overlap used for their merging (see Sect. 3.1). The sensitivity of the TDS and FTIR measurements is characterized by the standard deviation of the respective instrumental noise, σTDS and σFTIR (see text for details). |
3.1 Merging TDS and FTIR data
The merging of the THz and the IR transmission amplitude and reconstruction of the broadband (THz-IR) phase were carried out independently. From Fig. 3a, we notice that the TDS (green crosses) and FTIR (blue circles) transmission amplitudes occur to be almost identical in the spectral range where the data overlap. The broadband transmission amplitude  is calculated using a weighted superposition of the TDS and FTIR data in the overlapping range, based on frequency-dependent signal-to-noise ratios for both systems. We tried different methods to merge the data, based on different ways to account for contributions of the THz and IR spectra in the resultant curve: in particular, a linear weighting of data in a varying range of frequencies (within the overlapping range) was tested. All these methods lead to practically indistinguishable results. Calculation of the merged transmission amplitude |T (ν)| is illustrated in Figs. 3a and b for a CO ice sample.
In principle, the missing IR phase can be reconstructed from the amplitude of FTIR transmission. The logarithmic representation of a complex transmission coefficient is
 (5)
(5)
As a response function of a physical system, the real part ln |T (v)| and the imaginary part φ (ν) of this logarithmic transmission are connected via the Kramers-Kronig relations (the Gilbert transform, see Martin 1967; Lucas et al. 2012). However, the resulting phase function φK−K (ν) is determined with some uncertainty (Lucas et al. 2012). This uncertainty can be corrected by writing the relation between the desired (ν) and the calculated φK−K (ν) phases in the following form:
 (6)
(6)
where φ0 and φ1 are constants. We note that φκ-κ (ν) reproduces the shape of a desired phase, that originates from both the material dispersion and the interference effects, while the correction term φ0 + φ1 ν requires an additional explanation. When the Kramers-Kronig relations is used to retrieve the real part n of the complex refractive index  (based on the measured imaginary part), it leads to uncertainty, which can be presented as n + C. By applying it to retrieve the phase of the complex transmission coefficient
  , this yields φκ-κ ≈ −ί2πν (n + C – 1) l/c0, where l is the total ice thickness and c0 ≈ 3 × 10⁸ ms−1 is the speed of light in free space. This results in the correction term φ1ν in Eq. (6). Furthermore, since the actual phase at low frequencies, inaccessible for measurements, is unknown, a constant phase shift φ0 must be added as well. Figures 3c and d illustrate the procedure of calculating the broadband phase φ(ν) for a CO ice sample. The constants φο^ are computed from least-squares method for Eq. (6) and a discrete set of measured TDS phases in the overlapping range. The broadband phase is then obtained by merging φρτκ (ν) and φTDS (ν), in a similar manner as described above for the amplitudes.
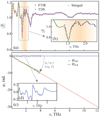 |
Fig. 3 Merging procedure of the TDS and FTIR data, illustrated for CO ice after 12-min deposition. (a) Amplitude of the transmission coefficient |

3.2 Reconstruction of the broadband dielectric response
The broadband transmission amplitude |T(ν)| and phase φ(ν) were then applied for the reconstruction of thicknesses and complex dielectric permittivity of ice layers in the frequency range of 0.3–12.0 THz, as described by Giuliano et al. (2019). The complex dielectric permittivity of ices  , with its real ɛ′ and imaginary ɛ″ parts, is estimated via the minimization of an error functional, which quantifies a discrepancy between the measured complex transmission coefficient
  and that coming from the theoretical model. As discussed in detail by Giuliano et al. (2019), our theoretical model of the interaction of electromagnetic waves with ice samples is generic and, therefore, it is conceptually applicable both for the THz and IR frequencies. Certain parameters of the model must be tuned for the IR range, including the apodization filter size and the number of considered satellite pulses. We recall here that the satellite pulses, which are pronounced in the TDS data, allow us to accurately determine the thicknesses of ice layers (see Fig. 4 in Giuliano et al. 2019). However, the satellites occur to be suppressed in FTIR data, which may be attributed to an enhanced surface scattering (as compared to the THz wavelengths) as well as to the applied Blackman-Harris FTIR interferogram apodiza-tion, reducing the signal at larger delays (as compared to the Tukey apodization of the TDS waveforms).
In Sect. 4, we express the complex dielectric response of ices in terms of the complex refractive index (optical constants):  , where n and α are the refractive index and the absorption coefficient (by field), respectively.
3.3 Modeling the broadband dielectric response
The resonance dipole excitations, underlying the broadband dielectric response of ices, are modeled by applying methods of dielectric spectroscopy. Instead of the Gaussian bands, commonly used to fit the absorption peaks of astrophysical ices (e.g., Boogert et al. 2015), we employed a physically motivated superposition of NL Lorentz kernels:
 (7)
(7)
where Δεj is an amplitude, vL,j is a resonance frequency, and γL,j is a damping constant of the ;th Lorentz term, whereas ɛ∞ is the (real) dielectric permittivity at high frequencies (well above the analyzed spectral range). The magnitude Δεj of each Lorentz oscillator regulates its contribution to the resultant complex dielectric function, while the resonance frequency vL,j and damping constant γL,j define its spectral position and bandwidth.
The reason for choosing the multi-peak Lorentz model of Eq. (7) is twofold: (i) it simultaneously describes the real and imaginary parts of the complex dielectric permittivity Τ with a minimum number of physical parameters and (ii) it obeys both the sum rule (Martin 1967; Komandin et al. 2022) and the Kramers-Kronig relations (Martin 1967; Lucas et al. 2012). The latter is a necessary requirement for self-consistent models of the permittivity function; we note that models based on Gaussian fitting of the absorption peaks fail to address this requirement.
To fit the experimental dielectric curves with Eq. (7), we set the number NL of the resonant lines detected in the ice absorption spectrum. Then, the peak positions of these lines were estimated as a first approximation for the resonance frequencies vL,j. Finally, the measured dielectric curves are fitted with the model, using the nonlinear solver based on an interior point algorithm (Byrd et al. 1999).
3.4 Calculation of the detectable absorption values
Along with strong resonant spectral features, astrophysical ice analogs may exhibit some relatively small frequency-dependent absorption of α ~ 1 cm−1 between the peaks (Giuliano et al. 2019), which appears to be close to the sensitivity limit of our setup. To quantify detectable values of α (ν) for the TDS and FTIR systems, we first introduce the respective 3σ detection limits δΤ (ν) for the sample transmission drop:
 (8)
(8)
By using the Bouguer-Beer-Lambert law for a rough approximation of the detection limit, δΤ (ν) ≈ 1 − exp (−δα (ν) l), and applying the Taylor expansion, we obtain the corresponding 3σ detection limits δα (ν) for the absorption coefficient:
 (9)
(9)
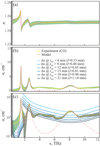 |
Fig. 4 Broadband THz–IR optical constants of the CO ice versus the frequency, ν, deduced from measurements of ice films of different thicknesses. The yellow solid lines show the mean values and the green shaded zones are the ± 1.5σ (87%) confidence intervals of the measurements, while the red solid lines represent the dielectric permittivity model (see Eq. (7) and Table 1). (a) Refractive index n; (b, c) absorption coefficient α (by field), plotted in the linear and logarithmic scales, respectively. In (c), the blue-shaded solid lines show 3σ detection limits of absorption, δα, estimated from Eq. (9) for different ice thicknesses l. The uncertainty of l (~0.01 mm, see text for details) is practically independent of the thickness. |
4 Results
4.1 Broadband dielectric response of CO and CO2 ices
The described approach was applied to study the optical constants of CO and CO2 ices, deposited at a temperature of 28 K. The observed results are shown in Figs. 4 and 5. By analyzing the dielectric response of ices at different deposition steps and, thus, different thicknesses of ice layers, the average optical constants and their standard deviations (± 1.5σ or 87%) were estimated, as shown in the figures by the yellow solid lines and green shaded areas, respectively. The obtained THz-IR response was modeled by Eq. (7), with the resulting parameters summarized in Table 1. The blue-shaded lines in Figs. 4c and 5c show the 3σ detection limit δα, calculated for different ice thicknesses l from Eq. (9). The accuracy of in situ ice thickness measurements can be roughly estimated (see, e.g., Mittleman et al. 1997; Zaytsev et al. 2013) as ~10% of the shortest wavelengths contributing to the detectable TDS spectrum (~100 μm, see Fig. 2), which yields the uncertainty of ~0.01 mm.
Figures 4 and 5 show the presence of several pronounced spectral resonances in the THz–IR range, whose absorption magnitude is much higher than the detection limit evaluated for thicker ices. For the CO ice, we notice three Lorentz-like absorption peaks (γL) and four absorption peaks for the CO2 ice. All the parameters derived from the dielectric permittivity model are summarized in Table 1.
The lower-frequency peaks of CO (1 .51 and 2.59 THz) and CO2 (2.04 and 3.50 THz) ices are well known from the literature (Anderson & Leroi 1966; Ron & Schnepp 1967; Allodi et al. 2014; Boogert et al. 2015; Giuliano et al. 2019), while the weaker peaks at higher frequencies (8.11 THz for CO; 7.16 and 8.88 THz for CO2) have not been reported so far (to the best of our knowledge).
The intense low-frequency peaks (1 .51 and 2.59 THz of CO ice; 2.04 and 3.50 THz of CO2 ice) are attributed to the inter-molecular vibrational modes of CO and CO2 lattices, somewhat broadened in disordered ices. On the other hand, the peaks seen at higher frequencies (8.11 THz of CO ice; 7.16 and 8.88 THz of CO2 ice) are substantially broader. They may originate from an amorphous or polycrystalline ice structure, representing the so-called Boson peaks (Buchenau et al. 1991; Götze & Mayr 2000; Lunkenheimer et al. 2000; Gurevich et al. 2003). Indeed, an increase in the anharmonic contribution (in excess to the potential energy of a crystal) leads not only to the broadening of the vibrational resonances, but also to an increase in dielectric losses in a wide frequency range. The latter includes the formation of additional broad spectral features, commonly observed in fully or partially disordered media and referred to as the Boson peaks (Lunkenheimer & Loidl 2003; Dyre & Schrøder 2000; Elliott et al. 1974; Schlömann 1964).
To verify the discussed nature of the broader high-frequency peaks, we performed additional experiments with annealing of CO and CO2 ices, aiming to increase the ice order. For this purpose, CO ice was deposited for 18 min at the baseline temperature of 28 K and then annealed at temperatures of 30, 35, and 40 K for 15 min; CO2 ice was deposited for 6 min at the baseline temperature of 28 K and then annealed at 50, 70, and 90 K for 15 min. The observed FTIR transmission spectra  of these ices are plotted in Fig. 6. A clear indication that the ice order increases with the annealing temperature is a visible deepening of the vibrational absorption features of CO and CO2 ices at lower frequencies. We see that the high-frequency spectral feature of the CO ice, which remains practically unchanged at 30 K, completely disappears from the transmission spectrum at 35 K, where the ice is expected to be nearly fully crystalline (He et al. 2021). This strongly supports our hypothesis that the high-frequency feature reflects amorphous or polycrystalline structure of the ice at the lower temperatures. At the same time, we point out that increasing the temperature further to reach 40 K leads to a substantial overall reduction of the transmission at higher frequencies. For the CO2 ice, the overall reduction is already seen at the lowest annealing temperature of 50 K (where the ice is expected to become polycrystalline, see Mifsud et al. 2022; Kouchi et al. 2021; He & Vidali 2018) and, therefore, the possible complete disappearance of the two broad peaks between 70 K and 90 K is obscured. This overall reduction in
  is observed to occur at higher temperatures and is more pronounced at higher frequencies. Therefore, a likely reason behind this phenomenon is an increasing contribution of the light scattering, which is induced by growing surface roughness as the annealing temperature approaches the desorption temperature of ice (see Millán et al. 2019).
Another important characteristics of the obtained results is the actual magnitude of absorption between the resonance peaks. From Figs. 4b and c we see that the measured absorption coefficient of CO ice between the vibrational peak at 2.59 THz and the Boson peak at 8.11 THz (as well as to the right from the Boson peak) is much higher than the value predicted by the simple model of dielectric permittivity (red dashed curves). Since the measured α exceeds the minimal detectable absorption δα (derived from the FTIR data for thicker ices; see Eq. (9)), such an enhanced absorption outside the resonance peaks may have a physical origin. It can be generally attributed to changes in the structure and geometry of ice samples, leading to the formation of broad Boson peaks and collective excitations between the spectral resonances or inducing the light scattering on ice pores. On the other hand, we cannot exclude the possibility that for low-absorbing analytes (such as CO ice), this excess in α may also be due to possible systematic errors of the FTIR measurements and imperfections of the developed data processing methods.
Thus, while it is difficult to quantify the actual magnitude of α(v) between the resonance peaks for CO ices, we can be confident that it falls between the measured values (represented by the green shaded line) and the model curve (dashed red line). It is noteworthy that for CO2 ices (see Fig. 5), characterized by higher absorption of the resonance peaks, the modeled and measured α practically coincide between peaks.
Undoubtedly, further dedicated analysis of the CO absorption between the resonance peaks is needed. To adequately quantify small values of α in this case, eliminate any non-physical distortions from the reference and sample FTIR data, and properly analyze the underlying dipole excitations of ices, we should either focus on studies of substantially thicker ice sample (Mishima et al. 1983) or improve the experimental sensitivity of the FTIR system. We postpone this work for future studies.
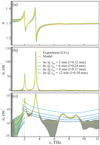 |
Fig. 5 Broadband THz-IR optical constants of the CO2 ice versus the frequency, ν, deduced from measurements of ice films of different thicknesses with the same approach used in Fig. 4. The yellow solid lines show the mean values and the green shaded zones are the ±1.5σ (87%) confidence intervals of the measurements, while the red solid lines represent the dielectric permittivity model (see Eq. (7) and Table 1). (a) Refractive index n; (b, c) absorption coefficient α (by field), plotted in the linear and logarithmic scales, respectively. In (c), the blue-shaded solid lines show 3σ detection limits of absorption, δα, estimated from Eq. (9) for different ice thicknesses l. |
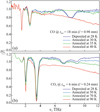 |
Fig. 6 Amplitude of the complex transmission coefficient |T (ν)| of grown and annealed ices. (a) CO ice deposited at 28 K during tdep = 18 min (l = 0.98 mm), and annealed at the temperatures of 30, 35, 40 K. (b) CO2 ice deposited at the baseline temperature of 28 K during tdep = 6 min (l = 0.24 mm), and annealed at the temperatures of 50, 70, 90 K. |
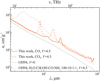 |
Fig. 7 Calculated and reference opacities of astrophysical dust, plotted as a function of the wavelength. Dotted lines labeled with OH94 refer to bare grains as well as to grains with icy mantles by Ossenkopf & Henning (1994). Opacities for grains with pure CO and CO2 icy mantles, computed for optical constants of the present work, are depicted by the solid and dashed lines, respectively. The label “V” denotes the volume ratio of the icy mantles to the refractory material, indicating bare grains (V = 0, black) and grains with thick mantles (V = 4.5, red). |
4.2 Opacities of dust grains with CO and CO2 ice mantles
In Fig. 7, we present the opacity κ which is computed for the optical constants of CO and CO2 ices. For direct comparison with available opacity data, results from Ossenkopf & Henning (1994) are also included. The opacity is derived by following the procedure described in Sect. 4 and Appendix C of Giuliano et al. (2019), the data for the optical constants from our work and the code to calculate the opacity can be found in the online repository1. The dotted lines in Fig. 7 refer to the values of Ossenkopf & Henning (1994) for bare grains (black) and for grains covered with thick icy mantles which are composed of water and contain small fractions of other volatile species, H2O:CH3OH:CO:NH3 = 100:10:1:1 (red). The labels V = 0 and 4.5 indicate the volume ratio of the ice mantles to the refractory material of grains2. The opacity of grains with thick mantles of pure CO and CO2 ices are plotted with the solid and dashed lines, respectively.
A broad absorption feature seen between ≃30 and ≃200 μm in the opacity curve by Ossenkopf & Henning (1994, dotted line) represents lattice vibrations of the water ice and, therefore, is not present in the pure CO or CO2 ice data. The CO opacity curve (solid line) shows two strong features near 1.5 and 2.6 THz (200 and 115 μm), corresponding to the strong absorption peaks in Fig. 4, while the contribution of a weaker Boson peak at about 8.1 THz cannot be seen. A very similar behavior is observed for the CO2 opacity curve (dashed line), clearly showing the signature of two strong absorption peaks in Fig. 5. At the wavelengths above 200 μm, none of the curves show absorption features and we see a good agreement between different models. Characteristic opacity values at selected wavelengths are given in Table 2.
A volume ratio of V = 4.5 is a reasonable assumption for thick astrophysical ices composed of several components, such as the ice mixture analyzed by Ossenkopf & Henning (1994). In order to facilitate a comparison, we keep this value also for the opacity curves representing pure CO and CO2 ices, but the detectability of their bands will vary according to the actual abundance of the molecules3. The opacity model of pure ices is particularly relevant for regions of the interstellar medium where CO and CO2 molecules are expected to be concentrated in the outer layers of the icy mantle, for instance, outside the respective snow lines in protoplanetary disks, in the mid-planes of protoplanetary disks, or in the center of prestellar cores.
Opacity κ (in units of cm2 g−1 ) calculated at selected wavelengths for CO2 and CO ices with a volume ratio of V = 4.5.
5 Conclusion
In this work, we have developed and implemented a new experimental method for quantitative characterization of complex dielectric permittivity of astrophysical ice analogs in a broad THz-IR spectral range. By performing a joint processing of TDS and FTIR spectroscopic data, we derived optical constants of CO and CO2 ice layers in an extended frequency range of 0.3−12.0 THz, and analyzed the results theoretically using a multiple Lorentzian model.
The extended spectroscopic data of CO and CO2 ices demonstrate the presence of broad absorption features near 8 THz, which have not been characterized before to the best of our knowledge. By studying the dielectric response of ices after annealing at different temperatures, we conclude that such bands can be attributed to Boson peaks – prominent signatures of disorder in amorphous or polycrystalline media.
Based on the measured broadband THz–IR dielectric response of CO and CO2 ices, we estimated and analyzed the opacity of astrophysical dust covered with thick icy mantles of the same molecular composition. These measurements are necessary to provide a better interpretation of dust continuum observations in star- and planet-forming regions, where catastrophic CO freeze-out occurs (in pre-stellar cores and in protoplanetary disk mid-planes) and at the CO and CO2 snow lines of protoplanetary disks.
Acknowledgements
We gratefully acknowledge the support of the Max Planck Society. This project has received funding from the European Union’s Horizon 2020 research and innovation program under the Marie Sklodowska-Curie grant agreement # 811312 for the Project “Astro-Chemical Origins” (ACO). TDS and FTIR data processing by A.A.G. was supported by the RSF Project # 22-72-00092. The authors thank the referee, S. Ioppolo, for providing insightful and constructive comments and suggestions.
References
- Allodi, M., Ioppolo, S., Kelley, M., McGuire, B., & Blake, G. 2014, Phys. Chem. Chem. Phys., 16, 3442 [NASA ADS] [CrossRef] [Google Scholar]
- Anderson, A., & Leroi, G. 1966, J. Chem. Phys., 45, 4359 [NASA ADS] [CrossRef] [Google Scholar]
- Baratta, G., & Palumbo, M. 1998, J. Opt. Soc. Am. A, 15, 3076 [NASA ADS] [CrossRef] [Google Scholar]
- Boogert, A. C. A., Gerakines, P. A., & Whittet, D. C. B. 2015, ARA&A, 53, 541 [Google Scholar]
- Buchenau, U., Galperin, Y., Gurevich, V., & Schober, H. 1991, Phys. Rev. B, 43, 5039 [NASA ADS] [CrossRef] [Google Scholar]
- Byrd, R., Hribar, M., & Nocedal, J. 1999, SIAM J. Optimiz., 9, 877 [CrossRef] [Google Scholar]
- Caselli, P., Walmsley, C. M., Tafalla, M., Dore, L., & Myers, P. C. 1999, ApJ, 523, L165 [Google Scholar]
- Caselli, P., Pineda, J. E., Sipilä, O., et al. 2022, ApJ, 929, 13 [NASA ADS] [CrossRef] [Google Scholar]
- Chokshi, A., Tielens, A. G. G. M., & Hollenbach, D. 1993, ApJ, 407, 806 [Google Scholar]
- Dartois, E. 2006, A&A, 445, 959 [NASA ADS] [CrossRef] [EDP Sciences] [Google Scholar]
- Dominik, C., & Tielens, A. G. G. M. 1997, ApJ, 480, 647 [Google Scholar]
- Dutrey, A., Guilloteau, S., Ménard, F., et al. 1998, A&A, 338, L63 [NASA ADS] [Google Scholar]
- Dyre, J., & Schrøder, T. 2000, Rev. Mod. Phys., 72, 873 [NASA ADS] [CrossRef] [Google Scholar]
- Ehrenfreund, P., Boogert, A., Gerakines, P., Tielens, A., & van Dishoeck, E. 1997, A&A, 328, 649 [NASA ADS] [Google Scholar]
- Elliott, R., Krumhansl, J., & Leath, P. 1974, Rev. Mod. Phys., 46, 465 [NASA ADS] [CrossRef] [Google Scholar]
- Giuliano, B., Escribano, R., Martin-Domenech, R., Dartois, E., & Muñoz Caro, G. 2014, A&A, 565, A108 [NASA ADS] [CrossRef] [EDP Sciences] [Google Scholar]
- Giuliano, B., Martin-Domenech, R., Escribano, R., Manzano-Santamaria, J., & Munoz Caro, G. 2016, A&A, 592, A81 [NASA ADS] [CrossRef] [EDP Sciences] [Google Scholar]
- Giuliano, B., Gavdush, A., Müller, B., et al. 2019, A&A, 629, A112 [NASA ADS] [CrossRef] [EDP Sciences] [Google Scholar]
- Götze, W., & Mayr, M. 2000, Phys. Rev. E, 61, 587 [CrossRef] [Google Scholar]
- Griffiths, P., & de Haseth, J. 1986, Fourier Transform Infrared Spectroscopy (New York, NY, USA: John Wiley & Sons) [Google Scholar]
- Gurevich, V., Parshin, D., & Schober, H. 2003, Phys. Rev. B, 67, 094203 [NASA ADS] [CrossRef] [Google Scholar]
- Harris, F. 1978, Proc. IEEE, 66, 51 [NASA ADS] [CrossRef] [Google Scholar]
- He, J., & Vidali, G. 2018, MNRAS, 473, 860 [NASA ADS] [CrossRef] [Google Scholar]
- He, J., Toriello, F. E., Emtiaz, S. M., Henning, T., & Vidali, G. 2021, ApJ, 915, L23 [NASA ADS] [CrossRef] [Google Scholar]
- Hocuk, S., Szucs, L., Caselli, P., et al. 2017, A&A, 604, A58 [NASA ADS] [CrossRef] [EDP Sciences] [Google Scholar]
- Hudgins, D., Sandford, S., Allamandola, L., & Tielens, A. 1993, ApJ, 86, 713 [NASA ADS] [Google Scholar]
- Ioppolo, S., McGuire, B., Allodi, M., & Blake, G. 2014, Faraday Discuss., 168, 461 [NASA ADS] [CrossRef] [Google Scholar]
- Jørgensen, J., Belloche, A., & Garrod, R. 2020, ARA&A, 58, 727 [CrossRef] [Google Scholar]
- Keto, E., & Caselli, P. 2010, MNRAS, 402, 1625 [Google Scholar]
- Komandin, G., Zaytsev, K., Dolganova, I., et al. 2022, Opt. Exp., 30, 9208 [NASA ADS] [CrossRef] [Google Scholar]
- Kouchi, A., Tsuge, M., Hama, T., et al. 2021, ApJ, 918, 45 [NASA ADS] [CrossRef] [Google Scholar]
- Loeffler, M., Baratta, G., Palumbo, M., Strazzulla, G., & Baragiola, R. 2005, A&A, 435, 587 [NASA ADS] [CrossRef] [EDP Sciences] [Google Scholar]
- Lucas, J., Geron, E., Ditchi, T., & Hole, S. 2012, AIP Adv., 2, 032144 [NASA ADS] [CrossRef] [Google Scholar]
- Lunkenheimer, P., & Loidl, A. 2003, Phys. Rev. Lett., 91, 207601 [NASA ADS] [CrossRef] [Google Scholar]
- Lunkenheimer, P., Schneider, U., Brand, R., & Loid, A. 2000, Contem. Phys., 41, 15 [NASA ADS] [CrossRef] [Google Scholar]
- Martin, P. 1967, Phys. Rev., 161, 143 [NASA ADS] [CrossRef] [Google Scholar]
- Mastrapa, R., Sandford, S., Roush, T., Cruikshank, D., & Dalle Ore, C. 2009, ApJ, 701, 1347 [NASA ADS] [CrossRef] [Google Scholar]
- McGuire, B., Ioppolo, S., Allodi, M., & Blake, G. 2016, Phys. Chem. Chem. Phys., 18, 20199 [NASA ADS] [CrossRef] [Google Scholar]
- Mifsud, D., Hailey, P., Traspas Muiña, A., et al. 2021, Front. Astron. Space Sci., 8, 757619 [CrossRef] [Google Scholar]
- Mifsud, D. V., Kaňuchová, Z., Ioppolo, S., et al. 2022, J. Mol. Spectr., 385, 111599 [NASA ADS] [CrossRef] [Google Scholar]
- Millán, C., Santonja, C., Domingo, M., Luna, R., & Satorre, M. 2019, A&A, 628, A63 [NASA ADS] [CrossRef] [EDP Sciences] [Google Scholar]
- Mishima, O., Klug, D., & Whalley, E. 1983, J. Chem. Phys., 78, 6399 [NASA ADS] [CrossRef] [Google Scholar]
- Mittleman, D., Hunsche, S., Boivin, L., & Nuss, M. 1997, Opt. Lett., 22, 904 [NASA ADS] [CrossRef] [Google Scholar]
- Moore, M. H., & Hudson, R. L. 1992, ApJ, 401, 353 [NASA ADS] [CrossRef] [Google Scholar]
- Moore, M. H., & Hudson, R. 1994, A&A, 103, 45 [NASA ADS] [Google Scholar]
- Müller, B., Giuliano, B. M., Bizzocchi, L., Vasyunin, A. I., & Caselli, P. 2018, A&A, 620, A46 [NASA ADS] [CrossRef] [EDP Sciences] [Google Scholar]
- Öberg, K. I., & Bergin, E. A. 2021, Phys. Rep., 893, 1 [Google Scholar]
- Oka, A., Nakamoto, T., & Ida, S. 2011, ApJ, 738, 141 [Google Scholar]
- Ossenkopf, V., & Henning, T. 1994, A&A, 291, 943 [NASA ADS] [Google Scholar]
- Ossenkopf, V., Henning, T., & Mathis, J. S. 1992, A&A, 261, 567 [NASA ADS] [Google Scholar]
- Palumbo, M., Baratta, G., Collings, M., & McCoustra, M. 2006, Phys. Chem. Chem. Phys., 8, 279 [NASA ADS] [CrossRef] [Google Scholar]
- Pineda, J. E., Harju, J., Caselli, P., et al. 2022, AJ, 163, 294 [NASA ADS] [CrossRef] [Google Scholar]
- Ron, A., & Schnepp, O. 1967, J. Chem. Phys., 46, 3991 [NASA ADS] [CrossRef] [Google Scholar]
- Schlömann, E. 1964, Phys. Rev., 135, A413 [CrossRef] [Google Scholar]
- Tukey, J., Cleveland, W., & Brillinger, D. 1986, The Collected Works of John W. Tukey, Wadsworth Advanced Books & Software, 1st edn. (Berlin: Springer), 1, 194 [Google Scholar]
- Ulitko, V., Zotov, A., Gavdush, A., et al. 2020, Opt. Materials Exp., 10, 2100 [NASA ADS] [CrossRef] [Google Scholar]
- van Dishoeck, E. 2014, Faraday Discuss., 168, 9 [NASA ADS] [CrossRef] [Google Scholar]
- Warren, S., & Brandt, R. 2008, J. Geophys. Res. Atmos., 113, D14220 [NASA ADS] [CrossRef] [Google Scholar]
- Widicus Weaver, S. 2019, ARA&A, 57, 79 [NASA ADS] [CrossRef] [Google Scholar]
- Zaytsev, K., Karasik, V., Fokina, I., & Alekhnovich, V. 2013, Opt. Eng., 52, 068203 [NASA ADS] [CrossRef] [Google Scholar]
https://bitbucket.org/tgrassi/compute_qabs, the project version for this paper is commit: 36317b2. Figure 7 can be produced by running test_06.py. Data can be found in data/eps_CO.dat and data/eps_CO2.dat files.
The volume ratio V is related to the ice thickness Δα and the grain radius α via V = (1 + Δa/a)3 − 1.
We emphasize that the volume ratio is a free parameter in our opacity code that can be easily changed in accordance with the context of a problem.
All Tables
Opacity κ (in units of cm2 g−1 ) calculated at selected wavelengths for CO2 and CO ices with a volume ratio of V = 4.5.
All Figures
|
Fig. 1 Sketch of the experimental setup, showing the optical system, the vacuum chamber and cryocooler arrangement. (a) Bottom part of the vacuum chamber, showing the cold finger with the sample holder and ice films on it. (b) Optical paths of the TDS and FTIR beams through the ice samples. Panel a is adapted from Giuliano et al. (2019). |
| In the text | |
|
Fig. 2 Reference spectrum and sample spectra (by field) of CO ice films, measured by the TDS and FTIR systems at different deposition steps (and normalized to the maximum of the respective reference spectrum for convenience). The gray shading toward the lower frequencies shows the spectral range where diffraction distortions of the THz beam at the sample aperture are expected to become significant, as discussed by Giuliano et al. (2019). The orange shading indicates qualitatively the spectral range of the TDS and FTIR data overlap used for their merging (see Sect. 3.1). The sensitivity of the TDS and FTIR measurements is characterized by the standard deviation of the respective instrumental noise, σTDS and σFTIR (see text for details). |
| In the text | |
|
Fig. 3 Merging procedure of the TDS and FTIR data, illustrated for CO ice after 12-min deposition. (a) Amplitude of the transmission coefficient |
| In the text | |
|
Fig. 4 Broadband THz–IR optical constants of the CO ice versus the frequency, ν, deduced from measurements of ice films of different thicknesses. The yellow solid lines show the mean values and the green shaded zones are the ± 1.5σ (87%) confidence intervals of the measurements, while the red solid lines represent the dielectric permittivity model (see Eq. (7) and Table 1). (a) Refractive index n; (b, c) absorption coefficient α (by field), plotted in the linear and logarithmic scales, respectively. In (c), the blue-shaded solid lines show 3σ detection limits of absorption, δα, estimated from Eq. (9) for different ice thicknesses l. The uncertainty of l (~0.01 mm, see text for details) is practically independent of the thickness. |
| In the text | |
|
Fig. 5 Broadband THz-IR optical constants of the CO2 ice versus the frequency, ν, deduced from measurements of ice films of different thicknesses with the same approach used in Fig. 4. The yellow solid lines show the mean values and the green shaded zones are the ±1.5σ (87%) confidence intervals of the measurements, while the red solid lines represent the dielectric permittivity model (see Eq. (7) and Table 1). (a) Refractive index n; (b, c) absorption coefficient α (by field), plotted in the linear and logarithmic scales, respectively. In (c), the blue-shaded solid lines show 3σ detection limits of absorption, δα, estimated from Eq. (9) for different ice thicknesses l. |
| In the text | |
|
Fig. 6 Amplitude of the complex transmission coefficient |T (ν)| of grown and annealed ices. (a) CO ice deposited at 28 K during tdep = 18 min (l = 0.98 mm), and annealed at the temperatures of 30, 35, 40 K. (b) CO2 ice deposited at the baseline temperature of 28 K during tdep = 6 min (l = 0.24 mm), and annealed at the temperatures of 50, 70, 90 K. |
| In the text | |
|
Fig. 7 Calculated and reference opacities of astrophysical dust, plotted as a function of the wavelength. Dotted lines labeled with OH94 refer to bare grains as well as to grains with icy mantles by Ossenkopf & Henning (1994). Opacities for grains with pure CO and CO2 icy mantles, computed for optical constants of the present work, are depicted by the solid and dashed lines, respectively. The label “V” denotes the volume ratio of the icy mantles to the refractory material, indicating bare grains (V = 0, black) and grains with thick mantles (V = 4.5, red). |
| In the text | |
Current usage metrics show cumulative count of Article Views (full-text article views including HTML views, PDF and ePub downloads, according to the available data) and Abstracts Views on Vision4Press platform.
Data correspond to usage on the plateform after 2015. The current usage metrics is available 48-96 hours after online publication and is updated daily on week days.
Initial download of the metrics may take a while.