Fig. 5
Download original image
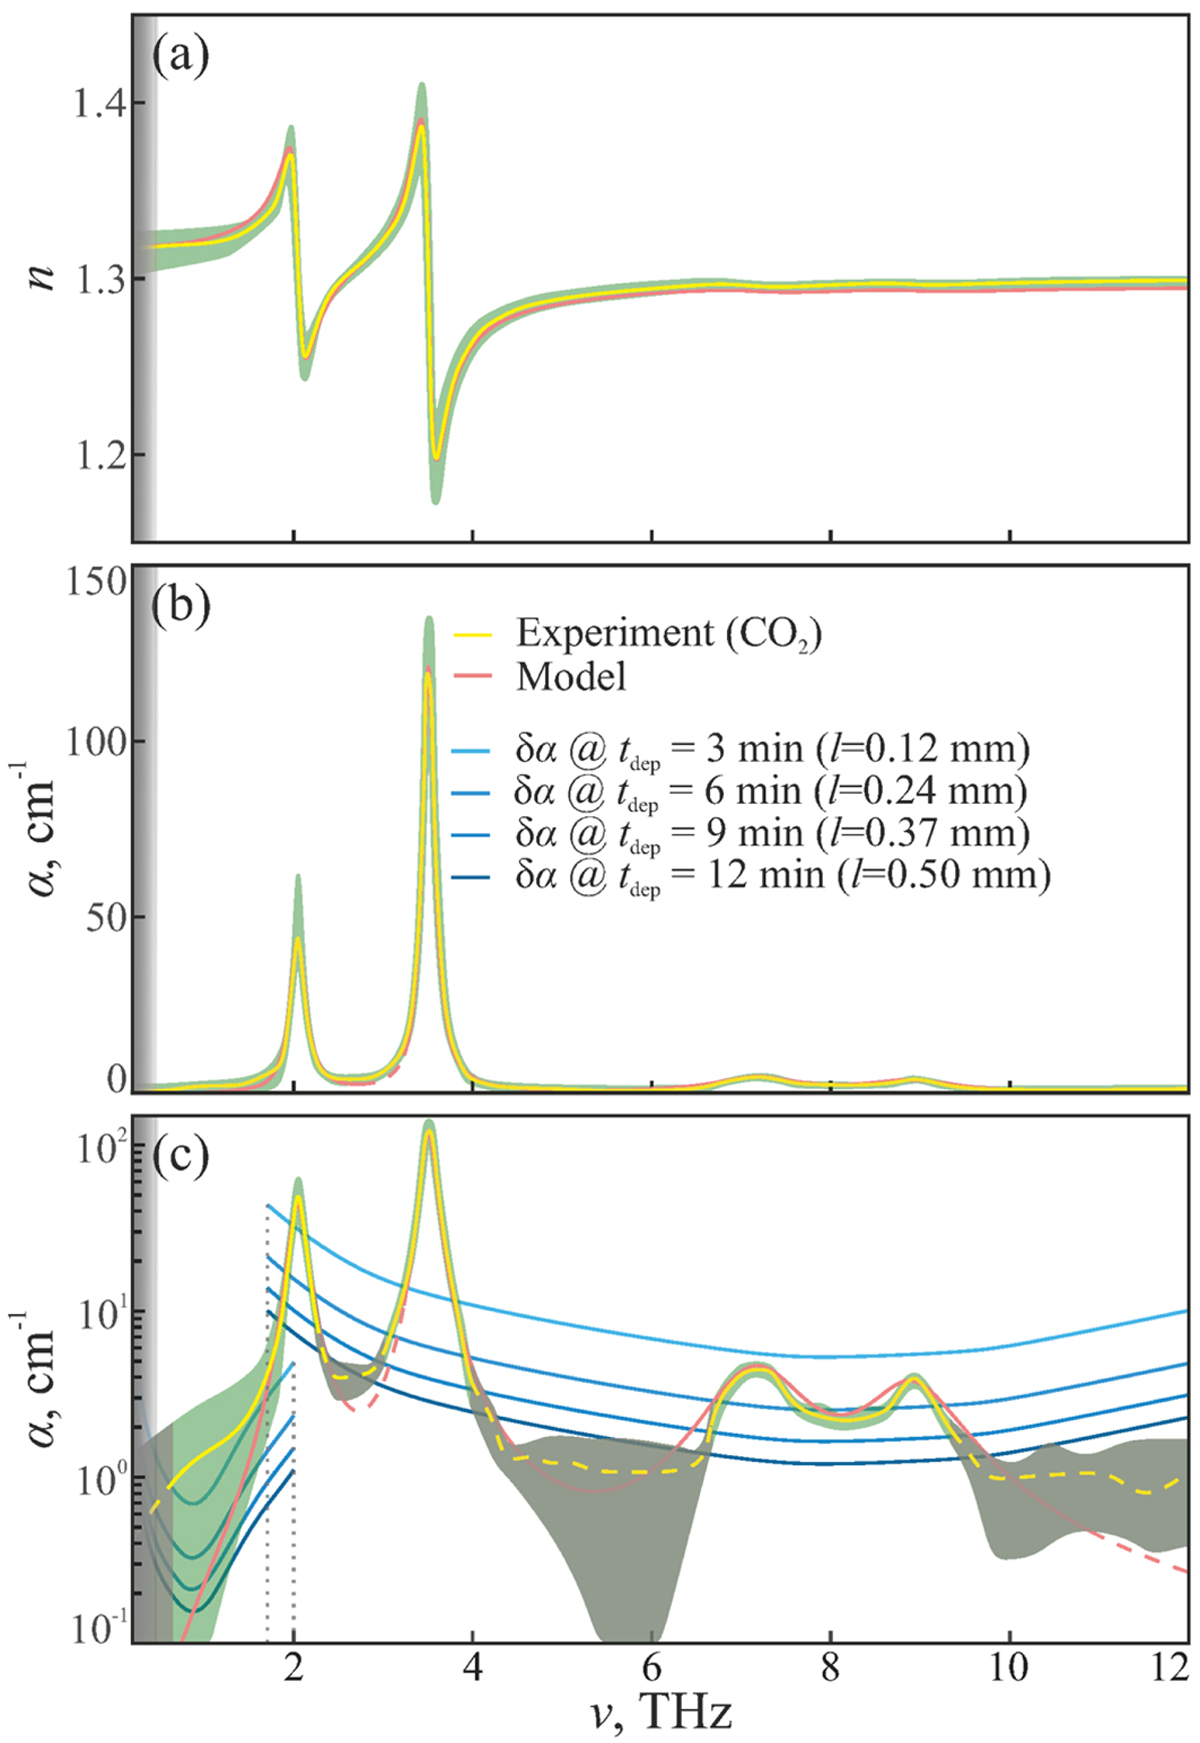
Broadband THz-IR optical constants of the CO2 ice versus the frequency, ν, deduced from measurements of ice films of different thicknesses with the same approach used in Fig. 4. The yellow solid lines show the mean values and the green shaded zones are the ±1.5σ (87%) confidence intervals of the measurements, while the red solid lines represent the dielectric permittivity model (see Eq. (7) and Table 1). (a) Refractive index n; (b, c) absorption coefficient α (by field), plotted in the linear and logarithmic scales, respectively. In (c), the blue-shaded solid lines show 3σ detection limits of absorption, δα, estimated from Eq. (9) for different ice thicknesses l.
Current usage metrics show cumulative count of Article Views (full-text article views including HTML views, PDF and ePub downloads, according to the available data) and Abstracts Views on Vision4Press platform.
Data correspond to usage on the plateform after 2015. The current usage metrics is available 48-96 hours after online publication and is updated daily on week days.
Initial download of the metrics may take a while.