Fig. 3
Download original image
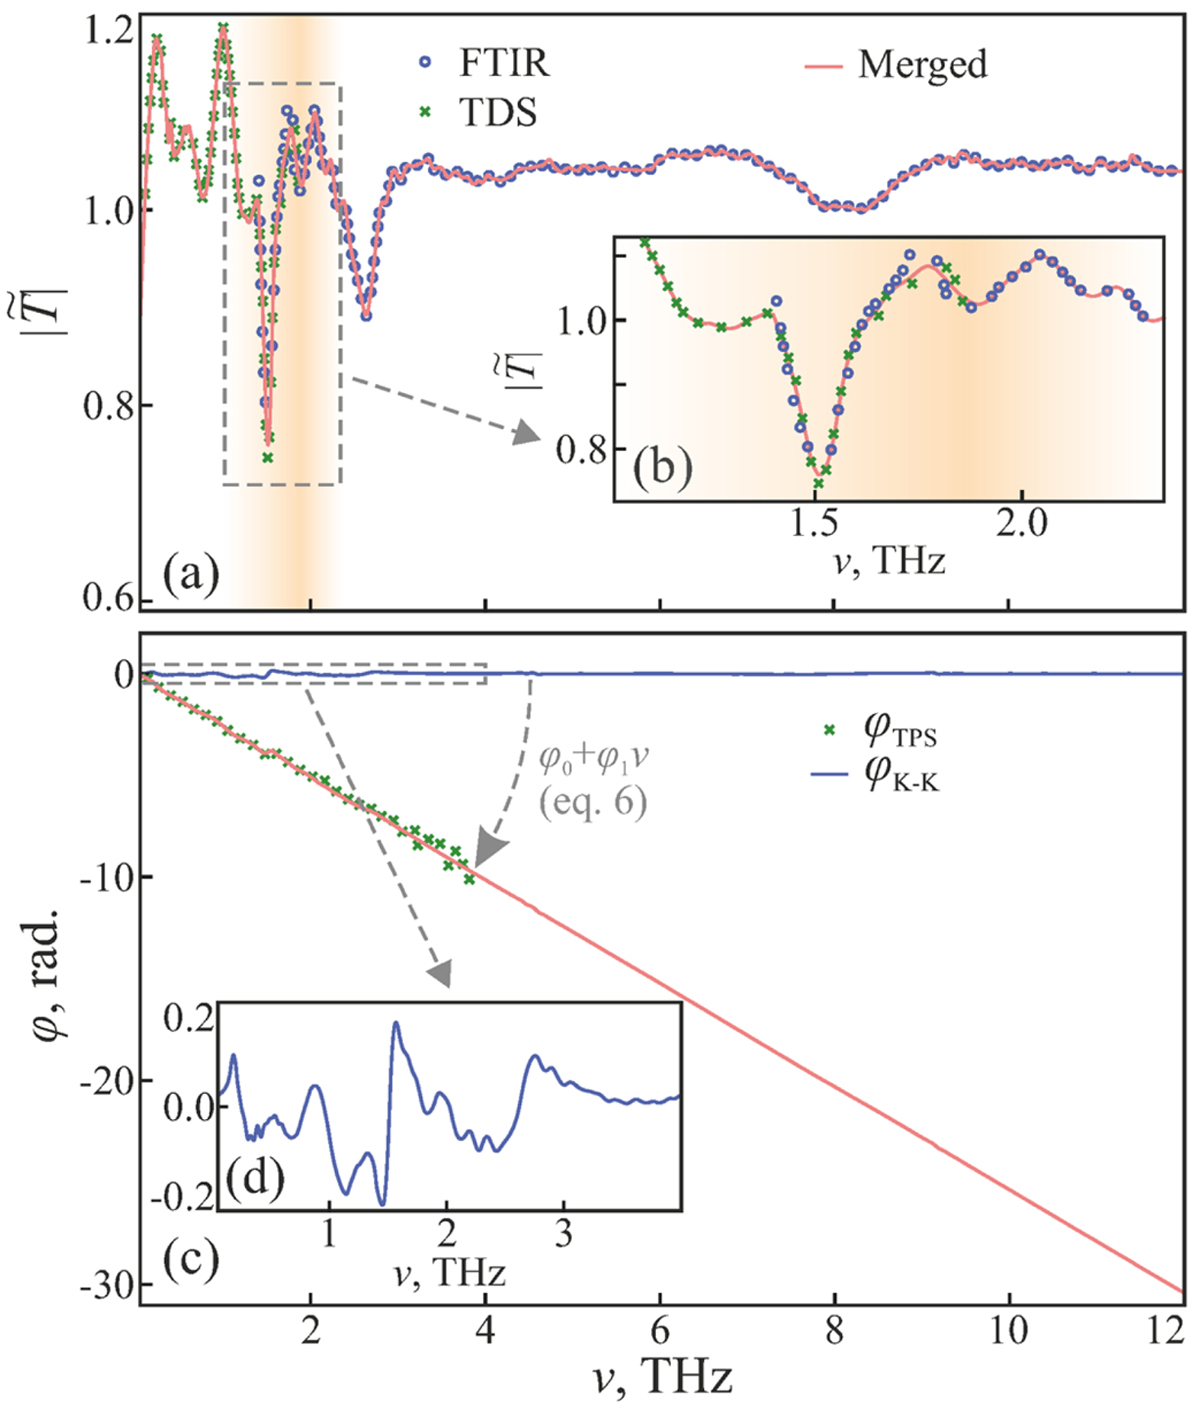
Merging procedure of the TDS and FTIR data, illustrated for CO ice after 12-min deposition. (a) Amplitude of the transmission coefficient ![]() from TDS measurements (green crosses) and FTIR measurements (blue circles) as well as the resulting merged curve (red solid line, see Sect. 3.1 for details). (b) Zoom-in on the overlapping range of the TDS and FTIR data. (c) Phase φ(ν) of the complex transmission coefficient, where the TDS data, the Kramers-Kronig phase (blue solid line) with the linear correction (see Eq. (6)), and the resulting broadband phase (red solid line) are plotted. (d) Low-frequency behavior of the Kramers-Kronig phase.
from TDS measurements (green crosses) and FTIR measurements (blue circles) as well as the resulting merged curve (red solid line, see Sect. 3.1 for details). (b) Zoom-in on the overlapping range of the TDS and FTIR data. (c) Phase φ(ν) of the complex transmission coefficient, where the TDS data, the Kramers-Kronig phase (blue solid line) with the linear correction (see Eq. (6)), and the resulting broadband phase (red solid line) are plotted. (d) Low-frequency behavior of the Kramers-Kronig phase.
Current usage metrics show cumulative count of Article Views (full-text article views including HTML views, PDF and ePub downloads, according to the available data) and Abstracts Views on Vision4Press platform.
Data correspond to usage on the plateform after 2015. The current usage metrics is available 48-96 hours after online publication and is updated daily on week days.
Initial download of the metrics may take a while.