Fig. 2
Download original image
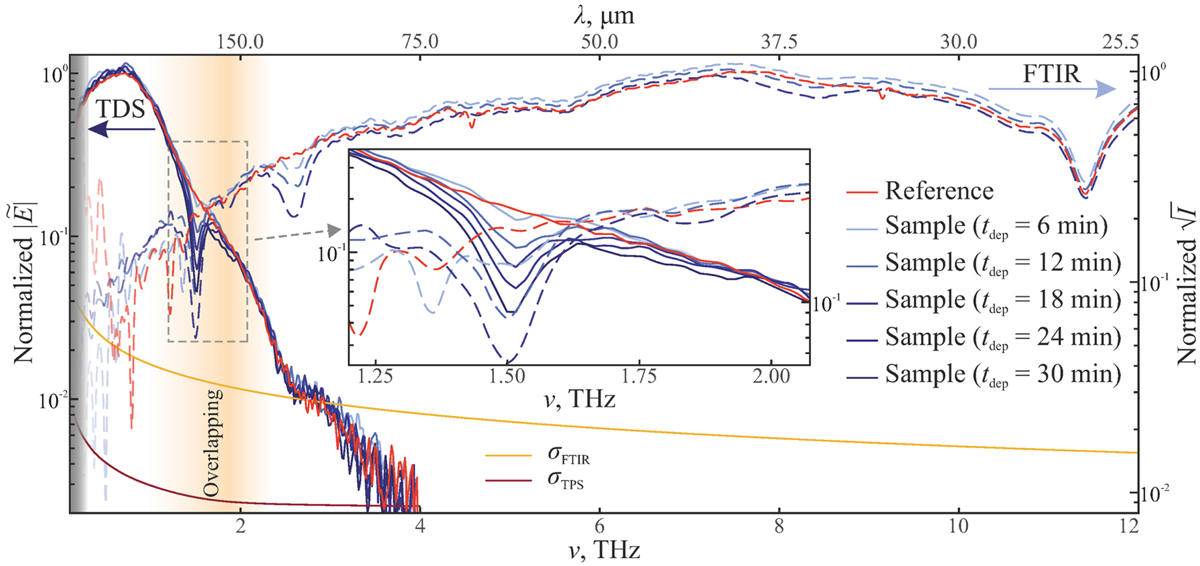
Reference spectrum and sample spectra (by field) of CO ice films, measured by the TDS and FTIR systems at different deposition steps (and normalized to the maximum of the respective reference spectrum for convenience). The gray shading toward the lower frequencies shows the spectral range where diffraction distortions of the THz beam at the sample aperture are expected to become significant, as discussed by Giuliano et al. (2019). The orange shading indicates qualitatively the spectral range of the TDS and FTIR data overlap used for their merging (see Sect. 3.1). The sensitivity of the TDS and FTIR measurements is characterized by the standard deviation of the respective instrumental noise, σTDS and σFTIR (see text for details).
Current usage metrics show cumulative count of Article Views (full-text article views including HTML views, PDF and ePub downloads, according to the available data) and Abstracts Views on Vision4Press platform.
Data correspond to usage on the plateform after 2015. The current usage metrics is available 48-96 hours after online publication and is updated daily on week days.
Initial download of the metrics may take a while.