| Issue |
A&A
Volume 666, October 2022
|
|
|---|---|---|
| Article Number | A96 | |
| Number of page(s) | 11 | |
| Section | Interstellar and circumstellar matter | |
| DOI | https://doi.org/10.1051/0004-6361/202244381 | |
| Published online | 20 October 2022 | |
Stellar population in the vicinity of the H ii region G331.03-00.15
1
Instituto de Astronomía y Física del Espacio, CONICET–UBA,
CC 67, Suc. 28,
C1428ZAA
Buenos Aires, Argentina
e-mail: This email address is being protected from spambots. You need JavaScript enabled to view it.
2
Facultad de Ciencias Astronómicas y Geofísicas, UNLP,
Paseo del Bosque S/N,
B1900FWA
La Plata, Argentina
3
Instituto de Astrofísica de La Plata, CONICET,
Paseo del Bosque S/N,
B1900FWA
La Plata, Argentina
Received:
29
June
2022
Accepted:
24
August
2022
Abstract
We present a multi-wavelength study of the H ii region G331.03-00.15, with the aim of identifying the population of massive stars associated with it. The distributions of ionised gas and heated dust both exhibit similar spherical forms, while the bordering photo-dissociating region follows a very ring-like distribution, indicating the presence of abundant neighbouring molecular material being photo-dissociated. There is only one high-mass star catalogued in the region, namely, the WR star 1051-67L. Based on an energy analysis of the detected radio continuum emission, we deduced that additional high-mass stars could be interacting with G331.03-00.15. We conducted a search of massive star candidates by applying a series of colour criteria to a sample of highly reddened infrared (IR) point sources projected over the radio continuum morphology, with the additional condition that they be located at the same distance assumed for the region. Fourteen candidate sources were selected and classified using low-resolution, near-infrared (NIR) spectroscopic data in the H and K bands, obtained with Gemini/FLAMINGOS-2. We identified one massive star and classified it as an O7 V star. Adding the contribution from this new star to the total ionising radiation available, we concluded that it would be possible for the H ii region to be powered solely by these two massive stars. However, we do not rule out the possibility that there could be more early-type stars that remain undetected in this highly obscured part of the Galaxy. Additionally, we searched for primary tracers of star-forming activity and identified several class I and II candidate young stellar objects (YSOs), positioned over the dense clouds and clumps of molecular material found in the area. The presence of several maser species located in the densest cloud are also indicative of massive star formation taking place in the vicinity of G331.03-00.15.
Key words: H ii regions / stars: massive / stars: individual: WR 1051–67L
e-mail: This email address is being protected from spambots. You need JavaScript enabled to view it.
PhD Fellow of CONICET, Argentina.
© S. B. Cárdenas et al. 2022
 Open Access article, published by EDP Sciences, under the terms of the Creative Commons Attribution License (https://creativecommons.org/licenses/by/4.0), which permits unrestricted use, distribution, and reproduction in any medium, provided the original work is properly cited.
This article is published in open access under the Subscribe-to-Open model. This email address is being protected from spambots. You need JavaScript enabled to view it. to support open access publication.
1 Introduction
Massive stars disturb their environs in an irreversible way due to their strong winds and ionising radiation throughout their evolutionary paths. The morphology, scale, and evolution of the varied structures created by these stars in the interstellar medium (ISM) strongly depend on the number of interacting stars, their spectral types, their evolutionary states, and their location in the Galaxy. In particular, massive stars are responsible for the formation of ionised (H ii) regions due to their highly energetic ultraviolet (UV) photons (Strömgren 1939). Observational studies of these nebular structures provide valuable information for characterising the stars that generated them, since their morphology is influenced by the successive evolutionary stages the star has gone through.
However, interactions between massive stars and the ISM are still subject to numerous open questions, such as the fact that not all O and Wolf-Rayet (WR) type stars have a detected H ii region nearby. In the same way, several analysis of the energy values involved in the formation of these regions show that many high-mass stars seem to be missing or have not been detected (e.g. Cichowolski et al. 2018). On the other side, observational studies have confirmed that massive stars are not usually isolated but are, in fact, members of binary systems or other stellar groups (Roberts 1957; Maíz-Apellániz 2004; Barbá et al. 2017).
In this paper, we present a study of a population of highly reddened massive star candidates, selected using near-infrared (NIR) photometric data and classified via spectroscopic observations, in the vicinity of the H ii region G331.03-00.15, where the WR type star 1051-67L was previously identified by Shara etal. (2012).
2 Data
2.1 Archival data
Near and mid-infrared: Data products from the Spitzer-telescope surveys were used. We retrieved the mid-infrared (MIR) maps from the Galactic Legacy Infrared Midplane Survey Extraordinaire (GLIMPSE; Benjamin et al. 2003) obtained with the Infrared Array Camera (IRAC) at 3.6, 4.5, 5.8, and 8.0 μm, and the 24-μm map observed with the Multiband Imaging Photometer (MIPS) from the MIPS Galactic Plane Survey (MIPSGAL; Carey et al. 2005). The GLIMPSE bands have angular resolutions better than 2″, and the one from MIPSGAL has a resolution of 6″. In addition, we utilised the GLIMPSE (I+II+3D)1 source catalogue (Spitzer Science 2009). We also used the point source catalogue from the VISTA Variables in the Vía Láctea Survey Data Release 2 (VVV DR2; Minniti et al. 2010, 2017), and its associated tile images. The catalogue contains J, H, and Ks single-epoch photometry, while the images corresponding to these three bands have a resolution better than 1″ and a 5σ sensitivity limit <20 mag.
Millimeter and submillimeter: We analysed the data cubes of 12CO, 13CO and C18O emission in the 109−115 GHz J = 1−0 transitions from the Mopra Carbon Monoxide (CO) Survey of the Southern Galactic Plane – Data Release 3 (Burton et al. 2013; Braiding et al. 2018), whose spatial and spectral resolution are 0′.6 and 0.1 km s−1 respectively. Following the documentation, we converted the antenna temperatures to main-beam brightness temperature using the expression: Tmb = TA/ηXB, and adopting a value of ηXB = 0.55 for the Mopra extended beam efficiency (Ladd et al. 2005). We also made use of the APEX Telescope Large Area Survey of the Galaxy (ATLASGAL; Schuller et al. 2009) data. In this survey, the Large APEX Bolometer Camera (LABOCA) mapped the 870-μm continuum emission in the Southern skies with a beam size of 19″.2 and 1σ sensitivity of 50−70 mJy beam−1.
Radio: We utilised 1420 MHz radio continuum observations from the Southern Galactic Plane Survey (SGPS; McClure-Griffiths et al. 2005; Haverkorn et al. 2006) to study the distribution of ionised gas. The survey covers an area of the sky given by the following ranges of Galactic longitude and latitude: 253° < l < 358° and | b | < 1°.5, and the emission maps have a spatial resolution of 2′.2 and a sensitivity <1 mJy beam−1.
VVV source candidates to be O-type stars.
2.2 Near-infrared observations and reduction of spectra
We requested observing time at Gemini South Observatory to carry out spectroscopic observations with the FLAMINGOS-2 spectrograph (Eikenberry et al. 2004) in the H and K bands, spanning the wavelength range of 1.3−2.5 μm. We were granted 5.3 h of telescope time (Program ID: GS-2021A-Q-318; PI: SBC). We obtained the NIR spectra of fourteen massive-star candidates selected from the catalogue of the VISTA Variables in the Vía Láctea (VVV; Minniti et al. 2010, 2017) Survey DR2 (see Table 1). The selection criteria is explained in detail in Sect. 4.1. As we planned to use the spectra to analyse their morphology, a wide spectral range and low-resolution were suitable. Taking into account the fainter effects of interstellar extinction in the H and K bands, the data were taken in the Band 3 programme given the brightness of our targets, with the following instrumental setup: HK disperser with a resolving power of R = 1200, HK filter, 4-pixel wide slit with a pixel size of 0″.18, and read mode of the detector set to 6.0 e− (suitable for objects of medium brightness, since all our targets have H ~ 12 mag or H < 14 mag). With this configuration, we aimed to obtain, for the science spectra, a signal-to-noise ratio (S/N) ~ 300 and S/N ~ 100 in the H and K bands, respectively, to ensure the combined spectra would satisfy our science requirements.
We set out to observe one pair of targets per observation, amounting to a total of seven observations to obtain fourteen low-resolution science spectra using long-slit spectroscopy. This was possible because the small angular distance between the targets allowed them to be paired and still fit comfortably along the ~4′.4 length of the slit, while verifying that the Ks magnitudes of each pair did not differ by more than 0.5 mag. The observations were done following an ABBA sequence so as to remove sky background. A telluric standard was selected to be observed either before or after each observing block or pair of science targets, with the aim to obtain a S/N ~ 300–400, to be able to subtract the effects of atmospheric absorption from the science spectra with acceptable results. We selected the less bright B9 V star (to avoid saturation), lying nearest to the general direction of the target objects, so as to account for a similar air mass value: HIP78037 (RA(J2000) = 15:56:03.30, Dec(J2000) = −52:56:56.1, Ks=8.6mag).
All the spectra are flat-field corrected, with a prior normalisation of the flat images. To perform the wavelength calibration, we used Argon-lamp arc images. The reduction process was done following most of the steps detailed in the cookbook provided by the Gemini South Observatory for FLAMINGOS-2. All the data were reduced using the GEMINI and F2 packages from the IRAF2 software (Tody 1986, 1993). Both the science and telluric spectra were normalised, and the science targets were subsequently tellurised with the task telluric. Prior to tellurisation, intrinsic absorption lines had to be removed from the telluric standards. For this purpose, we used the splot task to fit Voigt profiles to the Η i lines present in the spectra, which the most recognisable photospheric lines were then subtracted. The observed air wavelengths of atomic hydrogen recombination lines were obtained from the NIST online service (Kramida et al. 2021). Afterwards, all the calibrated science spectra were divided by the corresponding corrected telluric spectra, removing the atmospheric absorption features from the former. To account for differences in air mass values and wavelength calibration during the tellurisation process of the science targets, we took advantage of the properties of the task telluric to apply shifts in wavelength or modifications to the scaling factor in line strength interactively to reduce as many of the telluric features as possible from both NIR bands.
3 WR star 1051-67L and its local medium
3.1 Overview of WR star 1051-67L
WR 1051-67L (l = 331°.07, b = −0°.11), also known as WR 72−4 (Rosslowe & Crowther 2015), was first identified by Shara et al. (2012) as a WC7 ± 2 star using NIR photometric and spectroscopic data, and positioned at an estimated spectro-photometric distance of 6.61 kpc with a typical uncertainty of 25% as reported by the authors. Its NIR magnitudes, obtained from the 2 Micron All Sky Survey (2MASS; Skrutskie & et al. 2006), are J = 14.86 mag, Η = 12.63 mag and Ks = 11.24 mag. Assuming a spectral type of WC7, Crowther (2007) estimates the following physical parameters: mass-loss rate of Ṁ = 10−4.7 M⊙ yr−1, wind terminal velocity of υ∞ = 2200 km s−1, and Lyman continuum photon rate of NLy = 1049.1 ph s−1.
3.2 Description of Η ii region G331.03-00.15
G331.03-00.15 (G331 for short) is located in the fourth quadrant (l = 331°.055, b = −00°.144) near the Galactic plane, where distance ambiguity is present. Wilson et al. (1970) carried out observations of the Η109α radio recombination line (RRL) in the southern skies and detected an emission component at a velocity of VLSR = −89.2 ± 2.2 km s−1 at Galactic coordinates, (l = 331°.0, b = −0°.2), based on which they estimated an electronic temperature Te = 3200 ± 900 Κ and kinematic ‘near’ and ‘far’ distances of 6.6 ± 0.9 kpc and 10.9 ± 0.8 kpc, respectively. Later, in their survey of Η109α and Η110α RRLs, Caswell & Haynes (1987) re-observed this region and measured a Te of 3400 Κ in direction to (l, b) = (331°.026, −0°.152), while remarking on the absence of an optical counterpart. These authors also associated H2CO absorption lines detected at −92.2 and −46.7 km s−1 with G331. Based on 1420 MHz continuum emission and Η i absorption data from the SGPS, McClure-Griffiths et al. (2001) resolved the distance ambiguity for G331 by comparing the recombination line and H i absorption line velocities. Adopting the standard rotation curve used in Fich et al. (1989), they proposed a range of values for the ‘near’ distance of 5.5−5.9 kpc for the region, given the lack of significant absorption features beyond the RRL velocity. Also based on an H i absorption spectrum analysis, Jones & Dickey (2012) reported a distance of  for G331 and locate the Η ii region at the tangent point. Considering the possible association of G331 with WR 1051-67L, since the estimated distance for the latter falls within the error range of the distance value reported by Jones & Dickey (2012), we finally assumed this distance value for the Η ii region, positioning it at the tangent point.
G331.03-00.15 is also conspicuous in the MIR bands. In the WISE catalogue of Galactic Η ii Regions (Anderson et al. 2014), it is identified by WISE name G331.020-00.143 as a ‘known’ H ii region of angular radius 229″. Figure 1 shows the observed emission in three Spitzer bands: 4.5 μm (in blue), 8 μm (in green), and 24 μm (in red). While the 4.5 μm band highlights mainly the stellar emission, the thermal emission from the small grains of dust that is stochastically heated by the ionising photons is seen brightly at 24 μm. The distribution of warm dust follows quite closely the near-spherical morphology observed in the 1420 MHz continuum map (shown in Fig. 2), with the projected positions of the brightest spots in both emission maps also matching, indicating that the dust particles are well-mixed with the ionised gas. The green-coloured 8 μm band maps the emission that originates predominantly from the polycyclic aromatic hydrocarbons (PAHs), which are complex molecules being dissociated by the energetic UV photons coming from the parent star(s). This emission traces the location of the photo-dissociation regions (PDRs), which represent the interface between the ionised material and the neighbouring neutral gas. In Fig. 1, we can clearly distinguish a ring-like PDR surrounding the heated dust located at the interior of the H ii region, its intense green glow indicating the presence of abundant molecular gas in the vicinity of G331 and the WR. The location of the latter can be appreciated in the figure as well; although it is seen lying on the bordering PDR rather than closer to the inner parts of the region, as is generally expected, the same setup has been observed in other structures with their associated parent stars (Arnal 1992; Gervais & St-Louis 1999; Cazzolato & Pineault 2000; Cichowolski et al. 2001).
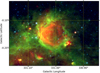 |
Fig. 1 Three-colour composite image of Η ii region G331.03-00.15, where the red, green, and blue colours represent the observed emission at 24, 8, and 4.5 μm, respectively. The light blue star indicates the location of WR 1051-67L. |
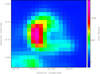 |
Fig. 2 Emission map of the Η ii region G331, at 1420 MHz. The black emission contour corresponds to 0.3 Jy beam−1, and the red circle marks the area in which the search of VVV candidate sources was carried out. The red asterisk shows the position of WR star 1051-67L and the 17 black symbols indicate the location of the VVV candidates. The (x) represent Giant candidates while the (+) symbolise the MS ones. |
3.3 Origin of the H ii region
The presence of WR 1051-67L in the vicinity of G331 given their similar distance values strongly suggests that this massive star could be responsible for the formation of the H ii region.
To investigate whether 1051-67L is the sole contributor of the ionising photons necessary to give birth to this region, we used the 1420 MHz emission map of G331 (see Fig. 2) to measure its flux density at this frequency and obtained a value of S1420 = 2.9 ± 0.4 Jy. From the estimated flux density we inferred the number of UV photons needed to maintain the region ionised, using the following equation given by Chaisson (1976):
 (1)
(1)
Comparing the obtained value, Nuv = (2.1 ± 0.7) × 1049 ph s−1, with the number of photons emitted by a star of spectral type WC7, NLy = 1.26 × 1049 ph s−1 (Crowther 2007), we conclude that the amount of photons from the WR on its own is insufficient. Furthermore, the amount of missing ionising photons would be even larger if either a WC5 or a WC9 star were considered since, according to Crowther (2007), they have NLy = 7.94 × 1048 ph s−1 and NLy = 3.98 × 1048 ph s−1, respectively.
4 Identification of other high-mass stellar sources associated with G331
Taking into account that WR 1051-67L does not emit enough energetic photons to explain the observed amount of ionised gas and the fact that massive stars do not tend to be isolated, lead us to believe that there must be other early-type stars in the area. However, a search for high-mass stars in the Galactic O Star Catalogue (GOSC; Maíz Apellániz et al. 2013) and in the online3 compilation of all known Galactic Wolf-Rayet stars (Rosslowe & Crowther 2015)4 did not bear results. As such, we conducted a search of still-unidentified high-mass stars that could be affecting the region.
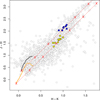 |
Fig. 3 Colour-colour diagram of the 17 VVV candidate sources projected onto the circled region in Fig. 2. O V and O III candidates with 14 mag < Av < 17.5 mag are indicated by yellow and blue circles, respectively. The positions of the de-reddened early-type MS and giant sequence are shown by the orange and black lines, respectively. The reddening vectors for O3 V and M0 III stars are indicated by the dashed red lines, using extinction values from Rieke & Lebofsky (1985), where each red (x) symbol indicates an increase of five magnitudes in the value of Av. |
4.1 Reddened candidate search
The absence of additional massive stars close to G331 could be due to high extinction effects, related either to the large distance involved or the location in the Galaxy – in the Galactic plane and near the Galactic centre – although it could also be attributed to the great amount of molecular material found in the neighbouring area (Nguyen et al. 2015). According to Shara et al. (2012), WR star 1051-67L has an absorption of 1.73 mag in the Ks band which, assuming AK = 0.11 Av (Rieke & Lebofsky 1985), implies a visual absorption of Av = 15.73 mag.
Because of the high visual absorption in the area, we looked in the IR band for possible O stars that could be associated with G331. To select the candidate sources, we made use of the VVV DR2 catalogue of NIR sources. We first identified all the VVV sources located in the area delimited by the red circle shown in Fig. 2. To define the projected spatial region in which we conducted our search we took into consideration the semi-circular morphology of G331 and its curvature, since the form of the observed structure is directly influenced by its ionising star(s).
Inside this area, we found a total of 5544 VVV sources having a class flag = −1 (which corresponds to objects classified as stars). To identify the candidates for main sequence (MS) and giant stars amongst them, we utilised the IR reddening-free pseudo parameter QIR, defined as QIR = (J − H) − 1.83 × (H − Ks) (Comerón et al. 2005), and selected the objects that satisfied the constraint −0.15 < QIR < 0.1, which applies to MS candidates, and QIR > 0.1, for giant candidates. Out of the 5544 VVV sources, there were 1755 and 1505 objects which satisfied each condition, respectively. Figure 3 shows a colour-colour diagram depicting the distribution of the 5544 sources. Since we were looking for massive stars in a region having a high level of visual absorption, we computed the absolute magnitudes for the 3260 candidate sources in the J, H, and Ks bands, adopting a distance of 7440 pc and a range of values for the visual absorption of 14 mag <Αv< 17.5 mag, to account for an uncertainty of 10% in the AK value estimated by Shara et al. (2012). Then, we selected the MS and giant candidates which lay along the reddening vectors in the range of values for Av. We imposed these two conditions because our intent was to find out whether it was possible for any of these VVV sources to have the absolute magnitude of an Ο V or Ο III star, while also being at the same distance of the Η ii region. Afterwards, we compared the estimated absolute magnitudes with the values given in the work of Martins & Plez (2006) to obtain the sources whose IR magnitudes satisfied the conditions of either being an Ο V or Ο III star candidate, at the set distance.
As a last constraint, we checked the catalogue of distances from Gaia Data Release 25 (Gaia DR2; Bailer-Jones et al. 2018b) to look for the distances of these stellar sources derived by Bailer-Jones et al. (2018a) using Gaia data. We discarded the ones whose estimated distance values fell outside the error range of the proposed distance of G331. We found that most objects had no matches and therefore could not have a distance value associated to them, which we attribute to the presence of high extinction in the region as well as the detection limits of Gaia for objects at more than 6 kpc.
Of the 17 sources that fulfilled all the requirements, we selected the final targets based on their projected locations in relation to the morphology of the H ii region. Our selection consisted of 14 VVV sources: six candidates for Ο III stars and eight candidates for Ο V stars. The positions of all candidates are indicated by black symbols in Fig. 2 and by yellow and blue circles in Fig. 3. Their photometric data are summarised in Table 1.
4.2 Spectral classification of candidates
To identify any OB-type star among the candidates, we firstly based our classification on the atlas of normal stars in the K-band of Wallace & Hinkle (1997). In this atlas, it is clear that the presence of conspicuous CO bands are indicative of late-type stars, while absorption lines of Na, Ca, and Mg are useful for discriminating spectral types between A and G. To classify the latest spectra, we applied the criteria presented in Ramirez et al. (1997). In many cases where Brγ was the most notorious feature identified, we also consulted the spectral library and some quantitative parameters from Cesetti et al. (2013), such as the equivalent widths of Brγ and the Ca I doublet at 2.26 μm.
After a careful examination of all spectra, we identified one O-type spectrum, which corresponds to star VVV J161007.73-515003.72. Its classification was done mainly using the medium resolution atlas of Ο and early-B stars (Hanson et al. 2005) and by comparison with the NIR catalogue of early-type stars which is being constructed by one of the authors of this work (RG) and collaborators (see first preliminary releases in Giudici Michilini et al. 2020, 2021). The spectrum in both NIR spectral ranges can be appreciated in Fig. 4, where vertical coloured lines were drawn to highlight key features. Considering the relative intensity of He II and He I absorption lines, the star was determined to be of type 07 V.
Additional stars were observed in the slit, together with each pair of candidates, per observation. We extracted their spectra and were able to classify those whose S/N allowed for recognisable absorption or emission features, adding 12 extra sources to the 14 targeted stars, and amounting to a total of 26 reduced spectra. Discounting the Ο one, their classification ranged from A5 V to K4 III; thus, it is most likely that none of these stellar objects are members of the young region studied in this work. Nevertheless, we provide their identifications in the VVV DR2 catalogue, positions, and spectral classification for further different purposes in Table 2 and show their spectra in Figs. 5 and 6. The projected positions of the 26 classified stars can be seen in Fig. 7.
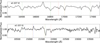 |
Fig. 4 Spectrum of the discovered 07 V star, in the H and K-baηds (top and bottom panels, respectively). Colourised vertical lines indicate Η-lines at 1.6411, 1.6811, 1.7367, and 2.1661 μm (green), He I λλ1.7007, 2.1126, and 2.1614 (orange), He II λλ1.6923 and 2.1891 (red), Ν III λ2.1155 (blue) and C IV λλ2.0706, 2.0802, and 2.0842 (light blue). In the H-band, we also marked an unidentified absorption line at 17235 Å (light blue). |
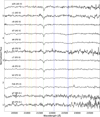 |
Fig. 5 Spectra in the K-baηd range of late-type stars in the field. Colourised vertical lines indicate the Βrγ absorption line (in green), Na I λλ2.2062−2.2090 and Ca I 112.2614−2.2631−2.2657 (in blue), Si I λ2.2657, and 2.1360 (red), Mg I λ2.1066, and 2.2814 (orange), and A1 I λ2.1099, and 2.1170 (yellow). |
VVV identification and spectral classification of the observed targets.
5 Molecular gas and star formation activity in the region
The emission maps of the molecular gas associated with G331 can be seen in Fig. 8. The upper panel shows the CO (1−0) emission, and the lower one corresponds to 13CO(1−0). Both maps were produced integrating the corresponding MOPRA data cubes within the velocity range from about −98 to −86 km s−1. This interval was selected considering the velocity of the RRL detected in the region (see Sect. 3.2) and where molecular emission is noticeable. As can be seen in Fig. 8, the distribution of the molecular gas in the region is not homogeneous. The most intense molecular emission forms an open structure, which is all mounted on a larger, fainter, background cloud of emission. Some separate sub-structures can be distinguished around the cavity formed by the incomplete shell-like molecular complex. We identify three clouds that stand out, subsequently referred to as clouds A, B, and C (as indicated in Fig. 8). If we compare these structures in both molecular maps, it can be appreciated that their positions and morphologies are in somewhat good agreement. On the other hand, their observed sizes are not entirely comparable: all the clouds seem to be smaller in the 13CO map. In both maps, the brightest emission corresponds to cloud C, indicating the highest amount of gas. Cloud A is located the closest to the positions of WR 1051−67L and the O-type star identified in this work, which could explain why it seems to be the smallest in size and displays the lowest emission intensity.
Table 3 summarises the physical parameters we obtained for the three molecular clouds identified in Fig. 8, as derived from the CO and 13CO data. In order to obtain them, we followed the procedures described in Cárdenas et al. (2022). Based on the integrated images shown in Fig. 8, we made use of the software package AIPS (Wells 1985) to obtain the CO and 13CO peak temperatures, Tpeak(CO) and Tpeak(13CO), for each cloud. Using the peak temperature of the optically thick CO emission, we derived the excitation temperature, Texc. Afterwards, the optical depth (τ13) of the optically thin 13CO emission was estimated assuming conditions of local thermodynamic equilibrium (LTE). Using this value, we inferred the 13CO column density, N(13CO). Subsequently, we calculated the H2 column densities,  , adopting an abundance of Y[13CO] = 5.0 × 10⁵ (Dickman 1978). Finally, with the estimations of
  , the total hydrogen mass of each molecular cloud,
  , and their volume densities,
  , were calculated. For this last step, we associated the surfaces of the clouds with the sizes of spherical clouds of the same surface, estimated an equivalent radius, and thus assumed spherical geometries.
In Fig. 10, the distribution of the 8 μm emission is shown together with the CO molecular emission indicated by black contour levels. The molecular gas shows an excellent morphological correspondence with the IR emission. Since the 8 μm emission traces the position of the PDR, this is evidence that the molecular gas is being photo dissociated by a stellar source (or sources, see Sect. 3.3) located nearby.
Although there are (at least) two massive stars (the WR and the O-type star) disturbing the region, there is still plenty of molecular gas. This is likely due to the fact that the whole area is immersed in a vast, dense, molecular complex, as reported by Nguyen et al. (2015). Furthermore, as expected from the theory (e.g. Dudorov & Khaibrakhmanov 2017), the molecular clouds depicted in Fig. 8 seem to have a hierarchical internal structure, with several clumps inside. This is especially notorious from the blue contours shown in Fig. 10. These trace the 870 μm emission from the ATLASGAL survey, which is characteristic of the dense, cold gas. A greater number of clumps is indicative of a higher amount of dense material from which a new generation of stars could be formed (Lada et al. 2010). Inside the densest cloud, cloud C, there is a large ATLASGAL clump whose position coincides with the location of several molecular masers. Hydroxyl (OH), methanol (CH3OH) and H2O maser emission at multiple transitions were detected by various authors (Caswell et al. 1980, 2010, 2011; Batchelor et al. 1980; Caswell 2009), some of which are essentially coincident in position. To illustrate their proximity, in Fig. 10, we show the 1665 and 1667-MHz OH transitions (Caswell et al. 2010, 1980) at l = 330°.96 and b = −0°.18, in the velocity range from −102 to −80 km s−1, the 6668-MHz CH3ΟΗ emission (Caswell et al. 2011; Caswell 2009), found at l = 330°.953 and b = −0° 182 in the velocity range from −90.5 to −87.5 km s−1, and the 22-GHz H2O maser (Batchelor et al. 1980) at l = 330°.95 and b = −0°.19, whose most prominent velocity feature corresponds to a velocity of −90 km s−1. All maser species were thus detected at radial velocities matching the velocity range of the CO emission, in addition to their spatial coincidence with the cold ATLASGAL clump.
Moreover, an inspection of the C18O data cube from the MOPRA survey shows strong emission from this molecule, detected in this dense part of cloud C, close to the maser spots. The C18O emission profile is presented in Fig. 9. All of this makes the interior of this cloud a suitable place for studying stellar formation.
Considering the high amounts of dust and dense molecular gas in the area, we retrieved the infrared point sources from the Spitzer/GLIMPSΕ I+II+3D catalogue to search for young stellar object candidates (cYSOs). First, we defined the projected spatial region where we would carry out the search. Taking into account the morphology and size of the region, we centred our search in the coordinates of G331 and retrieved the objects within a radius of 0° 1. This step led us to a total of 4403 GLIMPSE sources. In order to select the cYSOs, we implemented the steps of the Phase I described in the work of Gutermuth et al. (2009). The method consists of several steps that make use of the four magnitudes detected in the different IRAC bands (3.6, 4.5, 5.8, and 8.0 μm) to create and apply a series of colour-based criteria to the IR point sources. These steps are aimed at filtering out any possible contaminant objects that also present some IR excess. After applying the filters, we looked for the cYSOs among the remaining sources. The final product consists of a list of cYSOs identified and classified into class I and class II candidates, according to the colour criteria of the method. The class I candidates are still deeply embedded sources, characterised by their MIR emission excess stemming from warm dusty envelopes; while class II candidates are more evolved objects which show a decrease in their MIR fluxes as a consequence of their evolution: their envelope has dissipated, but they are still accreting material through a circumstellar disk that is responsible for their spectral energy distribution. In this region, we found a total of ten class I and nine class II YSO candidates. The results of the selection are summarised in Table 4. The last column refers to the emission structure over which each cYSO is seen projected onto, either the PDR or the molecular clouds previously identified as A, B, and C. The candidates marked with a hyphen in this last column do not seem to be associated with any particular structure, but are seen projected over the large background of molecular emission. The spatial distribution of the cYSOs detected is displayed in Fig. 10.
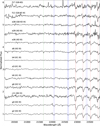 |
Fig. 6 Spectra in the K-band range of late-type stars in the field. Colourised vertical lines indicate the Βrγ absorption line (in green), Na I γγ2.2062−2.2090, and γγ2.3350−2.3390 and Ca I γγ2.2614− 2.2631−2.2657 (in blue), and CO bands at 2.2935, 2.3227, 2.3524, and 2.3830 μm (red). |
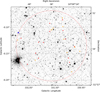 |
Fig. 7 Ks-baηd image of the region in the sky containing G331 and the 26 observed objects, obtained with VISTA/VIRCAM. The candidate search area delimited by the pink circle is the same as the one shown in Fig. 2, and encloses the 14 selected candidates (red dots) and the other observed stellar sources (orange triangles). The blue star marks the position of WR 1051-67L. |
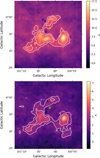 |
Fig. 8 Integrated emission maps from the Mopra survey, showing the three detected molecular structures, identified with capital letters. Top panel: CO emission distribution. White contour values of 8.6 and 9.9 Κ are drawn. Bottom panel: 13CO emission distribution. The white contours correspond to 2 and 2.8 K. Both maps have been integrated along the line of sight, in the velocity interval from −98 km s−1 to −86 km s−1. The blue asterisk indicates the position of the WR star, and the yellow one, the position of the O-type star. |
Physical parameters estimated for the three molecular structures detected in the 12CO and 13CO integrated emission maps.
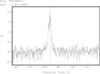 |
Fig. 9 Line profile of the C18O emission averaged over a 4-pixel box that includes the positions of the masers. |
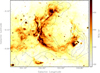 |
Fig. 10 Emission map at 8 μm from the Spitzer/GLIMPSE survey. Black contour levels at 8.6 and 9.9 K correspond to the CO emission. Blue contour levels at 0.5 and 1.5 Jy beam−1 correspond to the ATLASGAL survey at 870 μm, which traces the compact, high-density structures. The green crosses show the spots of molecular masers, while the black and red asterisks show the positions of WR 1051−67 and the O7 V star, respectively. The spatial distribution of cYSOs obtained from the GLIMPSE I+II+3D catalogue is shown with red (class I) and black (class II) crosses. |
6 Discussion
The H ii region G331 is located near the Galactic centre in a part of the Galaxy with copious amounts of gas and dust (described in Sect. 3.2) at a large distance of 7.44 kpc, which allows highly-reddened sources to remain undetected in the visual bands. We confirmed the presence of two massive stars in the vicinity of G331, which are very likely related to it: the WR-type star 1051-65L of spectral type WC7 ± 2, detected by Shara et al. (2012), and the O7 V star found in this work. Both stellar objects were detected using NIR bands and are not found in visual catalogues, including the recently published Gaia EDR3 catalogue of geometric and photogeometric distances (Bailer-Jones et al. 2021), indicating they are greatly obscured by the gas and dust present or lying at a distance that is not reachable by Gaia. In any case, high extinction is evidently in effect, considering the large amounts of molecular material observed and the spectro-photometric distance estimated for the WR.
Considering the fact that we now have two massive stars affecting the H ii region, we can repeat the energy analysis outlined in Sect. 3.3, adding the rate of photons emitted by both stars. Taking into account all the possible spectral types between WC5 and WC9 and assuming an uncertainty of one spectral type for the O7 star, the number of photons obtained would be enough to maintain the region ionised in almost all instances. For those cases in which the WR star is paired with an O8 V star, which provides NLy = 3.16 × 1048 ph s−1 (Crowther 2007), it would only be possible to reach a sufficient amount of photons if the WR companion star were of type WC7, due to it having the highest estimated value of NLy. Because of this last worst-case scenario, there is a chance that more massive stars associated with G331 could remain undetected. However, this analysis also shows that there are many instances in which it would be possible to keep this ionised structure with only the presence of one O-type star and one WR-type star. A high uncertainty on the classification of massive stars and their corresponding ionising fluxes could therefore lead to a set of possible spectral types for the stars interacting with G331. Even though a good estimation can be obtained through the comparison of the number of ionising photons needed by the region and those available from the stars, certain difficulties may still stand in the way when we try to pinpoint whether there are massive stars that are missing or not. Thus, a precise estimation of the spectral classifications of massive stars and their derived physical properties is extremely vital in order to infer as accurately as possible the presence or absence of a greater number of high-mass stars associated with an H ii region. Nevertheless, it must be noted that there is also much uncertainty associated with the ISM. For instance, determining a different border for the H ii region – thus changing its size – can introduce considerable variation in its flux density value, consequently modifying the respective number of UV photons estimated for G331. Another aspect to account for is the noticeable presence of neighbouring dust. Looking at the bright 24-μm emission (Fig. 1), we can infer that a non-negligible fraction of these energetic photons are being absorbed by the local dust particles, thus hinting towards an additional source of ionising radiation being needed in order to explain the strong emission from the heated dust in addition to the observed continuum emission.
According to recent works, about 70% of OB stars are expected to be part of a binary system (Sana et al. 2012; Barbá et al. 2017); therefore, a likely scenario could involve the presence of a binary companion for either the WR or O star, or for both of them. Simultaneously, as high-mass stars are thought to form in groups (Roberts 1957; Lada & Lada 2003), both stars could also be members of a stellar group. In this context, the observed location of the WR star, over the ring-like PDR, could be explained by its ejection due to dynamical effects. Assuming that an O-type companion star would have been around for about 106 Myr, during this time frame the WR star would have needed to cover an angular distance of ~2′.65 − from the location of the O star – or ~4′.2 – from the centre of the region. For a corresponding distance of 7440 pc, the velocity values estimated for each case are ~5.6 km s–1 and ~9.0 km s–1, respectively. Since the WR star would only have needed to move at tangent velocities no higher than ~10 km s–1, it would have thus been quite possible for it to relocate to its observed position over the course of its lifetime. It is important to note that projection effects were not taken into account for this analysis, in which case the actual spatial velocities and distances travelled by the star would have been greater.
An illustration of the broad distribution of molecular emission surrounding G331 and the two massive stars is presented in Sect. 5. The impact of the stellar feedback on the molecular gas is distinctly evidenced by the intense emission from the near-spherical PDR presented in Fig. 10, whose brightest features coincide very well with the dense CO clouds. In agreement with the proximity of the O star to the most intense emission from the PDR and its arc-like morphology, the bright PDR is a clear indicator of the strong interaction between the energetic stellar radiation and the parent molecular cloud. The number of cYSOs found points to ongoing star formation and although we lack information on their respective distances, their projected locations over the densest molecular clouds, cold ATLASGAL clumps, and PDR support their association with the molecular structures surrounding G331.
Another well-established signpost of recent star-forming activity involves the OH, CH3OH, and H2O masers observed in the vicinity of G331. Intense maser emission can be found in cold dense regions, near the borders of H ii regions or embedded in them, close to forming or newly formed ionising OB stars. In particular, the multiple masing species detected in the densest cloud (cloud C) bordering G331 lie in close proximity to the ultra-compact (UC) H ii region identified as IRAS 16060-5146, located at l = 330°.9489 and b = −0°.1739 (Walsh et al. 1998; Caswell 2001); thus, the observed maser emission likely originates as a result of the shocked, dense neighbouring gas being affected by strong stellar winds and energetic radiation. The presence of all these masing molecules has long been associated with massive star-forming regions (Caswell et al. 1995; Szymczak et al. 2002). Class II (radiatively-pumped) 6.7-MHz methanol is generally found very near the positions of UC H ii regions and OH masers, and has only been observed towards high-mass YSOs (Breen et al. 2013). Similarly, H2O masers are closely associated with the early stages of massive star formation, often coinciding with UC H ii regions and MYSOs (Urquhart et al. 2009). The strong maser emission detected is thus a distinct evidence of recent episodes of star formation taking place near G331, and of the existence of high-mass protostars or recently formed early-type stars functioning as ‘input’ sources for the maser excitation.
Point sources from the GLIMPSE I+II+3D catalogue identified as cYSOs and classified as class I or class II objects.
7 Conclusions
We carried out an observational and multi-frequency study of the H ii region G331.03-00.15 to investigate its local medium and the massive stellar population associated with it. The region is located in the inner part of the Galaxy, where high extinction is present, and at an assumed, large distance of 7.44 kpc. Coupled with the abundant amounts of neighbouring dust and molecular gas observed, the detection in the optical bands of early-type stars that could be related to the region is greatly hindered. The sole catalogued massive star found in the area, namely, the WC-type star identified as WR 1051-67L was detected in the NIR bands. Taking into consideration its projected position and estimated distance, we propose that it acts as a possible ionising source for G331.
Based on an energy analysis of the H ii region, we inferred that additional UV photons would be needed to maintain the ionised region, together with the amount contributed by the WC star. Using the observed radio continuum-emission morphology of G331 and NIR photometric data, we selected the IR point sources that are massive star candidates at the distance of G331. Via a low-resolution H and K-band spectroscopic analysis, we were able to identify one new O-type star and classified it as O7 V, as well as multiple stellar sources ranging from type A5 V to K4 III, which we consider to be field stars and therefore unrelated to G331.
The location of the newly discovered O star shows a good agreement with the morphology of G331 seen in the MIR bands. Its inclusion as an extra source of ionising radiation interacting with the local gas suggests a scenario in which the presence of other massive stars would not be essential for the formation of the region. However, we cannot discard the possibility that additional high-mass stars could remain undetected, as there is ample molecular emission surrounding G331. Primary tracers of recent star-forming activity were also found, indicating massive star formation is still at work in the vicinity of this H ii region.
Taking into account the difficulties in identifying early-type stars in the parts of the Galaxy most affected by extinction, the presence of an H ii region therefore proves to be a valuable tool in the search for missing high-mass stars, potentially supplementing current catalogues of massive stars.
Acknowledgements
We would like to sincerely thank the anonymous referee for their helpful suggestions and comments that helped improve this work. This work is largely based on observations obtained for program GS-2021A-Q-318 of the Gemini Observatory, which is operated by the Association of Universities for Research in Astronomy, Inc., under a cooperative agreement with the NSF on behalf of the Gemini partnership: the National Science Foundation (United States), National Research Council (Canada), Agencia Nacional de Investigatión y Desarrollo (Chile), Ministerio de Ciencia, Tecnología e Innovatión (Argentina), Ministério da Ciência, Tecnologia, Inovações e Comu-nicações (Brazil) and Korea Astronomy and Space Science Institute (Republic of Korea). This research has made use of the VizieR catalogue access tool, CDS, Strasbourg, France (DOI:10.26093/cds/vizier). The original description of the VizieR service was published in 2000, A&Amp;AS 143, 23. This work is also based on data products from VVV Survey observations made with the VISTA telescope at the ESO Paranal Observatory under programme ID 179.B-2002. This research has made use of the NASA/IPAC Infrared Science Archive, which is funded by the National Aeronautics and Space Administration and operated by the California Institute of Technology. The ATLASGAL project is a collaboration between the Max-Planck-Gesellschaft, the European Southern Observatory (ESO) and the Universidad de Chile. It includes projects E-181.C-0885, E-078.F-9040(A), M-079.C-9501(A), M-081.C-9501(A) plus Chilean data. We thank ATNF and CSIRO for the use of the SGPS data. The SGPS is based upon work supported in part by the U.S. National Science Foundation through grant AST-0307358 to Harvard College Observatory and grant AST-9732695 to the University of Minnesota. RG acknowledges support from grant PICT 2019-0344 and PID G161-UNLP. S.B.C., A.B.B. and S.C. acknowledge support from CONICET grant PIP 112-201701-00604.
References
- Anderson, L. D., Bania, T. M., Balser, D. S., et al. 2014, ApJS, 212, 1 [Google Scholar]
- Arnal, E. M. 1992, A&A, 254, 305 [NASA ADS] [Google Scholar]
- Bailer-Jones, C. A. L., Rybizki, J., Fouesneau, M., Mantelet, G., & Andrae, R. 2018a, AJ, 156, 58 [Google Scholar]
- Bailer-Jones, C. A. L., Rybizki, J., Fouesneau, M., Mantelet, G., & Andrae, R. 2018b, VizieR Online Data Catalog: I/347 [Google Scholar]
- Bailer-Jones, C. A. L., Rybizki, J., Fouesneau, M., Demleitner, M., & Andrae, R. 2021, AJ, 161, 147 [Google Scholar]
- Barbá, R. H., Gamen, R., Arias, J. I., & Morrell, N. I. 2017, IAU Symp. 329, 89 [Google Scholar]
- Batchelor, R. A., Caswell, J. L., Goss, W. M., et al. 1980, Australian J. Phys., 33, 139 [NASA ADS] [CrossRef] [Google Scholar]
- Benjamin, R. A., Churchwell, E., Babler, B. L., et al. 2003, PASP, 115, 953 [Google Scholar]
- Braiding, C., Wong, G. F., Maxted, N. I., et al. 2018, PASA, 35, e029 [NASA ADS] [CrossRef] [Google Scholar]
- Breen, S. L., Ellingsen, S. P., Contreras, Y., et al. 2013, MNRAS, 435, 524 [Google Scholar]
- Burton, M. G., Braiding, C., Glueck, C., et al. 2013, PASA, 30, e044 [NASA ADS] [CrossRef] [Google Scholar]
- Cárdenas, S. B., Cichowolski, S., Suad, L. A., et al. 2022, MNRAS, 509, 3395 [Google Scholar]
- Carey, S. J., Noriega-Crespo, A., Price, S. D., et al. 2005, AAS Meeting Abstracts, 207, 63.33 [NASA ADS] [Google Scholar]
- Caswell, J. L. 2001, MNRAS, 326, 805 [NASA ADS] [CrossRef] [Google Scholar]
- Caswell, J. L. 2009, PASA, 26, 454 [NASA ADS] [CrossRef] [Google Scholar]
- Caswell, J. L., & Haynes, R. F. 1987, A&A, 171, 261 [NASA ADS] [Google Scholar]
- Caswell, J. L., Haynes, R. F., & Goss, W. M. 1980, Australian J. Phys., 33, 639 [NASA ADS] [CrossRef] [Google Scholar]
- Caswell, J. L., Vaile, R. A., Ellingsen, S. P., Whiteoak, J. B., & Norris, R. P. 1995, MNRAS, 272, 96 [NASA ADS] [CrossRef] [Google Scholar]
- Caswell, J. L., Kramer, B. H., Sukom, A., & Reynolds, J. E. 2010, MNRAS, 402, 2649 [NASA ADS] [CrossRef] [Google Scholar]
- Caswell, J. L., Fuller, G. A., Green, J. A., et al. 2011, MNRAS, 417, 1964 [Google Scholar]
- Cazzolato, F., & Pineault, S. 2000, AJ, 120, 3192 [NASA ADS] [CrossRef] [Google Scholar]
- Cesetti, M., Pizzella, A., Ivanov, V. D., et al. 2013, A&A, 549, A129 [NASA ADS] [CrossRef] [EDP Sciences] [Google Scholar]
- Chaisson, E. J. 1976, in Frontiers of Astrophysics Cambridge, ed. E. H. Avrett (Cambridge: Harvard University Press), 259 [Google Scholar]
- Cichowolski, S., Pineault, S., Arnal, E. M., et al. 2001, AJ, 122, 1938 [NASA ADS] [CrossRef] [Google Scholar]
- Cichowolski, S., Duronea, N. U., Suad, L. A., Reynoso, E. M., & Dorda, R. 2018, MNRAS, 474, 647 [NASA ADS] [CrossRef] [Google Scholar]
- Comerón, F., Schneider, N., & Russeil, D. 2005, A&A, 433, 955 [NASA ADS] [CrossRef] [EDP Sciences] [Google Scholar]
- Crowther, P. A. 2007, ARA&A, 45, 177 [Google Scholar]
- Dickman, R. L. 1978, ApJS, 37, 407 [CrossRef] [Google Scholar]
- Dudorov, A. E., & Khaibrakhmanov, S. A. 2017, Open Astron., 26, 285 [NASA ADS] [CrossRef] [Google Scholar]
- Eikenberry, S. S., Elston, R., Raines, S. N., et al. 2004, SPIE Conf. Ser., 5492, 1196 [NASA ADS] [Google Scholar]
- Fich, M., Blitz, L., & Stark, A. A. 1989, ApJ, 342, 272 [NASA ADS] [CrossRef] [Google Scholar]
- Gervais, S., & St-Louis, N. 1999, AJ, 118, 2394 [NASA ADS] [CrossRef] [Google Scholar]
- Giudici Michilini, F., Ferrero, G., Gamen, R., Morrell, N. I., & Barbá, R. 2020, Boletin de la Asociacion Argentina de Astronomia La Plata Argentina, 61B, 90 [Google Scholar]
- Giudici Michilini, F. N., Ferrero, G. A., Gamen, R., Morrell, N., & Barbá, R. 2021, Boletin de la Asociacion Argentina de Astronomia La Plata Argentina, 62, 74 [NASA ADS] [Google Scholar]
- Gutermuth, R. A., Megeath, S. T., Myers, P. C., et al. 2009, ApJS, 184, 18 [Google Scholar]
- Hanson, M. M., Kudritzki, R. P., Kenworthy, M. A., Puls, J., & Tokunaga, A. T. 2005, ApJS, 161, 154 [NASA ADS] [CrossRef] [Google Scholar]
- Haverkorn, M., Gaensler, B. M., McClure-Griffiths, N. M., Dickey, J. M., & Green, A. J. 2006, ApJS, 167, 230 [CrossRef] [Google Scholar]
- Jones, C., & Dickey, J. M. 2012, ApJ, 753, 62 [NASA ADS] [CrossRef] [Google Scholar]
- Kramida, A., Y. Ralchenko, Reader, J., & NIST ASD Team. 2021, NIST Atomic Spectra Database (ver. 5.9), https://physics.nist.gov/asd (National Institute of Standards and Technology, Gaithersburg, MD) [Google Scholar]
- Lada, C. J., & Lada, E. A. 2003, ARA&A, 41, 57 [Google Scholar]
- Ladd, N., Purcell, C., Wong, T., & Robertson, S. 2005, PASA, 22, 62 [NASA ADS] [CrossRef] [Google Scholar]
- Lada, C. J., Lombardi, M., & Alves, J. F. 2010, ApJ, 724, 687 [Google Scholar]
- Maíz-Apellániz, J. 2004, Astrophys. Space Sci. Lib., 315, 231 [CrossRef] [Google Scholar]
- Maíz Apellániz, J., Sota, A., Morrell, N. I., et al. 2013, in Massive Stars: From alpha to Omega, http://a2omega-conference.net, 198 [Google Scholar]
- Martins, F., & Plez, B. 2006, A&A, 457, 637 [NASA ADS] [CrossRef] [EDP Sciences] [Google Scholar]
- McClure-Griffiths, N. M., Green, A. J., Dickey, J. M., et al. 2001, ApJ, 551, 394 [Google Scholar]
- McClure-Griffiths, N. M., Dickey, J. M., Gaensler, B. M., et al. 2005, ApJS, 158, 178 [NASA ADS] [CrossRef] [Google Scholar]
- Minniti, D., Lucas, P. W., Emerson, J. P., et al. 2010, New A, 15, 433 [Google Scholar]
- Minniti, D., Lucas, P., & VVV Team. 2017, VizieR Online Data Catalog: II/348 [Google Scholar]
- Nguyen, H., Nguyen Lu’o’ng, Q., Martin, P. G., et al. 2015, ApJ, 812, 7 [NASA ADS] [CrossRef] [Google Scholar]
- Ramirez, S. V., Depoy, D. L., Frogel, J. A., Sellgren, K., & Blum, R. D. 1997, AJ, 113, 1411 [NASA ADS] [CrossRef] [Google Scholar]
- Rieke, G. H., & Lebofsky, M. J. 1985, ApJ, 288, 618 [Google Scholar]
- Roberts, M. S. 1957, PASP, 69, 59 [NASA ADS] [CrossRef] [Google Scholar]
- Rosslowe, C. K., & Crowther, P. A. 2015, MNRAS, 447, 2322 [NASA ADS] [CrossRef] [Google Scholar]
- Sana, H., de Mink, S. E., de Koter, A., et al. 2012, Science, 337, 444 [Google Scholar]
- Schuller, F., Menten, K. M., Contreras, Y., et al. 2009, A&A, 504, 415 [NASA ADS] [CrossRef] [EDP Sciences] [Google Scholar]
- Shara, M. M., Faherty, J. K., Zurek, D., et al. 2012, AJ, 143, 149 [NASA ADS] [CrossRef] [Google Scholar]
- Skrutskie, M. F., et al. 2006, AJ, 131, 1163 [NASA ADS] [CrossRef] [Google Scholar]
- Spitzer Science, C. 2009, VizieR Online Data Catalog: II/293 [Google Scholar]
- Strömgren, B. 1939, ApJ, 89, 526 [CrossRef] [Google Scholar]
- Szymczak, M., Kus, A. J., Hrynek, G., Kěpa, A., & Pazderski, E. 2002, A&A, 392, 277 [NASA ADS] [CrossRef] [EDP Sciences] [Google Scholar]
- Tody, D. 1986, SPIE Conf. Ser., 627, 733 [Google Scholar]
- Tody, D. 1993, ASP Conf. Ser., 52, 173 [NASA ADS] [Google Scholar]
- Urquhart, J. S., Hoare, M. G., Lumsden, S. L., et al. 2009, A&A, 507, 795 [NASA ADS] [CrossRef] [EDP Sciences] [Google Scholar]
- van der Hucht, K. A. 2001, New A Rev., 45, 135 [CrossRef] [Google Scholar]
- van der Hucht, K. A. 2006, A&A, 458, 453 [NASA ADS] [CrossRef] [EDP Sciences] [Google Scholar]
- Wallace, L., & Hinkle, K. 1997, ApJS, 111, 445 [NASA ADS] [CrossRef] [Google Scholar]
- Walsh, A. J., Burton, M. G., Hyland, A. R., & Robinson, G. 1998, MNRAS, 301, 640 [Google Scholar]
- Wells, D. C. 1985, in Data Analysis in Astronomy, eds. V. di Gesu, L. Scarsi, P. Crane, J. H. Friedman, & S. Levialdi (Berlin: Springer), 195 [CrossRef] [Google Scholar]
- Wilson, T. L., Mezger, P. G., Gardner, F. F., & Milne, D. K. 1970, A&A, 6, 364 [NASA ADS] [Google Scholar]
IRAF was distributed by the National Optical Astronomy Observatories, which is operated by the Association of Universities for Research in Astronomy, Inc. (AURA) under cooperative agreement with the National Science Foundation.
Based on the 7th catalogue compiled by van der Hucht (2001) and van der Hucht (2006).
All Tables
Physical parameters estimated for the three molecular structures detected in the 12CO and 13CO integrated emission maps.
Point sources from the GLIMPSE I+II+3D catalogue identified as cYSOs and classified as class I or class II objects.
All Figures
|
Fig. 1 Three-colour composite image of Η ii region G331.03-00.15, where the red, green, and blue colours represent the observed emission at 24, 8, and 4.5 μm, respectively. The light blue star indicates the location of WR 1051-67L. |
| In the text | |
|
Fig. 2 Emission map of the Η ii region G331, at 1420 MHz. The black emission contour corresponds to 0.3 Jy beam−1, and the red circle marks the area in which the search of VVV candidate sources was carried out. The red asterisk shows the position of WR star 1051-67L and the 17 black symbols indicate the location of the VVV candidates. The (x) represent Giant candidates while the (+) symbolise the MS ones. |
| In the text | |
|
Fig. 3 Colour-colour diagram of the 17 VVV candidate sources projected onto the circled region in Fig. 2. O V and O III candidates with 14 mag < Av < 17.5 mag are indicated by yellow and blue circles, respectively. The positions of the de-reddened early-type MS and giant sequence are shown by the orange and black lines, respectively. The reddening vectors for O3 V and M0 III stars are indicated by the dashed red lines, using extinction values from Rieke & Lebofsky (1985), where each red (x) symbol indicates an increase of five magnitudes in the value of Av. |
| In the text | |
|
Fig. 4 Spectrum of the discovered 07 V star, in the H and K-baηds (top and bottom panels, respectively). Colourised vertical lines indicate Η-lines at 1.6411, 1.6811, 1.7367, and 2.1661 μm (green), He I λλ1.7007, 2.1126, and 2.1614 (orange), He II λλ1.6923 and 2.1891 (red), Ν III λ2.1155 (blue) and C IV λλ2.0706, 2.0802, and 2.0842 (light blue). In the H-band, we also marked an unidentified absorption line at 17235 Å (light blue). |
| In the text | |
|
Fig. 5 Spectra in the K-baηd range of late-type stars in the field. Colourised vertical lines indicate the Βrγ absorption line (in green), Na I λλ2.2062−2.2090 and Ca I 112.2614−2.2631−2.2657 (in blue), Si I λ2.2657, and 2.1360 (red), Mg I λ2.1066, and 2.2814 (orange), and A1 I λ2.1099, and 2.1170 (yellow). |
| In the text | |
|
Fig. 6 Spectra in the K-band range of late-type stars in the field. Colourised vertical lines indicate the Βrγ absorption line (in green), Na I γγ2.2062−2.2090, and γγ2.3350−2.3390 and Ca I γγ2.2614− 2.2631−2.2657 (in blue), and CO bands at 2.2935, 2.3227, 2.3524, and 2.3830 μm (red). |
| In the text | |
|
Fig. 7 Ks-baηd image of the region in the sky containing G331 and the 26 observed objects, obtained with VISTA/VIRCAM. The candidate search area delimited by the pink circle is the same as the one shown in Fig. 2, and encloses the 14 selected candidates (red dots) and the other observed stellar sources (orange triangles). The blue star marks the position of WR 1051-67L. |
| In the text | |
|
Fig. 8 Integrated emission maps from the Mopra survey, showing the three detected molecular structures, identified with capital letters. Top panel: CO emission distribution. White contour values of 8.6 and 9.9 Κ are drawn. Bottom panel: 13CO emission distribution. The white contours correspond to 2 and 2.8 K. Both maps have been integrated along the line of sight, in the velocity interval from −98 km s−1 to −86 km s−1. The blue asterisk indicates the position of the WR star, and the yellow one, the position of the O-type star. |
| In the text | |
|
Fig. 9 Line profile of the C18O emission averaged over a 4-pixel box that includes the positions of the masers. |
| In the text | |
|
Fig. 10 Emission map at 8 μm from the Spitzer/GLIMPSE survey. Black contour levels at 8.6 and 9.9 K correspond to the CO emission. Blue contour levels at 0.5 and 1.5 Jy beam−1 correspond to the ATLASGAL survey at 870 μm, which traces the compact, high-density structures. The green crosses show the spots of molecular masers, while the black and red asterisks show the positions of WR 1051−67 and the O7 V star, respectively. The spatial distribution of cYSOs obtained from the GLIMPSE I+II+3D catalogue is shown with red (class I) and black (class II) crosses. |
| In the text | |
Current usage metrics show cumulative count of Article Views (full-text article views including HTML views, PDF and ePub downloads, according to the available data) and Abstracts Views on Vision4Press platform.
Data correspond to usage on the plateform after 2015. The current usage metrics is available 48-96 hours after online publication and is updated daily on week days.
Initial download of the metrics may take a while.