Fig. 10
Download original image
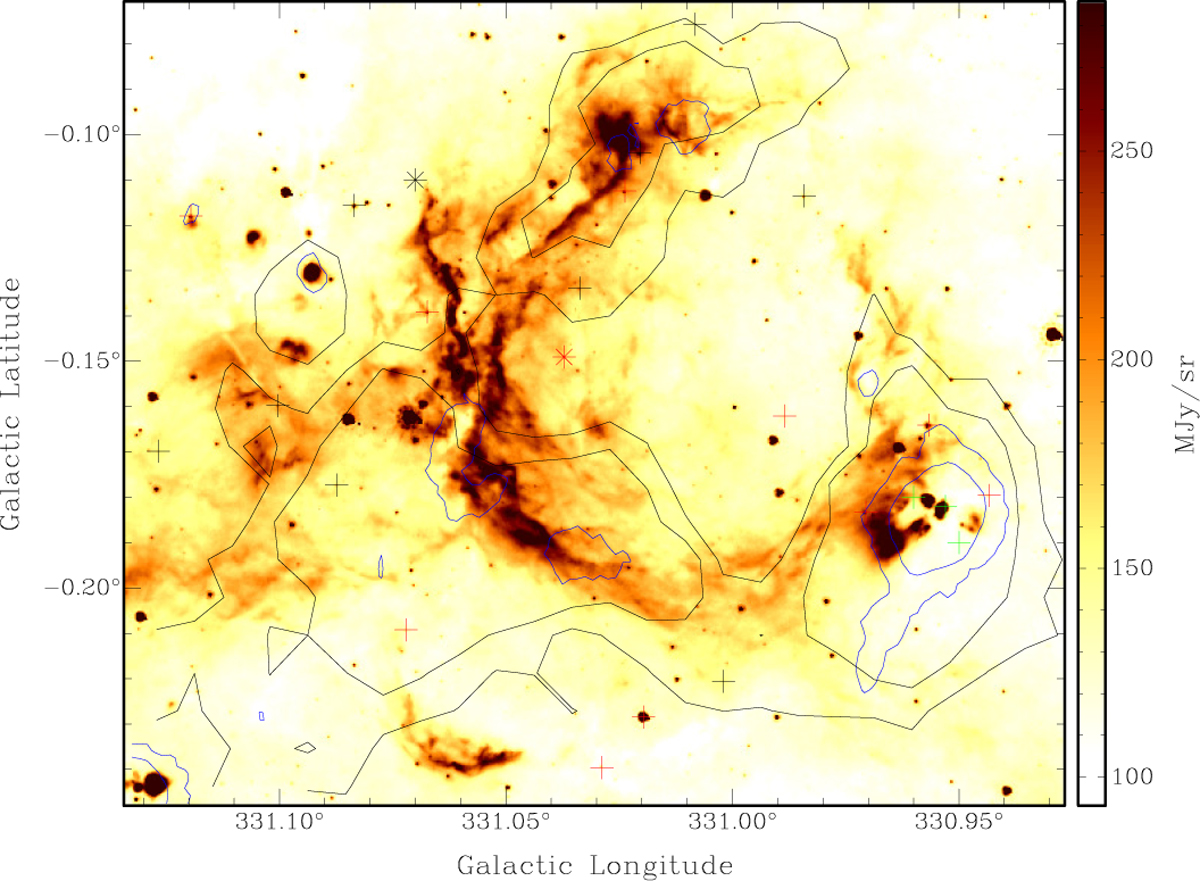
Emission map at 8 μm from the Spitzer/GLIMPSE survey. Black contour levels at 8.6 and 9.9 K correspond to the CO emission. Blue contour levels at 0.5 and 1.5 Jy beam−1 correspond to the ATLASGAL survey at 870 μm, which traces the compact, high-density structures. The green crosses show the spots of molecular masers, while the black and red asterisks show the positions of WR 1051−67 and the O7 V star, respectively. The spatial distribution of cYSOs obtained from the GLIMPSE I+II+3D catalogue is shown with red (class I) and black (class II) crosses.
Current usage metrics show cumulative count of Article Views (full-text article views including HTML views, PDF and ePub downloads, according to the available data) and Abstracts Views on Vision4Press platform.
Data correspond to usage on the plateform after 2015. The current usage metrics is available 48-96 hours after online publication and is updated daily on week days.
Initial download of the metrics may take a while.