Open Access
Fig. 1
Download original image
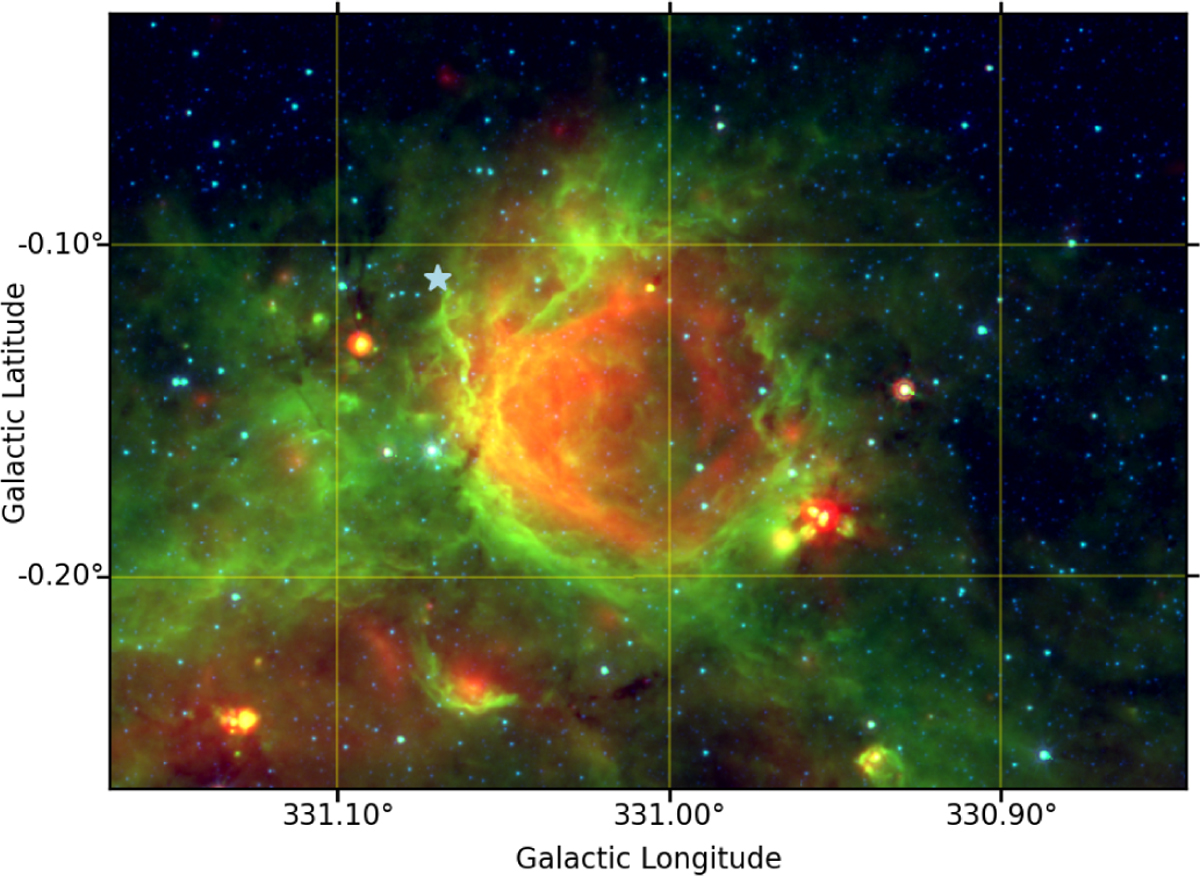
Three-colour composite image of Η ii region G331.03-00.15, where the red, green, and blue colours represent the observed emission at 24, 8, and 4.5 μm, respectively. The light blue star indicates the location of WR 1051-67L.
Current usage metrics show cumulative count of Article Views (full-text article views including HTML views, PDF and ePub downloads, according to the available data) and Abstracts Views on Vision4Press platform.
Data correspond to usage on the plateform after 2015. The current usage metrics is available 48-96 hours after online publication and is updated daily on week days.
Initial download of the metrics may take a while.