Fig. 8
Download original image
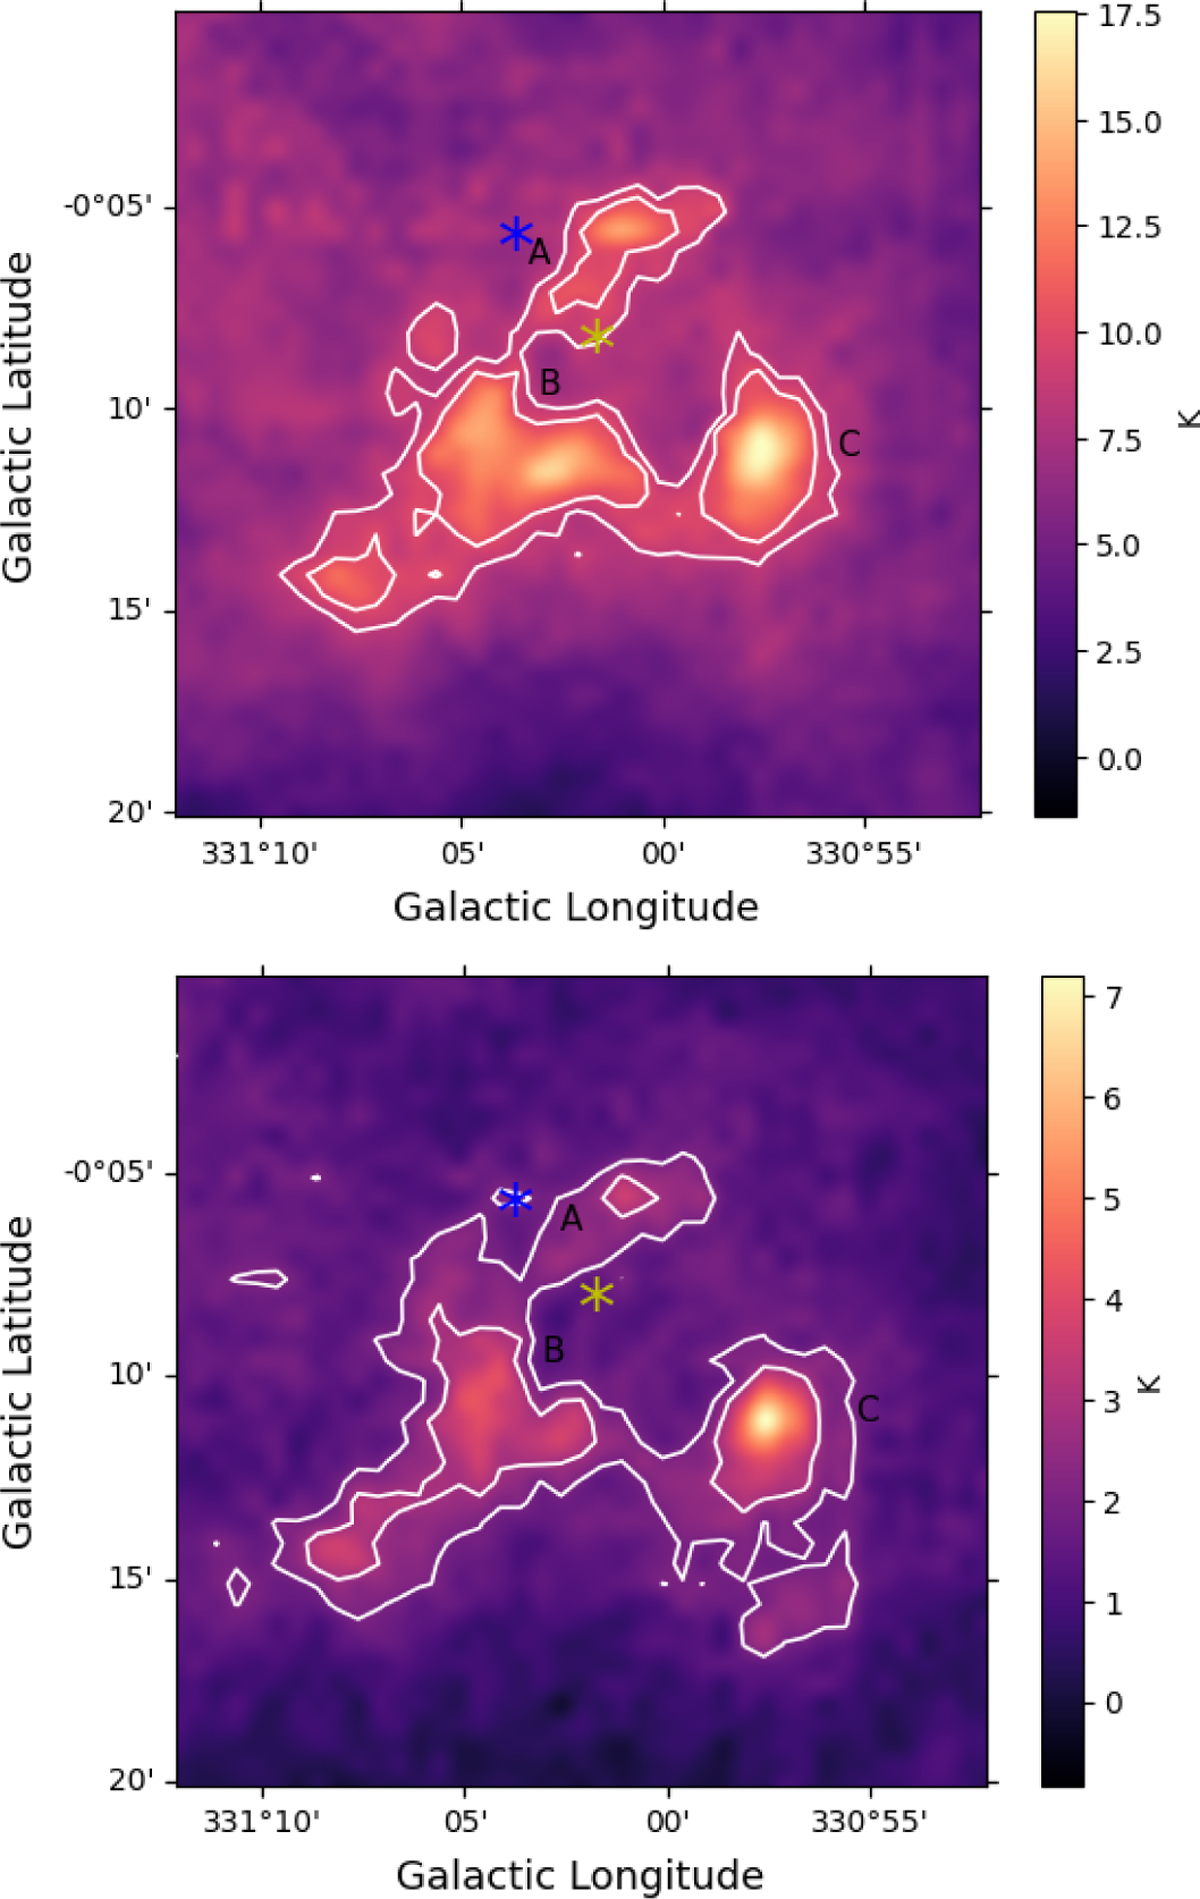
Integrated emission maps from the Mopra survey, showing the three detected molecular structures, identified with capital letters. Top panel: CO emission distribution. White contour values of 8.6 and 9.9 Κ are drawn. Bottom panel: 13CO emission distribution. The white contours correspond to 2 and 2.8 K. Both maps have been integrated along the line of sight, in the velocity interval from −98 km s−1 to −86 km s−1. The blue asterisk indicates the position of the WR star, and the yellow one, the position of the O-type star.
Current usage metrics show cumulative count of Article Views (full-text article views including HTML views, PDF and ePub downloads, according to the available data) and Abstracts Views on Vision4Press platform.
Data correspond to usage on the plateform after 2015. The current usage metrics is available 48-96 hours after online publication and is updated daily on week days.
Initial download of the metrics may take a while.