Fig. A.1.
Download original image
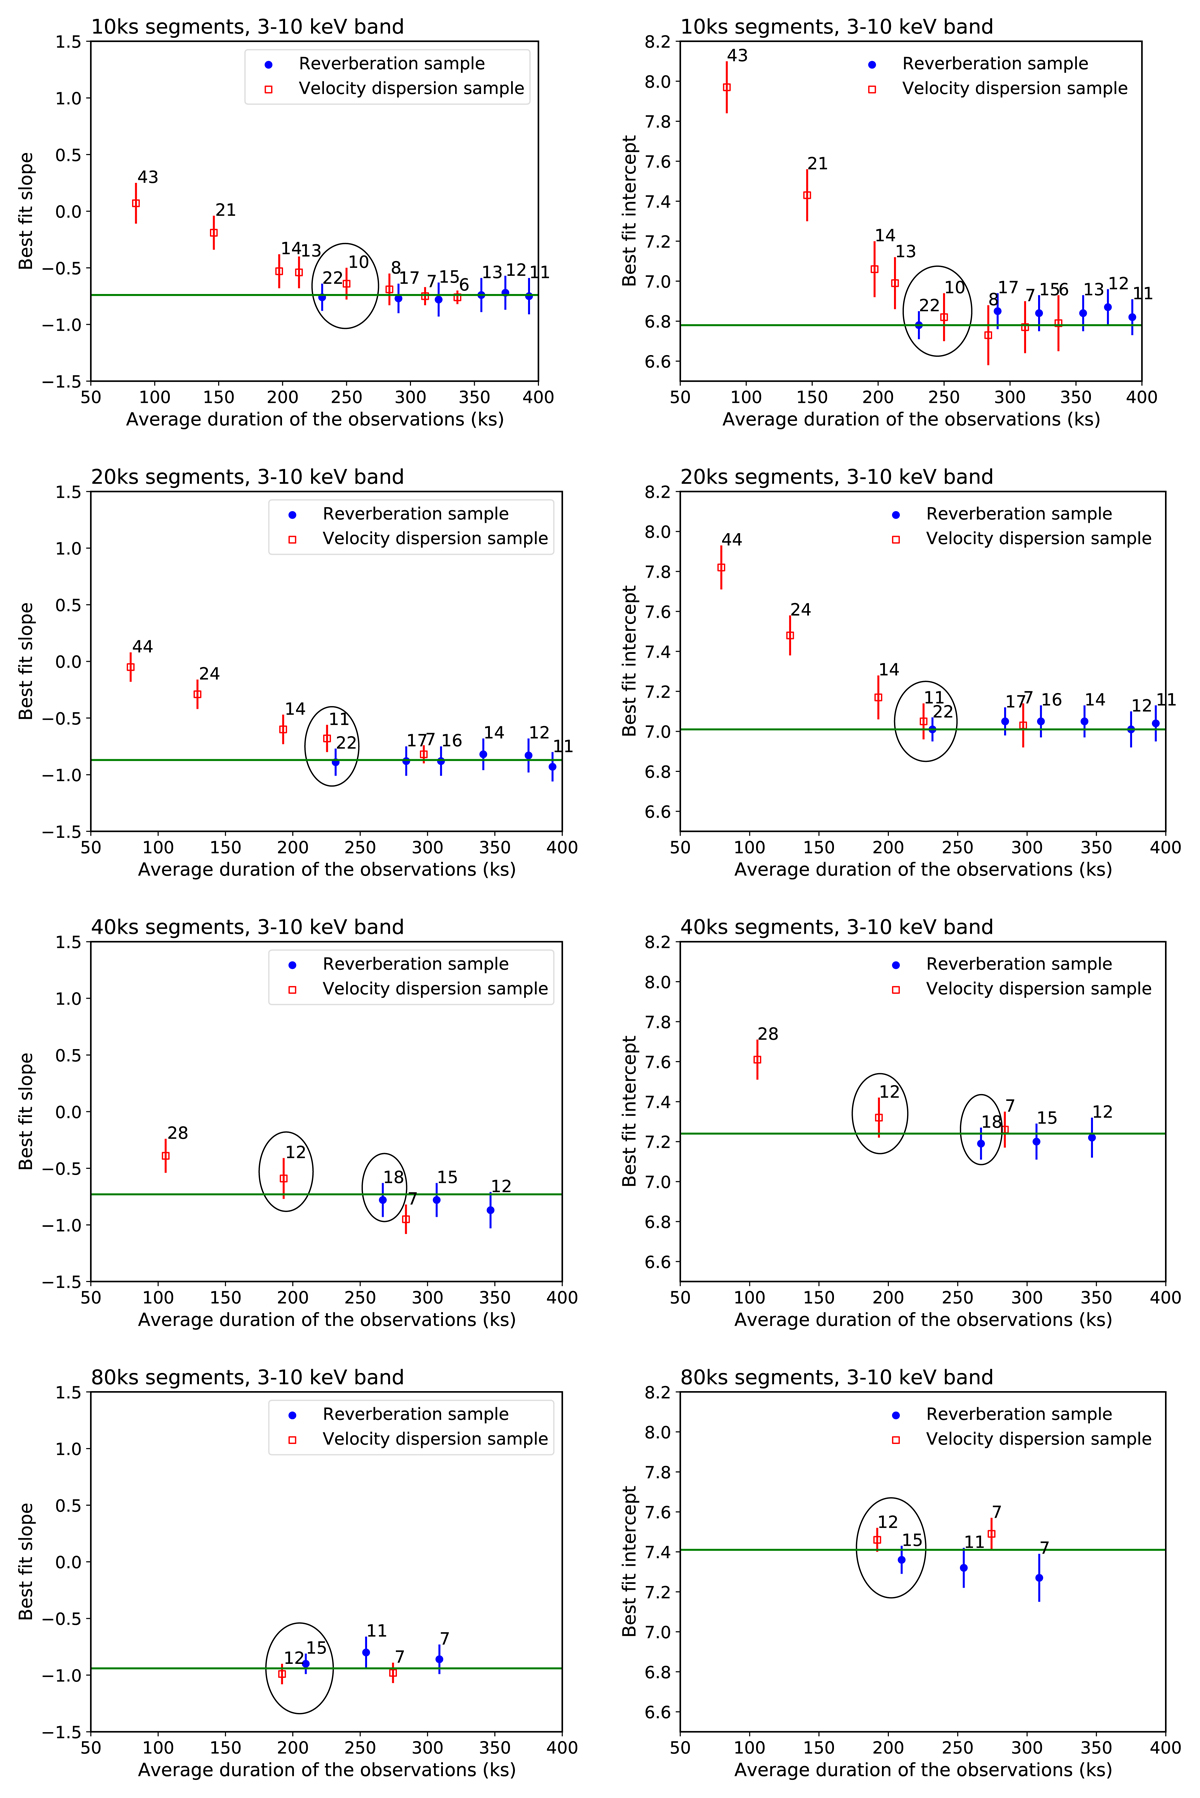
Best-fit slope and intercept in the 3–10 keV band for the rev sub-samples (filled-blue circles) and the VD sub-samples (open-red squares) as a function of the average duration of their sources. The circles indicate the first rev and VD sub-samples (i.e those with a shorter duration) for which the best-fit results are in agreement (within errors). The horizontal lines indicates the best fit value when we fit the combined data from the two sub-samples in agreement (rev and VD).
Current usage metrics show cumulative count of Article Views (full-text article views including HTML views, PDF and ePub downloads, according to the available data) and Abstracts Views on Vision4Press platform.
Data correspond to usage on the plateform after 2015. The current usage metrics is available 48-96 hours after online publication and is updated daily on week days.
Initial download of the metrics may take a while.