Fig. 5.
Download original image
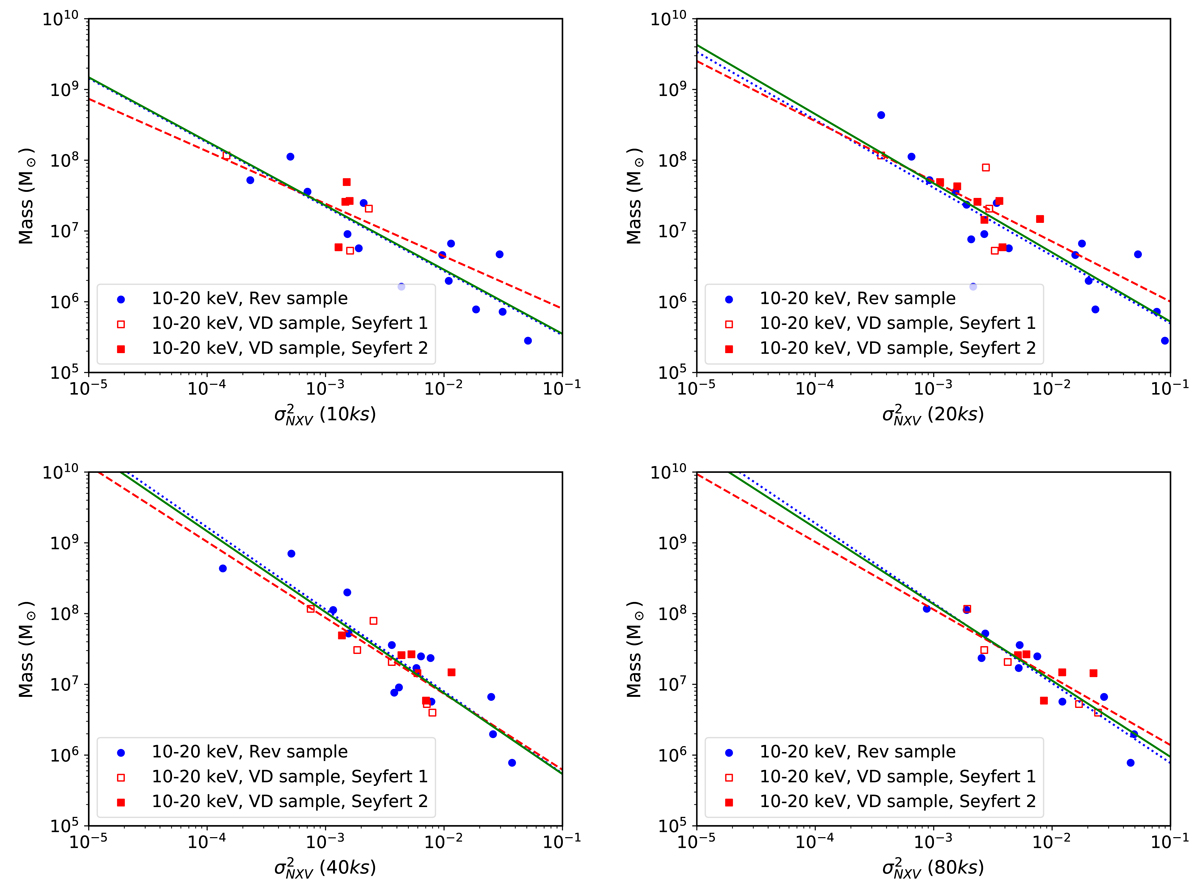
MBH vs. ![]() , in the 10–20 keV band, for the final rev and VD sub-samples (chosen as explained in Sect. 5.2). Filled-blue circles indicate the rev sample data (Type I AGN) while open-red and filled-red squares indicate Type I and Type II AGN from the VD sample, respectively. The blue-dotted and the red-dashed lines show the best-fit lines to the rev and VD (Type I and Type II) data respectively. The solid green line shows the best fit relation using all the data in each panel.
, in the 10–20 keV band, for the final rev and VD sub-samples (chosen as explained in Sect. 5.2). Filled-blue circles indicate the rev sample data (Type I AGN) while open-red and filled-red squares indicate Type I and Type II AGN from the VD sample, respectively. The blue-dotted and the red-dashed lines show the best-fit lines to the rev and VD (Type I and Type II) data respectively. The solid green line shows the best fit relation using all the data in each panel.
Current usage metrics show cumulative count of Article Views (full-text article views including HTML views, PDF and ePub downloads, according to the available data) and Abstracts Views on Vision4Press platform.
Data correspond to usage on the plateform after 2015. The current usage metrics is available 48-96 hours after online publication and is updated daily on week days.
Initial download of the metrics may take a while.