Open Access
Fig. 3.
Download original image
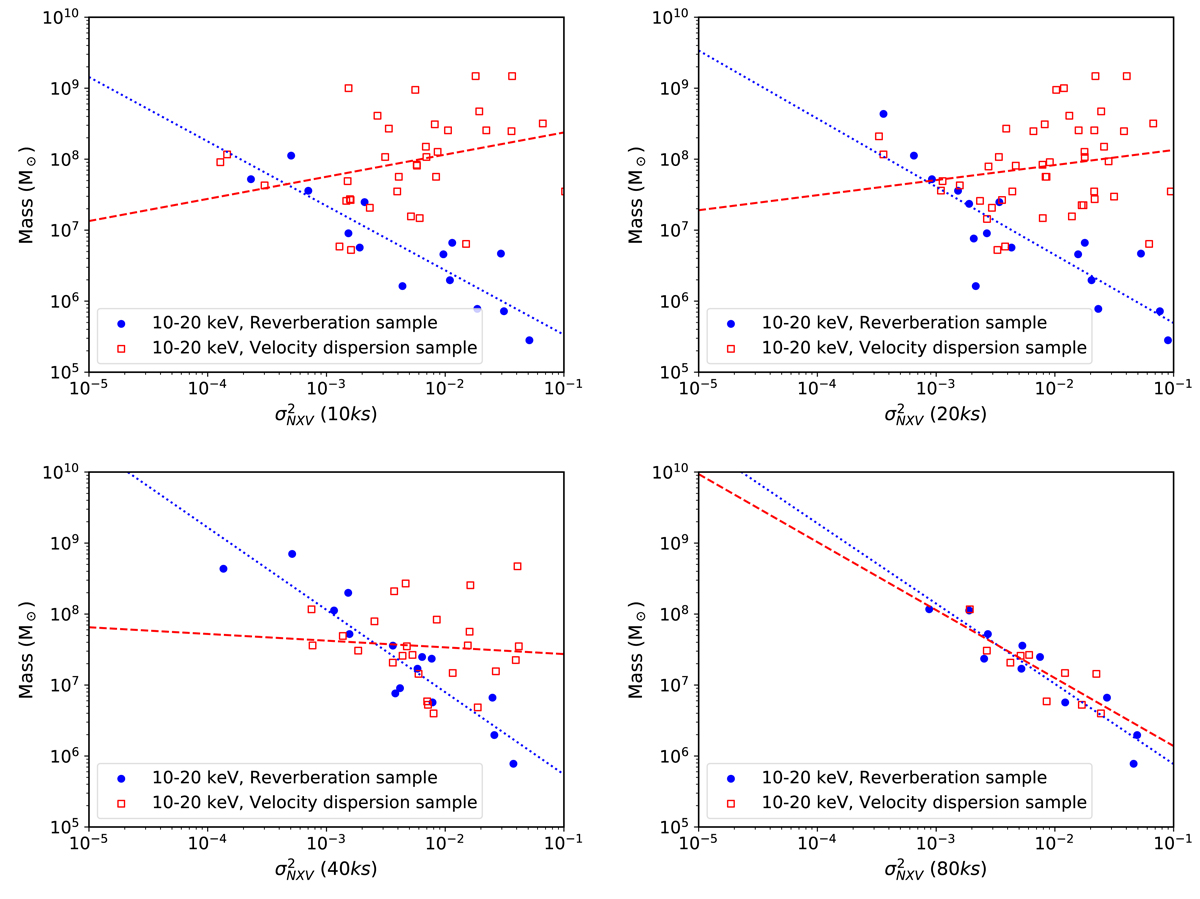
MBH vs. ![]() in the 10–20 keV band for the rev sample (filled-blue circles) and the VD sample (open-red squares). The dotted blue line and the red dashed line show the best-fit results for the rev and the VD sample, respectively.
in the 10–20 keV band for the rev sample (filled-blue circles) and the VD sample (open-red squares). The dotted blue line and the red dashed line show the best-fit results for the rev and the VD sample, respectively.
Current usage metrics show cumulative count of Article Views (full-text article views including HTML views, PDF and ePub downloads, according to the available data) and Abstracts Views on Vision4Press platform.
Data correspond to usage on the plateform after 2015. The current usage metrics is available 48-96 hours after online publication and is updated daily on week days.
Initial download of the metrics may take a while.