| Issue |
A&A
Volume 666, October 2022
|
|
|---|---|---|
| Article Number | A114 | |
| Number of page(s) | 22 | |
| Section | Atomic, molecular, and nuclear data | |
| DOI | https://doi.org/10.1051/0004-6361/202142848 | |
| Published online | 18 October 2022 | |
Toward the limits of complexity of interstellar chemistry: Rotational spectroscopy and astronomical search for n- and i-butanal★
1
Grupo de Espectroscopía Molecular (GEM), Edificio Quifima, Área de Química-Física, Laboratorios de Espectroscopía y Bioespectroscopía, Universidad de Valladolid, Parque Cientifíco UVa, Unidad Asociada CSIC,
47011
Valladolid, Spain
e-mail: This email address is being protected from spambots. You need JavaScript enabled to view it.
2
Computational Chemistry Group, Departamento de Química Física y Química Inorgánica, Facultad de Ciencias, Universidad de Valladolid,
47011
Valladolid, Spain
e-mail: This email address is being protected from spambots. You need JavaScript enabled to view it.
3
Max-Planck-Institut für Radioastronomie,
Auf dem Hügel 69,
53121
Bonn, Germany
4
Centro de Astrobiología, Consejo Superior de Investigaciones Científicas-Instituto Nacional de Tecnica Aeroespacial “Esteban Terradas”,
28850
Madrid, Spain
5
Departments of Chemistry and Astronomy, University of Virginia,
Charlottesville, VA
22904, USA
6
Department of Analytical Chemistry, University of Chemistry and Technology,
Technická 5,
166 28
Prague 6, Czech Republic
7
I. Physikalisches Institut, Universität zu Köln,
Zülpicher Str. 77,
50937
Köln, Germany
Received:
6
December
2021
Accepted:
9
February
2022
Abstract
Context. In recent times, large organic molecules of exceptional complexity have been found in diverse regions of the interstellar medium.
Aims. In this context, we aim to provide accurate frequencies of the ground vibrational state of two key aliphatic aldehydes, n-butanal and its branched-chain isomer, i-butanal, to enable their eventual detection in the interstellar medium. We also want to test the level of complexity that interstellar chemistry can reach in regions of star formation.
Methods. We employ a frequency modulation millimeter-wave absorption spectrometer to measure the rotational features of n- and i-butanal. We analyze the assigned rotational transitions of each rotamer separately using the A-reduced semirigid-rotor Hamiltonian. We use the spectral line survey ReMoCA performed with the Atacama Large Millimeter/submillimeter Array to search for n- and i-butanal toward the star-forming region Sgr B2(N). We also search for both aldehydes toward the molecular cloud G+0.693−0.027 with IRAM 30 m and Yebes 40 m observations. The observational results are compared with computational results from a recent gas-grain astrochemical model.
Results. Several thousand rotational transitions belonging to the lowest-energy conformers of two distinct linear and branched isomers have been assigned in the laboratory spectra up to 325 GHz. A precise set of the relevant rotational spectroscopic constants has been determined for each structure as a first step toward identifying both molecules in the interstellar medium. We report non-detections of n-and i-butanal toward both sources, Sgr B2(N1S) and G+0.693-0.027. We find that n- and i-butanal are at least 2-6 and 6-18 times less abundant than acetaldehyde toward Sgr B2(N1S), respectively, and that n-butanal is at least 63 times less abundant than acetaldehyde toward G+0.693−0.027. While propanal is not detected toward Sgr B2(N1S) either, with an abundance at least 5–11 lower than that of acetaldehyde, propanal is found to be 7 times less abundant than acetaldehyde in G+0.693−0.027. Comparison with astrochemical models indicates good agreement between observed and simulated abundances (where available). Grain-surface chemistry appears sufficient to reproduce aldehyde ratios in G+0.693−0.027; gas-phase production may play a more active role in Sgr B2(N1S). Model estimates for the larger aldehydes indicate that the observed upper limits may be close to the underlying values.
Conclusions. Our astronomical results indicate that the family of interstellar aldehydes in the Galactic center region is characterized by a drop of one order of magnitude in abundance at each incrementation in the level of molecular complexity.
Key words: ISM: molecules / molecular data / astrochemistry / line: identification / ISM: individual objects: Sagittarius B2 / ISM: individual objects: G+0.693−0.027
The full list of measured transitions is only available at the CDS via anonymous ftp to cdsarc.u-strasbg.fr (130.79.128.5) or via http://cdsarc.u-strasbg.fr/viz-bin/cat/J/A+A/666/A114
© ESO 2022
1 Introduction
Our understanding of the chemistry of star-forming regions is steadily growing thanks to advances in laboratory astrochemistry and the construction of radio telescopes with unparalleled regimes of sensitivity. In current astrochemical research, significant endeavors have been made to study the so-called complex organic molecules (COMs; Jørgensen et al. 2020), which are carbon-based molecules that contain at least six atoms (see McGuire 2022 for a census). Among them, aldehydes are some of the most widespread species in nature, being precursors of many biologically relevant molecules. Fifty years ago, Snyder et al. (1969) reported the detection of formaldehyde (H2CO), the first interstellar aldehyde, in diverse galactic and extragalactic radio sources using the NRAO 140 ft telescope. Since then, several CHO-bearing species with increasing levels of complexity have been discovered, mainly toward the giant molecular cloud complex Sagittarius B2 (Sgr B2), notably acetaldehyde (CH3CHO; Gottlieb 1973), glycolaldehyde (CH2(OH)CHO; Hollis et al. 2000), which is the simplest sugar-related molecule, propanal (CH3CH2CHO; Hollis et al. 2004), and cyanoformaldehyde (CNCHO; Remijan et al. 2008). More complex aldehydes such as lactaldehyde (CH3CH(OH)CH(O); Alonso et al. 2019), which is the rational step up in complexity from glycolaldehyde, are yet to be detected.
Astronomical discoveries of new molecular systems have typically been the driving motive in the selection of novel targets to study. Of paramount relevance was the radio-astronomical discovery of isopropyl cyanide, or isobutyronitrile (i-C3H7CN, (CH3)2CHCN), the first aliphatic branched-chain molecule ever detected in the interstellar medium (ISM; Belloche et al. 2014). Recently, Kolesniková et al. (2017) performed a thorough analysis of its spectra in the millimeter- and submillimeter-wave regions. Furthermore, the detection of its linear analog, n-butyronitrile (n-C3H7CN, CH3CH2CH2CN), has been reported by Belloche et al. (2009) in IRAM 30 m observations of Sgr B2. The identification of new branched-chain species in the ISM will unveil the link between the molecular inventory of the Milky Way and the chemical composition of small celestial objects such as comets (Altwegg et al. 2016) and asteroids, as well as meteorites, their rocky remnants that land on Earth (Pizzarello et al. 2010; Burton et al. 2012), in which several branched-chain amino acids have been found (Koga & Naraoka 2017). In this context, we propose the study of two key aliphatic aldehydes of extraordinary complexity, normal-butanal (n-C4H8O; CH3CH2CH2CHO) and the branched iso-butanal (i-C4H8O; (CH3)2CHCHO), which have already been identified in several chondritic meteorites (Aponte et al. 2019), as targets for interstellar detection.
Further increasing the interest of n- and i-butanal (also known as n- and i-butyraldehyde and hereafter n-PrCHO and i-PrCHO, respectively) as astronomical candidates, Abplanalp et al. (2018) revealed that both isomers – together with distinct C3H8O species, such as propanol and methyl ethyl ether (the latter was already detected in the ISM toward Orion KL by Tercero et al. 2018 and toward IRAS 16293-2422A by Manigand et al. 2020) – could be generated by exposing interstellar analog ices to ionizing radiation. Therefore, they should be detectable in the gas phase after desorption from the icy grains in regions of star formation (Abplanalp & Kaiser 2019). This further suggests that both aldehydes are expected to be formed in the ISM and motivates the astrophysical community even more to search for them.
However, the lack of accurate millimeter-wave data of n-and i-PrCHO (see Sect. 2) thus prompted new laboratory spectroscopic measurements over the frequency range from 75 to 325 GHz. In this work, we aim to provide an extensive rotational characterization of both aldehydes in the millimeter-wave region. The analysis of the rotational spectra at these wavelengths will enable us to confidently search for both species toward different regions of the ISM.
Moreover, with the development of new and higher-sensitivity instrumentation, we expect the detection of large molecular systems (i.e., those containing large alkyl chains, but not only) to grow even beyond i-propyl cyanide (Belloche et al. 2014). This assumption is strongly supported by some of the latest astronomical detections, which include benzonitrile (c-C6H5CN; McGuire et al. 2018), cyanocyclopen-tadiene, its five-membered ring analog (McCarthy et al. 2021), ethanolamine (HOCH2CH2NH2; Rivilla et al. 2021a), and ethyl isocyanate (C2H5NCO; Rodríguez-Almeida et al. 2021b), as well as the 1- and 2- isomers of cyanonaphthalene (McGuire et al. 2021) and indene (Cernicharo et al. 2021; Burkhardt et al. 2021). However, a thoroughly harmonized observational and laboratory effort will be essential to unveil the pathways of chemical evolution of more complex systems as well as to conclusively disclose the ratio between aliphatic and cyclic molecules in the ISM (Loomis et al. 2016; McCarthy & McGuire 2021).
We describe in Sect. 2 the experimental setup that was used to measure the spectra of both aldehydes. In Sect. 3 we show the complementary quantum chemical computations. Section 4 presents the results and discussion of the analysis of the millimeter-wave spectra. The astronomical results of a search for n- and i-PrCHO toward two prominent sources in the Galactic Center, the high-mass star-forming region Sgr B2(N) and the molecular cloud G+0.693-0.027, are reported in Sects. 5 and 6. The astronomical results are discussed in a broader astrochemical framework in Sect. 7. Finally, we present in Sect. 8 the conclusions of this work.
2 Measurement of the Rotational Spectra
Both n- and i-PrCHO are colorless liquids with a boiling point of 74.8°C and 63.0°C, respectively, which were purchased from Aldrich and used without further purification. They have been previously investigated in the condensed phases by nuclear magnetic resonance (NMR) and infrared spectroscopies (Sbrana & Schettino 1970; Piart-Goypiron et al. 1991; Dwivedi & Rai 2008). Also, their conformational panoramas have already been explored in the gas phase using microwave and far-infrared spectroscopy (Stiefvater 1986; Durig et al. 1989; Hotopp et al. 2012). However, to our knowledge, their spectra had remained uncharted in the millimeter- and submillimeter-wave regions until now. Accurate spectroscopic data at high frequencies are usually mandatory for the eventual astronomical detection of many interstellar molecules in several spectral line surveys, such as the EMoCA and ReMoCA surveys conducted with Ata-cama Large Millimeter/submillimeter Array (ALMA) toward Sgr B2(N) (Belloche et al. 2017, 2019) and the IRAM 30m survey of the G+0.693-0.027 giant molecular cloud (Rivilla et al. 2020).
The room-temperature rotational spectra were recorded separately from 75 to 325 GHz using the millimeter-wave absorption spectrometer at the University of Valladolid (for a detailed description of the instrument, see Daly et al. 2014; Alonso et al. 2016). In both experiments, we filled our double-pass free-space glass cell with an optimum gas pressure of about 20 µbar (no external heating was needed for any of the molecules), which was maintained during the whole course of the experiment. The millimeter-wave radiation was generated by multiplying the fundamental signal of an Agilent E8257D microwave synthesizer (up to 20 GHz) by a set of active and passive amplifier-multiplier chains (multiplication factors of 6, 9, 12, and 18 in this case). Also, the output of the synthesizer was frequency modulated at a frequency of 10.2 kHz, with modulation depths varying between 20 to 35 kHz. After the radiation passed through the cell, the signal was detected using solid-state zero-bias detectors and was sent to a phase-sensitive lock-in amplifier with 2f demodulation (time constant of 30 ms). This demodulation process leads to a line shape that approximates the second derivative of a Gaussian function. We measured the rotational lines employing an average of two up and down frequency scans, also using a Gaussian profile function within the AABS package (Kisiel et al. 2005). The experimental uncertainty of the unblended symmetric lines is estimated to be about 30 kHz.
Theoretical ground-state spectroscopic constants for the low-energy n-butanal conformers (A-Reduction, Ir-Representation).
3 Computational section
In addition to the previous computational work on n-PrCHO (Klimkowski et al. 1984; Dwivedi & Rai 2008; Hotopp et al. 2012), we performed high-level calculations on both n- and i-PrCHO conformers to accompany the experimental study. The geometries were optimized at the density functional theory level, employing the double-hybrid functional B2PLYP (Grimme 2006) combined with Grimme’s D3BJ dispersion (B2PLYPD3; Grimme et al. 2011), in conjunction with the correlation consistent basis set of Dunning aug-cc-pVTZ (correlation-consistent polarized valence triple-zeta including diffuse functions; Dunning 1989; Woon & Dunning 1993). Additional optimizations were also carried out using the ab initio coupled-cluster with single and double excitations (CCSD) method (Raghavachari et al. 1989). In this case the Dunning’s cc-pVTZ (correlation-consistent polarized valence triple-zeta) basis set was employed. On the optimized geometries, harmonic vibrational frequencies were calculated at both levels of theory. This allows the zero-point vibrational energy (ZPE) correction to be estimated, the nature of the stationary points located on the potential energy surface to be confirmed, and the vibrational contribution to the partition function to be computed. The structures of the low-energy conformers of both isomers are presented in Fig. 1, and their harmonic vibrational frequencies calculated at the CCSD/cc-pVTZ level are collected in Table A.1.
To obtain more accurate stability order, single point calculations were carried out on the CCSD/cc-pVTZ optimized geometries. Energies are calculated at the CCSD(T) (coupled-cluster with single and double excitations including triple excitations through a perturbative treatment) level extrapolated to the complete basis set limit, denoted as CCSD(T)/CBS. It is computed from the n−3 extrapolation equation (Helgaker et al. 1997) applied to the CCSD(T) energies calculated with the triple- (n = 3 aug-cc-pVTZ) and quadruple-zeta (n = 4, aug-cc-pVQZ) basis sets. In Table 1 the calculated spectroscopic parameters and relative energies of the conformer of n-PrCHO are reported, the corresponding values for the i-PrCHO conformers are shown in Table 2.
To perform the corresponding quantum chemical computations, we used the Gaussian (Frisch et al. 2016) and CFOUR (Stanton et al. 2013) program packages.
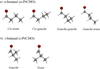 |
Fig. 1 Structures of the lowest-energy conformations of n- and i-butanal. |
4 Rotational Spectra Analysis and Discussion
4.1 Millimeter-wave Spectra of n-PrCHO
In Fig. 2a, we present a fragment of the room-temperature millimeter-wave spectrum. The spectrum is governed by sets of strong b-type R-branch (J +1) 0 J+1 ← J 1 J and (J+1)1 J+1 ← J 0 J transitions, which are separated by about 6 GHz and outshine the rest of the spectral features. Starting from the previous microwave assignments (Hotopp et al. 2012), we found that this patterns approximately coincides with the 2C predicted value of the cis-gauche conformer. We noted that at these high frequencies the rotational energy levels corresponding to the lowest Ka values become quasi degenerate (depicted in 2(a) for Ka = 0,1). Thus, a quadruple-degenerated blended line arises from the coalescence of pairs of b-type rotational transitions with the corresponding a-type lines that involve these energy levels. The early assignments were further extended to other weaker b-type transitions. Subsequently, we assigned higher Ka R-branch a- and b-type transitions together with several Q-branch transitions, spanning J and Ka values up to 70 and 31, respectively.
In a second step, a closer inspection of the millimeter-wave spectrum was directed to search for the cis-trans conformer, which shows a practically prolate behavior. Guided by the previous experimental data (Hotopp et al. 2012), we managed to identify several progressions of a- and b- type R-branch transitions belonging to cis-trans n-PrCHO, of relatively low intensity (see Fig. 2b). Afterward, new rotational lines were assigned and after iterative fittings and predictions, we completed the rotational quantum number’s coverage up to J = 69 and Ka = 20.
Concurrent to the laboratory work, the barriers of the methyl internal rotation were predicted by high-level B2PLYPD3 quantum chemical calculations to be 11.5 and 12.5 kJ mol−1 for the cis-gauche and cis-trans conformers, respectively. Nevertheless, we employed the XIAM program (Hartwig & Dreizler 1996) to predict the methyl group internal rotation splitting as well as the Loomis-Wood type plot technique (Loomis & Wood 1928; Kisiel et al. 2012) to have a thorough look at the spectra. No splittings due to internal rotation motion could be observed for either of the conformers, which is in perfect agreement with the computed barrier heights.
All in all, we measured more than 2800 rotational transitions for the cis-gauche n-PrCHO along with 1375 transitions for the cis-trans conformer, including in the data set the microwave lines previously observed by Hotopp et al. (2012). Pickett’s SPFIT/SPCAT program package (Pickett 1991) was used to perform the corresponding fits using a Watson’s A-reduced Hamiltonian in the Ir-representation (Watson 1977). In Table 3 we present the final set of spectroscopic constants for both conformers, which conclusively enhance the previous microwave experimental data measured in the 7.5–18.5 GHz frequency range (Hotopp et al. 2012). It is worth noticing that the frequency coverage (75–325 GHz) extends well beyond the emission maximum at the typical temperatures of hot interstellar clouds, which enables a confident search for such species in the ISM.
Finally, we present the rotational (Qr) and vibrational (Qv) partition functions of cis-gauche and cis-trans n-PrCHO separately, which are shown in Tables 4 and 5. We used SPCAT (Pickett 1991) to compute Qr’s values from first principles at the typical temperatures as applied in the JPL database (Pickett et al. 1998). We estimated the vibrational part, Qv, using a harmonic approximation and Eq. (3.60) of Gordy & Cook (1970), where only the vibrational modes below 1000 cm−1 were taken into consideration. We obtained the frequencies of the normal modes from CCSD calculations (see Table A.1). The full partition function, Qtot, is therefore the product of Qr and Qv. It should be noted that an additional conformational correction factor should be introduced in order to derive a proper estimation of the total column density (upper limit) of the molecule.
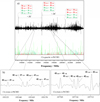 |
Fig. 2 Millimeter-wave spectrum of n-PrCHO. (a) Zoomed view of the millimeter-wave spectrum that shows the dominant quadruple degenerated lines of the cis-gauche conformer, which contains pairs of a- and b-type R-branch transitions. The final predicted spectrum of this conformer, computed for 300 K, is given for comparison (a-type lines are depicted in red, and b-type lines are depicted in green). (b) Zoomed-in view of the millimeter-wave spectrum that shows unblended quadruplets of a- and b-type R-branch transitions of the cis-trans conformer with Ka = 0,1 at J″ = 41 (left panel) and J″ = 42 (right panel). Intensity is given in arbitrary units. |
Theoretical ground-state spectroscopic constants for the two low-energy conformers of i-butanal (A-Reduction, Ir-Representation).
Experimental ground-state spectroscopic constants of cis-gauche and cis-trans n-PrCHO (A-Reduction, Ir-Representation).
Rotational and vibrational partition functions of cis-gauche n-PrCHO.
Rotational and vibrational partition functions of cis-trans n-PrCHO.
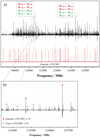 |
Fig. 3 Room-temperature millimeter-wave spectrum of i-PrCHO. (a) Portion of the spectrum showing intense a-type R-branch transitions of the gauche conformer. The final computed spectrum for this conformer, computed for 300 K, is given for comparison (a-type lines are depicted in red, b-type lines are depicted in green, and c-type lines are depicted in purple). (b) Zoomed-in view of the spectrum, showing several a-type R-branch lines belonging to trans i-PrCHO (in blue) together with some intense lines of gauche i-PrCHO (in red). Intensity is given in arbitrary units. |
4.2 Millimeter-wave Spectra of i-PrCHO
At the first stage of the spectral analysis, we employed predictions based on the spectroscopic parameters from Stiefvater (1986), including the experimental values of the electric dipolemoment components. Given that the two most stable rotameric species of i-PrCHO are near prolate asymmetric tops with nonzero µa dipole-moment component (gauche conformer: |µa| = 2.43 (2), |µb| = 0.80 (3), |µc| = 0.83 (2) Debyes, and trans conformer: |µa| = 2.82 (2), |µb| = 0.0 by Cs symmetry, |µc| = 0.46 (3) Debyes), we first explored the rich millimeter-wave spectrum to search for intense sets of a-type R-branch transitions. Also in this case, as the quantum number J increases, the rotational energy levels that involve the lowest Ka quantum numbers become closer, and pairs of a- and b-type lines form quartets, which are already blended into one quadruple-degenerated line at the high frequencies shown in Fig. 3a. After we assigned low Ka a-type transitions, we were able to locate many b-type R- and Q-branch lines, despite the relatively low value of the µb dipole moment component. Then, several c-type lines were successfully identified as well. This analysis was further extended to higher Ka R- and Q-branch transitions.
Once we finished the analysis of gauche i-PrCHO, we searched for rotational features attributable to the trans conformer. Guided by the previous experimental data (Stiefvater 1986), we managed to identify a much weaker progression of a-type R-branch transitions belonging to trans i-PrCHO (see Fig. 3b). Also, keeping in mind that this conformation belongs to the Cs molecular symmetry group, a b-type spectrum was neither expected nor observed for trans i-PrCHO. Afterward, we completed the analysis up to Ka = 12. Also, c-type lines were predicted but not observed.
In total, almost 3400 rotational transitions were measured for the gauche form of i-PrCHO up to J = 63 and Ka = 24, while only 500 transitions were recorded for the trans form, which is reasonable given that this conformer is higher in energy (see Table 2). The corresponding fits and predictions were made in terms of Watson’s A-reduced Hamiltonian in Ir-representation (Watson 1977) with the Pickett’s SPFIT/SPCAT program package (Pickett 1991). Hence, the present experimental data enabled the determination of accurate rotational constants and the full set of quartic and most of the sextic centrifugal distortion constants, showing a remarkable rms deviation of less than 25 kHz for gauche i-PrCHO. The final spectroscopic set, which is listed in Table 6, definitively improves the previous microwave experimental data (measured up to 40 GHz) by up to even four orders of magnitude (Stiefvater 1986). Also, from a comparison between the experimental and theoretically predicted parameters, we can infer that the rotational constants as well as the quartic centrifugal distortion constants are in very good agreement with the CCSD predicted ones. The line catalogs derived from the accurate spectroscopic parameters should be reliable enough for all astronomical observations. The full list of measured transitions in the laboratory for n- and i-butanal is only available at the CDS.
As reported in Sect. 4.1 for the linear isomer, in Table 7 we provide the values of the rotational (Qr) and vibrational (Qv) partition functions of gauche i-PrCHO, which are needed to obtain reliable line intensities. We computed the values of Qr from first principles up to J =150 at different temperatures, using the Pickett’s program (Pickett et al. 1998). We performed calculations at the CCSD/cc-pVTZ level of theory to obtain the frequency of the normal modes (see Table A.1). Afterward, we predicted the vibrational part, Qv, using a harmonic approximation and a simple formula that accords to Eq. (3.60) of Gordy & Cook (1970). Finally, we computed the vibrational contribution to the total partition function by taking into account the lowest vibrational modes up to 1000 cm−1. The complete partition function, Qtot, is then the product of Qr and Qr. Again, a conformational correction factor is still needed to obtain a proper estimation of the total column density (upper limit) of the molecule.
5 Search for n- and i-butanal Toward Sgr B2(N1)
5.1 Observations
The imaging spectral line survey ReMoCA toward Sgr B2(N) was carried out with ALMA during its cycle 4. Belloche et al. (2019) reported the details about the observations and data reduction of the survey. We summarize here the main features. The full frequency range from 84.1 GHz to 114.4 GHz was covered at a spectral resolution of 488 kHz (1.7 to 1.3 km s−1) with five frequency tunings. The achieved sensitivity per spectral channel varies between 0.35 mJy beam−1 and 1.1 mJy beam−1 (rms) depending on the setup, with a median value of 0.8 mJy beam−1. The phase center is located at the equatorial position (α,δ)J2000 = (17h47m19s.87, −28º22′ 16″.0), which is half-way between the two hot molecular cores Sgr B2(N1) and Sgr B2(N2). The angular resolution (half-power beam width, HPBW) ranges from ~0.3″ to ~0.8″ with a median value of 0.6″ that corresponds to ~4900 au at the distance of Sgr B2 (8.2 kpc; Reid et al. 2019). We used here an improved version of the data reduction, as described in Melosso et al. (2020).
For this work we analyzed the spectrum obtained toward the position Sgr B2(N1S) at (α,δ)J2000 = (17h47m19s.870, −28º22′19″.48). This position is offset by about 1″ to the south of the main hot core Sgr B2(N1) and was chosen by Belloche et al. (2019) because of its lower continuum opacity compared to the peak of the hot core. To analyze the spectrum ofSgr B2 (N1S), we produced synthetic spectra under the assumption oflocal thermodynamic equilibrium(LTE) using the software Weeds (Maret et al. 2011). The high densities of the regions where hot-core emission is detected in Sgr B2(N) (>1 × 107 cm−3; see Bonfand et al. 2019) justify this assumption. We derived a best-fit synthetic spectrum for each molecule separately, and then added the contributions of all identified molecules together. Each species was modeled with a set of five parameters: size of the emitting region (θs), column density (N), temperature (Trot), linewidth (∆V), and velocity offset (Voff) with respect to the assumed systemic velocity of the source, Vsys = 62 km s−1.
Experimental ground-state spectroscopic constants of gauche and trans i-PrCHO (A-Reduction, Ir-Representation).
Rotational and vibrational partition functions of gauche i-PrCHO.
5.2 Non-detection of Butanal
In order to search for n- and i-butanal toward Sgr B2(N1S), we relied on the LTE parameters derived for acetaldehyde. The latter is clearly detected in its torsional ground state and its first two torsionally excited states (see Figs. B.1–B.3). We used the spectroscopic predictions of Smirnov et al. (2014) for acetaldehyde. We selected the transitions of this molecule that are not too much contaminated by emission or absorption from other species to build a population diagram (Fig. B.4). Due to the small energy range covered by the transitions of the torsional ground state reported in this diagram and the residual contamination from unidentified species, the rotational temperature within the torsional ground state is not constrained. Only a fit taking into account the three torsional states allowed us to derive a temperature, which is found to be high, as reported in Table 8. We assumed that the torsional states are populated according to LTE, that is, that the torsional temperature is equal to the rotational temperature, and we adopted a temperature of 250 K to compute the LTE synthetic spectra shown in red in Figs. B.1–B.3. The LTE parameters derived for acetaldehyde are reported in Table 9. Given that many lines of acetaldehyde are detected with a high signal-to-noise ratio and that assuming LTE does not seem to be a limiting factor in reproducing the line intensities of this molecule, we expect that the uncertainty on its column density lies below 10%.
Assuming that the more complex aldehydes propanal and butanal trace the same region as acetaldehyde, we produced LTE synthetic spectra for these species adopting the same parameters as acetaldehyde with only the column density left as a free parameter. We employed the spectroscopic predictions derived for butanal in Sect. 4 and the predictions available in the Cologne Database of Molecular Spectroscopy (CDMS; Müller et al. 2005) for syn and gauche propanal (tag 58505 version 2 and tag 58519 version 1, respectively), which are based on Zingsheim et al. (2017). The LTE synthetic spectra of propanal and butanal were used to search for emission of these species in the ReMoCA survey toward Sgr B2(N1S). None of them is detected, as illustrated in Figs. B.5–B.9. The upper limits on their column densities are reported in Table 9. Estimating the uncertainties on these upper limits is not straightforward because of the uncertainties affecting the level of the baseline and because of the spectral confusion that leads to blends with identified or unidentified species. These uncertainties could be as high as a factor of two.
Table 9 indicates that propanal is at least ~5 times less abundant than acetaldehyde in Sgr B2(N1S). As indicated in Table 9, we get the most stringent upper limit on the column density of normal-butanal from its cis-trans (ct) conformer. We find that normal-butanal is at least ~2 times less abundant than acetaldehyde. Finally, we find that iso-butanal is at least ~6 times less abundant than acetaldehyde.
Afterward, given that our chemical model suggests that propanal and butanal may trace lower temperatures than acetaldehyde (see Sect. 7), we also computed column density upper limits assuming a temperature of 170 K instead of 250 K. This has a significant impact on the upper limits because the vibrational partition functions of propanal and butanal are a steep function of temperature in this temperature range. Under this assumption, Table 9 indicates that propanal, normal-butanal, and iso-butanal are at least 11, 6, and 18 times less abundant than acetaldehyde in Sgr B2(N1S).
Rotational temperature of acetaldehyde derived from its population diagram toward Sgr B2(N1S).
6 Search for n- and i-butanal Toward the G+0.693-0.027 Molecular Cloud
6.1 Observations
The high-sensitivity spectral survey toward the G+0.693-0.027 molecular cloud was carried out using the Yebes 40m telescope (Guadalajara, Spain) and the IRAM 30m telescope (Granada, Spain). Detailed information of the observational survey is presented in Rivilla et al. (2021a,b) and Rodríguez-Almeida et al. (2021a,b). The observations used the position switching mode, and were centered at α(J2000.0) = 17h47m22s, δ(J2000.0)= −28°21′27″, with the off position at (−885″,+290″).
6.2 Non-detection of Butanal
We implemented the spectroscopy presented in this work into the MADCUBA package1 (version 26/07/2021, Martín et al. 2019), and used the SLIM (Spectral Line Identification and Modeling) tool to generate synthetic spectra of the different conformers of butanal under the LTE assumption, which were compared with the observed spectrum. To evaluate if the transitions are blended with emission from other species, we also considered the LTE model that predicts the total contribution of the more than 120 species identified so far toward G+0.693-0.027 (e.g., Requena-Torres et al. 2008; Zeng et al. 2018; Rivilla et al. 2019, 2020, 2021a,b; Jiménez-Serra et al. 2020; Rodríguez-Almeida et al. 2021a,b).
None of the butanal conformers were clearly detected in the observed data. In most cases the transitions appear strongly blended with brighter lines of abundant species. To compute the upper limits of the column density for the different con-formers, we searched for the brightest predicted spectral features that are not blended with emission from other molecules. The transitions used for cɡ-n-C3H7CHO, ct-n-C3H7CHO, and ɡ-i-C3H7CHO are 75,2−64,3 (at 92.905774 GHz), 100,10−90,9 (at 47.6364885GHz), and 60,6−50,5 (at 38.1517752GHz), respectively. Using MADCUBA, we determined the upper limit of the column density using the 3σ value of the integrated intensity (see details in Martín et al. 2019), and the same physical parameters used for s–C2H5CHO (Table 10): Trot = 12 K, VLSR = 69 km s−1 and ∆V = 21 kms−1. Since the excitation temperatures of the molecules in G+0.693 are low (Tex = 5–20 K), we did not use the vibrational contribution of the partition function (Qv) in this case. The two conformers of n-butanal were modeled as independent species without taking into account their zero-point energy, since the low excitation temperatures in G+0.693 do not allow the relative energies of the conformers to be overcome. The derived upper limits for the two conformers of normal-butanal and for the ɡ conformer of iso-butanal are presented in Table 10. The upper limit of the lowest-energy conformer, the ct-conformer of normal-butanal, is <0.8 × 1013 cm−2.
As we did for Sgr B2(N1S), we also fitted the acetaldehyde (CH3CHO) emission toward G+0.693. The details of the analysis are presented in Appendix C, and the derived parameters are shown in Table 10.
We show in Table 11 the molecular ratios of the different aldehydes, using also the LTE results of s–C2H5CHO from Rivilla et al. (2020). The acetaldehyde/s–propanal ratio is ~7, the s-propanal/ct – n–butanal ratio is >9, and the acetaldehyde/ct-n-butanal ratio is >63. The relative molecular ratios found in G+0.693 indicate that each jump in complexity in the aldehyde family implies an abundance drop of around one order of magnitude, similarly to other chemical families such as alcohols, thiols, and isocyanates (Rodríguez-Almeida et al. 2021a,b).
Parameters of our best-fit LTE model of acetadehyde toward Sgr B2(N1S) and upper limits for propanal and butanal.
Derived physical parameters for acetaldehyde, propanal, and butanal toward the G+0.693-0.027 molecular cloud.
7 Discussion: Interstellar Chemistry of Acetaldehyde, Propanal, and Butanal
Of the three aldehydes for which column densities or upper limits are presented in Tables 9 and 10, typical astrochemical kinetics models consider only acetaldehyde. However, a treatment for the interstellar formation and destruction of propanal was included in the network of Garrod (2013), as part of a broader effort to simulate the chemistry of large organic molecules including glycine. Production of propanal could proceed through the addition of various functional-group radicals on dust-grain surfaces during the star-formation process. The network was developed further in various publications, including Garrod et al. (2017), who added the butyl cyanides, pentanes, and some associated species. The larger aldehydes were not included in that network, however. The most recent usage of this chemical network was presented by Garrod et al. (2022). In that work, new treatments of so-called non-diffusive reaction mechanisms on grain surfaces and within the dust-grain ice mantles (Jin & Garrod 2020) were applied to a full hot-core chemical simulation. This more complete treatment of grain chemistry enabled the possible production of complex organics at very cold, early times in the evolution of a hot core, as well as during the warm-up of the dust, and – where permitted by the viability of appropriate reactions – in the gas phase, following the thermal desorption of the icy dust-grain mantles.
Despite the absence of butanal from the chemical networks, the results of the Garrod et al. (2022) hot-core astrochemical kinetics models are instructive, especially in comparison with the observational results toward Sgr B2(N1S). The models showed their best agreement with other molecular abundance data from the ReMoCA survey when a long warm-up timescale (i.e., the slow model setup) was used; the same model is compared here with the present data. The peak gas-phase fractional abundance of acetaldehyde with respect to total hydrogen in the model is around 2.5 × 10⁻⁷, providing a peak ratio with gas-phase methanol of ~1:30. This value coincides exactly with the observational ratio, using the methanol column density of 2 × 1019 cm−2 provided by Motiyenko et al. (2020, see their Table 3).
Around 30% of acetaldehyde is formed on the grains prior to the desorption of the ices, of which around one-third is formed at temperatures below 20 K, mainly through surface chemistry as the ices build up. Reactions between CH2 and CO are important in producing ketene, CH2CO, which is further hydrogenated to acetaldehyde on the grain surfaces by mobile atomic H. We would also expect this cold, grain-surface mechanism to be relevant to acetaldehyde production on grains in G+0.693, where the dust temperature is <30 K (Rodríguez-Fernández et al. 2004).
In the hot-core models, some CH3CHO is also formed at intermediate temperatures (~20–100 K), as the result of photo-processing of the ices by cosmic ray-induced UV photons. However, approximately two thirds of total acetaldehyde production during the entire hot core evolution is calculated to occur in the gas phase, through the barrier-less reaction O + C2H5 → CH3CHO + H (Tsang & Hampson 1986). This reaction is fed by the release of trapped solid-phase C2H5 into the gas when the ices sublimate at temperatures greater than 100 K, while atomic O is a product of the gas-phase destruction of more stable species such as CO2 that are released at around the same time. The dominance of the gas-phase reaction in producing acetaldehyde results in a delay between the sublimation of the dust-grain ice mantles and the attainment of the peak CH3CHO abundance. Furthermore, due to the gradually increasing temperature in the model, this delay in peak abundance occurs at an elevated temperature of 257 K, which is in good agreement with the rotational temperature used in the spectral model of Sgr B2(N1S).
The chemical model indicates that propanal should reach a peak gas-phase abundance around 60 times lower than that of acetaldehyde (although the fast warm-up timescale model suggests a value closer to 10). This is consistent with the observational upper limits derived toward Sgr B2(N1S) using a rotational temperature of 250 K (we note that the chemical models do not explicitly distinguish conformers). The excitation temperature used to determine the propanal upper limit is chosen to be consistent with acetaldehyde.
Unlike the treatment for acetaldehyde, the chemical model includes only grain-surface mechanisms for the production of propanal; this solid-phase material is preserved on the grains at low temperatures, and then released into the gas phase when dust temperatures are sufficiently high to allow the thermal desorption of propanal and of other grain-surface species. Due to its direct release into the gas phase, the abundance of propanal reaches its peak at an ambient gas temperature of ~170 K, substantially lower than the 250 K assumed here for its excitation temperature, and lower than the 257 K at which acetaldehyde reaches its peak in the model. In order to test the influence on observational results of this lower temperature, which is predicated on a uniquely grain-surface origin for propanal, an excitation temperature of 170 K was also tested in the spectral analysis of Sgr B2(N1S) (see bottom part of Table 9). The model results nevertheless remain consistent with observations.
We note, however, that a a gas-phase formation route for propanal may in fact be plausible; Tsang (1988) recommends a rate of 1.6 × 10⁻¹⁰ cm3s−1 for the O + n-C3H7 reaction, identical to the recommended rate of the equivalent process for acetaldehyde production. Formation of an aldehyde is the preferred outcome in either reaction. The same rate was also proposed by Tsang (1988) for the reaction of the related radical i-C3H7, leading to acetone production.
With such a reaction for propanal included in the astrochemical model, some enhancement in the peak gas-phase abundance would be expected. By comparing the behavior of acetaldehyde and the other species in the model, it is possible to make a crude prediction as to the strength of influence of this mechanism. The models predict n-C3H7 in the ice to be around five times less abundant than C2H5 immediately prior to ice sublimation, suggesting a five times lower base rate of gas-phase propanal production versus acetaldehyde. To gauge the importance of this lower rate, it is also noteworthy that only some of the gas-phase acetaldehyde is formed through the gas-phase reaction, with the rest coming directly from the grain surfaces. On this basis it might be reasonable to expect that if gas-phase production of propanal were to dominate over any grain-surface mechanism, it would reach a maximum abundance of ~ 10% that of acetaldehyde. This crude estimate also is approximately in keeping with the upper limits toward Sgr B2(N1S).
The question then arises as to whether such a gas-phase mechanism could also produce butanal. On the assumption that it could – through the reaction of n-C4H9 with atomic oxygen – then the abundance of butanal could be comparable to that of propanal. All four of the C4H9 radicals in the network (i.e., the straight-chain and branched forms, with the radical site on either the primary or secondary carbon) achieve ice abundances similar to the C3H7 radicals. Two of these might be expected to form ketones rather than aldehydes. The other two, which would produce either n- or i-butanal, reach very similar abundances, indicating no obvious distinction between the two forms.
While gas-phase production of aldehydes may be plausible in hot cores such as Sgr B2(N1S), for G+0.693 – which is assumed to have been heated by a shock, releasing the ice mantles – the timescales available may be too short to have enabled substantial gas-phase chemistry to occur. In the fast warm-up model of Garrod et al. (2022), which has the shortest desorption timescale of their three hot-core models and the weakest gas-phase contribution to acetaldehyde production, a period on the order of 104 yr is required for gas-phase CH3CHO production to become significant following ice sublimation. The gas density is also set to a relatively high value of nH = 2 × 108 cm−3, meaning that gas-phase chemistry occurs quite rapidly when the ice mantles are released.
If the passage of a shock through G+0.693 led to compression of the gas to a density lower than the above value, then the gas-phase acetaldehyde production timescale would be longer than in the hot core model (assuming that the gas-phase production mechanisms were the same). In fact, the gas density in G+0.693 is lower, in the range 104–105 cm−3 (Zeng et al. 2020), which certainly does not favor gas-phase chemistry on short timescales. The presence of gas-phase COMs might instead be more directly related to the shock-induced sputtering of the ice mantles, releasing aldehydes into the gas phase that were already formed in the solid phase. The shock velocities are expected to be between 15 and 20 km s−1, which would be sufficient to fully erode the icy mantles of dust grains via sputtering (see Jiménez-Serra et al. 2008).
If the acetaldehyde detected toward G+0.693 was formed entirely on the grains, followed by a rapid shock-induced release, then the cold, grain-surface abundances derived from the early stages of the hot-core models may be comparable to the observed gas-phase abundances. The models suggest a purely solid-phase ratio of acetaldehyde to propanal of ~7.7. This is in excellent agreement with the observational ratio of ~7. However, it is unclear how the shock processing might further affect the subsequent gas-phase molecular abundances, so this solid-phase ratio might not be accurately reflected in the gas-phase abundances of the two aldehydes.
Regarding the possible butanal abundance in G+0.693, one may crudely consider the ratio of C2H5 radicals to C3H7 radicals within the bulk ices during the cold stages of the model (i.e., the cold collapse stage before the warm-up begins) as a proxy for the propanal to butanal ratio within the ice. In this view, production of C2H5CHO and C3H7CHO would occur through grain-surface or bulk-ice radical-addition reactions between HCO and either C2H5 or C3H7. The models suggest a C2H5:C3H7 ratio around 8 in the ice, which again comes very close to the observed upper limit for C2H5CHO:C3H7CHO.
Thus, based on estimates derived from the astrochemical models, the observational upper limits on both propanal and butanal could be very close to their true abundances toward Sgr B2(N1S) and toward G+0.693. In Sgr B2(N1S), this assumes that gas-phase production is strong. Weak gas-phase production could produce values rather lower than the upper limits. In G+0.693, the observed ratios are well reproduced without the need for gas-phase chemistry. However, we note that these ratios do not directly indicate the fractional abundances – the quantities of aldehydes produced relative to total hydrogen may vary between the two sources. Indeed the column densities measured toward Sgr B2(N1S) and G+0.693 are very different; G+0.693 may have overall lower fractional abundances of all aldehydes while maintaining a higher ratio of the larger homologs, as compared with Sgr B2(N1S).
The inclusion of these molecules in a more comprehensive gas-grain chemical network would be highly valuable in providing more accurate predictions for future observational searches.
Molecular ratios of aldehydes toward Sgr B2(N1S) and G+0.693-0.027.
8 Conclusions
We are finally starting to fill the gap between observational and laboratory data that has existed for several decades. In this context, we have investigated and analyzed the millimeter- and submillimeter-wave spectrum of n- and i-butanal from 75 to 325 GHz. With our experimental data set we can predict the rotational transitions for both isomers with narrow line widths (full width at half maximum, FWHM) of less than 0.1 km s−1 at 100 GHz, expressed in its equivalent radial velocity, which is more than enough to perform a confident astronomical search for these species. We employed the newly determined rotational parameters to prepare accurate line catalogs, which we used to search for the molecule toward the hot core Sgr B2(N1S) and the G+0.693-0.027 molecular cloud. We complemented these searches toward both sources with a comparison to shorter aldehydes. We obtained the following results:
We report a non-detection of n- and i-butanal toward Sgr B2(N1S) with ALMA. Depending on the assumed temperature, we find that propanal, n-butanal, and i-butanal are at least 5−11, 2−6, and 6−18 times less abundant than acetaldehyde, respectively.
We also report a non-detection of both isomers of butanal toward G+0.693 based on Yebes 40 m and IRAM 30 m observations. We find that propanal is seven times less abundant than acetaldehyde, while the propanal/ct-n-butanal ratio is >9 and the acetaldehyde/ct-n-butanal ratio is >63.
Finally, our astrochemical models suggest the observational upper limits on both propanal and butanal could be close to their true abundances toward Sgr B2(N1S) and G+0.693. This assumes that gas-phase production of aldehydes is dominant in Sgr B2(N1S), while in G+0.693 aldehyde production on dust grains is sufficient to reproduce observed molecular ratios. If gas-phase mechanisms are not effective in Sgr B2(N1S), then the true values could be substantially lower than the upper limits observed here.
The most stringent constraints on the relative abundances of the three aldehydes in the ISM were obtained for G+0.693-0.027. Our results show that with each incremental increase in the size of the alkyl group in the aldehyde molecule, there is a drop of approximately one order of magnitude in abundance.
Acknowledgements
The authors thank the financial fundings from Ministerio de Ciencia e Innovación (CTQ2016- 76393-P, PID2019-111396GB-I00 and PID2020-117742GB-I00), the Ministerio de Economía Industria y Competitividad (Grant AYA2017-87515-P) Junta de Castilla y León (Grants VA010G18 and Grant VA244P20), and the European Research Council under the European Union’s Seventh Framework Programme (FP/2007-2013)/ERC-2013-SyG, Grant Agreement no. 610256 NANOCOSMOS. M.S.N. acknowledges funding from the Spanish “Ministerio de Ciencia, Innovación y Universidades” under predoctoral FPU Grant (FPU17/02987). V.M.R. has received funding from the Comunidad de Madrid through the Atracción de Talento Investigador (Doctores con experiencia) Grant (COOL: Cosmic Origins Of Life; 2019-T1/TIC-15379). I.J.-S. and J.M.-P. have received partial support from the Spanish State Research Agency (AEI) through project numbers PID2019-105552RB-C41 and MDM-2017-0737 Unidad de Excelencia “María de Maeztu”- Centro de Astrobiología (CSIC-INTA). This paper makes use of the following ALMA data: ADS/JAO.ALMA#2016.1.00074.S. ALMA is a partnership of ESO (representing its member states), NSF (USA), and NINS (Japan), together with NRC (Canada), NSC and ASIAA (Taiwan), and KASI (Republic of Korea), in cooperation with the Republic of Chile. The Joint ALMA Observatory is operated by ESO, AUI/NRAO, and NAOJ. The interferometric data are available in the ALMA archive at https://almascience.eso.org/aq/. Part of this work has been carried out within the Collaborative Research Centre 956, sub-project B3, funded by the Deutsche Forschungsgemeinschaft (DFG) – project ID 184018867. R T G acknowledges support from the National Science Foundation (grant No AST 19-06489).
Madrid Data Cube Analysis on ImageJ is a software developed at the Center of Astrobiology (CAB) in Madrid; http://cab.inta-csic.es/madcuba/Portada.html
Appendix A Complementary tables
In Table A.1 we provide a list with the theoretical frequencies of the lowest vibrational modes of n- and i-PrCHO.
Theoretically predicted harmonic vibrational frequencies(a) of the vibrational modes for the lowest-energy conformers of n- and i-PrCHO.
Appendix B Complementary figures: Spectra and population diagram of Sgr B2(N1S)
Figures B.1–B.3 show the transitions of CH3CHO, vt=0, vt = 1, and vt = 2 that are covered by the ReMoCA survey and contribute significantly to the signal detected toward Sgr B2(N1S). Figure B.4 shows the population diagram of CH3CHO for Sgr B2(N1S). Figures B.5 and B.6 illustrate the non-detection of syn and gauche C2H5CHO, respectively, Figs B.7 and B.8 the non-detection of the cis-gauche and cis-trans conformers of nor-mal-C3H7CHO, respectively, and Fig. B.9 the non-detection of gauche iso-C3H7CHO, all toward Sgr B2(N1S).
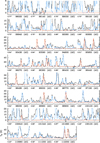 |
Fig. B.1 Transitions of CH3CHO, v = 0 covered by the ReMoCA survey. The best-fit LTE synthetic spectrum of CH3CHO, v = 0 is displayed in red and overlaid on the observed spectrum of Sgr B2(N1S), which is shown in black. The blue synthetic spectrum contains the contributions of all molecules identified in our survey so far, including the species shown in red. The central frequency and width are indicated in MHz below each panel, as is the half-power beam width. The y axis is labeled in brightness temperature units (K). The dotted line indicates the 3σ noise level. |
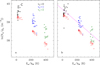 |
Fig. B.4 Population diagram of CH3CHO toward Sgr B2(N1S). The observed data points are shown in various colors (but not red), as indicated in the upper-right corner of panel a, and the synthetic populations are shown in red. No correction is applied in panel a. In panel b, the optical depth correction has been applied to both the observed and synthetic populations, and the contamination by all other species included in the full model has been removed from the observed data points. The purple line is a linear fit to the observed populations (in linear-logarithmic space). |
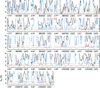 |
Fig. B.5 Same as Fig. B.1 but here the red spectrum shows the synthetic spectrum of syn-C2H5CHO, υ=0 used to derive the upper limit on its column density reported in Table 9. The blue spectrum does not contain the contribution of the species shown in red. |
Appendix C Analysis of acetaldehyde (CH3CHO) toward the G+0.693–0.027 molecular cloud
To perform the LTE analysis of CH3CHO, we selected transitions that are not blended with other molecular species and that cover a broad range of energy levels in order to constrain the excitation conditions. The transitions used in the analysis are listed in Table C.1. We used the spectroscopic predictions of Smirnov et al. (2014), as in the analysis of Sgr B2(N1S). We used MADCUBA–SLIM, leaving as free parameters the molecular column density (N), the rotational temperature Trot, the velocity (VLSR) and linewidth ∆V. The derived physical parameters are shown in Table 10, and the fits of the transitions are shown in Fig. C.1.
Selected unblended transitions of CH3CHO detected toward G+0.693−0.027 used to perform the LTE analysis.
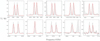 |
Fig. C.1 Selected unblended transitions of CH3CHO (see Table C.1) detected toward G+0.693−0.027 used to perform the LTE analysis. The gray histograms show the observed spectra, and the red curve is the best LTE fit obtained with MADCUBA. |
References
- Abplanalp, M. J., & Kaiser, R. I. 2019, Phys. Chem. Chem. Phys., 21, 16949 [NASA ADS] [CrossRef] [Google Scholar]
- Abplanalp, M. J., Góbi, S., Bergantini, A., Turner, A. M., & Kaiser, R. I. 2018, ChemPhysChem, 19, 556 [CrossRef] [Google Scholar]
- Alonso, E. R., Kolesniková, L., Tercero, B., et al. 2016, ApJ, 832, 42 [NASA ADS] [CrossRef] [Google Scholar]
- Alonso, E. R., McGuire, B. A., Kolesniková, L., et al. 2019, ApJ, 883, 18 [NASA ADS] [CrossRef] [Google Scholar]
- Altwegg, K., Balsiger, H., Bar-Nun, A., et al. 2016, Sci. Adv., 2, e1600285 [NASA ADS] [CrossRef] [Google Scholar]
- Aponte, J. C., Whitaker, D., Powner, M.W., et al. 2019, ACS Earth Space Chem., 3, 463 [NASA ADS] [CrossRef] [Google Scholar]
- Belloche, A., Garrod, R. T., Müller, H. S. P., et al. 2009, A&A, 499, 215 [NASA ADS] [CrossRef] [EDP Sciences] [Google Scholar]
- Belloche, A., Garrod, R. T., Müller, H. S. P., et al. 2014, Science, 345, 1584 [NASA ADS] [CrossRef] [Google Scholar]
- Belloche, A., Müller, H. S. P., Garrod, R. T., et al. 2016, A&A, 587, A91 [NASA ADS] [CrossRef] [EDP Sciences] [Google Scholar]
- Belloche, A., Meshcheryakov, A. A., Garrod, R. T., et al. 2017, A&A, 601, A49 [NASA ADS] [CrossRef] [EDP Sciences] [Google Scholar]
- Belloche, A., Garrod, R. T., Müller, H. S. P., et al. 2019, A&A, 628, A10 [NASA ADS] [CrossRef] [EDP Sciences] [Google Scholar]
- Bonfand, M., Belloche, A., Garrod, R. T., et al. 2019, A&A, 628, A27 [NASA ADS] [CrossRef] [EDP Sciences] [Google Scholar]
- Burkhardt, A. M., Long Kelvin Lee, K., Bryan Changala, P., et al. 2021, ApJ, 913, L18 [NASA ADS] [CrossRef] [Google Scholar]
- Burton, A. S., Stern, J. C., Elsila, J. E., et al. 2012, Chem. Soc. Rev., 41, 5459 [Google Scholar]
- Cernicharo, J., Agúndez, M., Cabezas, C., et al. 2021, A&A, 649, L15 [EDP Sciences] [Google Scholar]
- Daly, A., Kolesniková, L. Mata, S., & J. Alonso, J. L. 2014, J. Mol. Spectro., 306, 11 [NASA ADS] [CrossRef] [Google Scholar]
- Dunning, T. H. 1989, J. Chem. Phys., 90, 1007 [Google Scholar]
- Durig, J. R., Guirgis, G. A., Little, T. S., et al. 1989, J. Chem. Phys., 91, 738 [NASA ADS] [CrossRef] [Google Scholar]
- Dwivedi, Y., & Rai, S. B. 2008, Vibr. Spectro., 49, 278 [Google Scholar]
- Frisch, M. J., Trucks, G. W., Schlegel, H. B., et al. 2016, Gaussian 16 Revision A.03 (Gaussian Inc. Wallingford CT) [Google Scholar]
- Garrod, R. T. 2013, ApJ, 765, 60 [Google Scholar]
- Garrod, R. T., Belloche, A., Müller, H. S. P., & Menten, K. M. 2017, A&A, 601, A48 [NASA ADS] [CrossRef] [EDP Sciences] [Google Scholar]
- Garrod, R. T., Jin, M., Matis, K. A., et al. 2022, ApJS, 259, 1 [NASA ADS] [CrossRef] [Google Scholar]
- Gottlieb, C. A. 1973, Molecules in the Galactic Environment, 181 [Google Scholar]
- Gordy, W., & Cook, R. L. 1970, Microwave Molecular Spectra, Interscience Pub, Chap. III (New York), 58 [Google Scholar]
- Grimme, S. J. 2006, Chem. Phys., 124, 034108 [NASA ADS] [Google Scholar]
- Grimme, S. J., Ehrlich, S., & Goerigk, L. 2011, J. Comp. Chem., 32, 1456 [CrossRef] [Google Scholar]
- Hartwig, H., & Dreizler, H. 1996, Z. Natur. A, 51, 923 [NASA ADS] [CrossRef] [Google Scholar]
- Helgaker, T., Klopper, W., Koch, H., & Noga, J. 1997, JChPh, 106, 9639 [NASA ADS] [Google Scholar]
- Hollis, J. M., Lovas, F. J., & Jewell, P. R. 2000, ApJ, 540, L107 [Google Scholar]
- Hollis, J. M., Jewell, P. R., Lovas, F. J., et al. 2004, ApJ, 610, L21 [Google Scholar]
- Hotopp, K. M., Vara, V. V., & Dian, B. C. 2012, J. Mol. Spectro., 280, 104 [NASA ADS] [CrossRef] [Google Scholar]
- Jiménez-Serra, I., Caselli, P., Martín-Pintado, J., et al. 2008, A&A, 482, 549 [NASA ADS] [CrossRef] [EDP Sciences] [Google Scholar]
- Jiménez-Serra, I., Martín-Pintado, J., Rivilla, V. M., et al. 2020, Astrobiology, 20, 1048 [Google Scholar]
- Jin, M., & Garrod, R. T. 2020, ApJS, 249, 26 [Google Scholar]
- Jørgensen, J. K., Belloche, A., & Garrod, R. T. 2020, ARA&A, 58, 727 [Google Scholar]
- Klimkowski, V. J., Van Nuffel, P., Van Den Enden, L., et al. 1984, J. Comput. Chem., 5, 122 [CrossRef] [Google Scholar]
- Kisiel, Z., Pszczółkowski, L., Medvedev, I. R., et al. 2005, J. Mol. Spectro., 233, 231 [NASA ADS] [CrossRef] [Google Scholar]
- Kisiel, Z., Pszczółkowski, L., Drouin, B. J., et al. 2012, J. Mol. Spectro., 280, 134 [NASA ADS] [CrossRef] [Google Scholar]
- Koga, T., & Naraoka, H. 2017, Scientific Reports, 7, 636 [NASA ADS] [CrossRef] [Google Scholar]
- Kolesniková, L., Alonso, E. R., Mata, S., et al. 2017, ApJS, 233, 24 [CrossRef] [Google Scholar]
- Loomis, F. W., & Wood, R. W. 1928, Phys. Rev., 32, 223 [NASA ADS] [CrossRef] [Google Scholar]
- Loomis, R. A., Shingledecker, C. N., Langston, G., et al. 2016, MNRAS, 463, 4175 [NASA ADS] [CrossRef] [Google Scholar]
- Manigand, S., Jørgensen, J. K., Calcutt, H., et al. 2020, A&A, 635, A48 [NASA ADS] [CrossRef] [EDP Sciences] [Google Scholar]
- Maret, S., Hily-Blant, P., Pety, J., et al. 2011, A&A, 526, A47 [NASA ADS] [CrossRef] [EDP Sciences] [Google Scholar]
- Martín, S., Requena-Torres, M. A., Martín-Pintado, J., et al. 2008, ApJ, 678, 245 [CrossRef] [Google Scholar]
- Martín, S., Martín-Pintado, J., Blanco-Sánchez, C., et al. 2019, A&A, 631, A159 [Google Scholar]
- McCarthy, M. C., & McGuire, B. A. 2021, J. Phys. Chem. A, 125, 3231 [NASA ADS] [CrossRef] [Google Scholar]
- McCarthy, M. C., Lee, K. L. K., Loomis, R. A., et al. 2021, Nat. Astron., 5, 176 [Google Scholar]
- McGuire, B. A. 2022, ApJS, 259, 30 [NASA ADS] [CrossRef] [Google Scholar]
- McGuire, B. A., Burkhardt, A. M., Kalenskii, S., et al. 2018, Science, 359, 202 [Google Scholar]
- McGuire, B. A., Loomis, R. A., Burkhardt, A. M., et al. 2021, Science, 371, 1265 [Google Scholar]
- Melosso, M., Belloche, A., Martin-Drumel, M.-A., et al. 2020, A&A 641, A160 [NASA ADS] [CrossRef] [EDP Sciences] [Google Scholar]
- Motiyenko, R. A., Belloche, A., Garrod, R. T., et al. 2020, A&A, 642, A29 [NASA ADS] [CrossRef] [EDP Sciences] [Google Scholar]
- Müller, H. S. P., Schlöder, F., Stutzki, J., et al. 2005, J. Mol. Struct., 742, 215 [CrossRef] [Google Scholar]
- Piart-Goypiron, A., Baron, M. H., Belloc, J., et al. 1991, Spectrochim. Acta A: Mol. Spectro., 47, 363 [NASA ADS] [CrossRef] [Google Scholar]
- Pickett, H. M. 1991, J. Mol. Spectro., 148, 371 [NASA ADS] [CrossRef] [Google Scholar]
- Pickett, H. M., Poynter, R. L., Cohen, E. A., et al. 1998, J. Quant. Spec. Radiat. Transf., 60, 883 [Google Scholar]
- Pizzarello, S., & Shock, E. 2010, Cold Spinrg Harb. Perspect. Biol., 2, 1 [Google Scholar]
- Raghavachari, K., Trucks, G. W., Pople, J. A., & Head-Gordon, M. 1989, CPL, 157, 479 [NASA ADS] [CrossRef] [Google Scholar]
- Reid, M. J., Menten, K. M., Brunthaler, A., et al. 2019, ApJ, 885, 131 [Google Scholar]
- Remijan, A. J., Hollis, J. M., Lovas, F. J., et al. 2008, ApJ, 675, L85 [Google Scholar]
- Requena-Torres, M. A., Martín-Pintado, J., Martín, S., et al. 2008, ApJ, 672, 352 [NASA ADS] [CrossRef] [Google Scholar]
- Rivilla, V. M., Martín-Pintado, J., Jiménez-Serra, I., et al. 2019, MNRAS, 483, L114 [NASA ADS] [CrossRef] [Google Scholar]
- Rivilla, V. M., Martín-Pintado, J., Jiménez-Serra, I., et al. 2020, ApJ, 899, L28 [Google Scholar]
- Rivilla, V. M., Jiménez-Serra, I., Martín-Pintado, J., et al. 2021a, Proc. Natl. Acad. Sci. U.S.A., 118, 2101314118 [NASA ADS] [CrossRef] [Google Scholar]
- Rivilla, V. M., Jiménez-Serra, I., García de la Concepción, J., et al. 2021b, MNRAS, 506, L79 [NASA ADS] [CrossRef] [Google Scholar]
- Rodríguez-Almeida, L. F., Jiménez-Serra, I., Rivilla, V. M., et al. 2021, ApJ, 912, L11 [Google Scholar]
- Rodríguez-Almeida, L. F., Rivilla, V. M., Jiménez-Serra, I., et al. 2021, A&A, 654, L1 [CrossRef] [EDP Sciences] [Google Scholar]
- Rodríguez-Fernández, N. J., Martín-Pintado, J., Fuente, A., & Wilson, T. L. 2004, A&A, 427, 217 [NASA ADS] [CrossRef] [EDP Sciences] [Google Scholar]
- Sbrana, G., & Schettino, V. 1970, J. Mol. Spectro., 33, 100 [NASA ADS] [CrossRef] [Google Scholar]
- Smirnov, I. A., Alekseev, E. A., Ilyushin, V. V., et al. 2014, J. Mol. Spectro., 295, 44 [NASA ADS] [CrossRef] [Google Scholar]
- Snyder, L. E., Buhl, D., Zuckerman, B., et al. 1969, Phys. Rev. Lett., 22, 679 [NASA ADS] [CrossRef] [Google Scholar]
- Stanton, J. F., Gauss, J., Harding, M. E., & Szalay, P. G. 2013, CFOUR, Coupled-Cluster techniques for Computational Chemistry, a quantum-chemical program package [Google Scholar]
- Stiefvater, O. L. 1986, Z. Natur. A, 41, 483 [NASA ADS] [CrossRef] [Google Scholar]
- Tercero, B., Cuadrado, S., López, A., et al. 2018, A&A, 620, L6 [NASA ADS] [CrossRef] [EDP Sciences] [Google Scholar]
- Tsang, W. 1988, J. Phys. Chem. Ref. Data, 17, 887 [NASA ADS] [CrossRef] [Google Scholar]
- Tsang, W., & Hampson, R. F. 1986, J. Phys. Chem. Ref. Data, 15, 1087 [NASA ADS] [CrossRef] [Google Scholar]
- Watson, J. K. G. 1977, J. Mol. Spectro., 66, 500 [NASA ADS] [CrossRef] [Google Scholar]
- Woon, D. E., & Dunning, T. H. 1993, J. Chem. Phys., 98, 1358 [NASA ADS] [CrossRef] [Google Scholar]
- Zeng, S., Jiménez-Serra, I., Rivilla, V. M., et al. 2018, MNRAS, 478, 2962 [Google Scholar]
- Zeng, S., Zhang, Q., Jiménez-Serra, I., et al. 2020, MNRAS, 497, 4896 [NASA ADS] [CrossRef] [Google Scholar]
- Zingsheim, O., Müller, H. S. P., Lewen, F., et al. 2017, J. Mol. Spectro., 342, 125 [NASA ADS] [CrossRef] [Google Scholar]
All Tables
Theoretical ground-state spectroscopic constants for the low-energy n-butanal conformers (A-Reduction, Ir-Representation).
Theoretical ground-state spectroscopic constants for the two low-energy conformers of i-butanal (A-Reduction, Ir-Representation).
Experimental ground-state spectroscopic constants of cis-gauche and cis-trans n-PrCHO (A-Reduction, Ir-Representation).
Experimental ground-state spectroscopic constants of gauche and trans i-PrCHO (A-Reduction, Ir-Representation).
Rotational temperature of acetaldehyde derived from its population diagram toward Sgr B2(N1S).
Parameters of our best-fit LTE model of acetadehyde toward Sgr B2(N1S) and upper limits for propanal and butanal.
Derived physical parameters for acetaldehyde, propanal, and butanal toward the G+0.693-0.027 molecular cloud.
Theoretically predicted harmonic vibrational frequencies(a) of the vibrational modes for the lowest-energy conformers of n- and i-PrCHO.
Selected unblended transitions of CH3CHO detected toward G+0.693−0.027 used to perform the LTE analysis.
All Figures
|
Fig. 1 Structures of the lowest-energy conformations of n- and i-butanal. |
| In the text | |
|
Fig. 2 Millimeter-wave spectrum of n-PrCHO. (a) Zoomed view of the millimeter-wave spectrum that shows the dominant quadruple degenerated lines of the cis-gauche conformer, which contains pairs of a- and b-type R-branch transitions. The final predicted spectrum of this conformer, computed for 300 K, is given for comparison (a-type lines are depicted in red, and b-type lines are depicted in green). (b) Zoomed-in view of the millimeter-wave spectrum that shows unblended quadruplets of a- and b-type R-branch transitions of the cis-trans conformer with Ka = 0,1 at J″ = 41 (left panel) and J″ = 42 (right panel). Intensity is given in arbitrary units. |
| In the text | |
|
Fig. 3 Room-temperature millimeter-wave spectrum of i-PrCHO. (a) Portion of the spectrum showing intense a-type R-branch transitions of the gauche conformer. The final computed spectrum for this conformer, computed for 300 K, is given for comparison (a-type lines are depicted in red, b-type lines are depicted in green, and c-type lines are depicted in purple). (b) Zoomed-in view of the spectrum, showing several a-type R-branch lines belonging to trans i-PrCHO (in blue) together with some intense lines of gauche i-PrCHO (in red). Intensity is given in arbitrary units. |
| In the text | |
|
Fig. B.1 Transitions of CH3CHO, v = 0 covered by the ReMoCA survey. The best-fit LTE synthetic spectrum of CH3CHO, v = 0 is displayed in red and overlaid on the observed spectrum of Sgr B2(N1S), which is shown in black. The blue synthetic spectrum contains the contributions of all molecules identified in our survey so far, including the species shown in red. The central frequency and width are indicated in MHz below each panel, as is the half-power beam width. The y axis is labeled in brightness temperature units (K). The dotted line indicates the 3σ noise level. |
| In the text | |
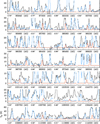 |
Fig. B.2 Same as Fig. B.1 but for CH3CHO, υ=1. |
| In the text | |
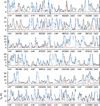 |
Fig. B.3 Same as Fig. B.1 but for CH3CHO, υ=2. |
| In the text | |
|
Fig. B.4 Population diagram of CH3CHO toward Sgr B2(N1S). The observed data points are shown in various colors (but not red), as indicated in the upper-right corner of panel a, and the synthetic populations are shown in red. No correction is applied in panel a. In panel b, the optical depth correction has been applied to both the observed and synthetic populations, and the contamination by all other species included in the full model has been removed from the observed data points. The purple line is a linear fit to the observed populations (in linear-logarithmic space). |
| In the text | |
|
Fig. B.5 Same as Fig. B.1 but here the red spectrum shows the synthetic spectrum of syn-C2H5CHO, υ=0 used to derive the upper limit on its column density reported in Table 9. The blue spectrum does not contain the contribution of the species shown in red. |
| In the text | |
 |
Fig. B.6 Same as Fig. B.5 but for gauche-C2H5CHO, υ=0. |
| In the text | |
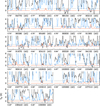 |
Fig. B.7 Same as Fig. B.5 but for cis-gauche normal-C3H7CHO, υ=0. |
| In the text | |
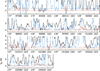 |
Fig. B.8 Same as Fig. B.5 but for cis-trans normal-C3H7CHO, υ=0. |
| In the text | |
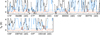 |
Fig. B.9 Same as Fig. B.9 but for gauche iso-C3H7CHO, υ=0. |
| In the text | |
|
Fig. C.1 Selected unblended transitions of CH3CHO (see Table C.1) detected toward G+0.693−0.027 used to perform the LTE analysis. The gray histograms show the observed spectra, and the red curve is the best LTE fit obtained with MADCUBA. |
| In the text | |
Current usage metrics show cumulative count of Article Views (full-text article views including HTML views, PDF and ePub downloads, according to the available data) and Abstracts Views on Vision4Press platform.
Data correspond to usage on the plateform after 2015. The current usage metrics is available 48-96 hours after online publication and is updated daily on week days.
Initial download of the metrics may take a while.