Fig. 3
Download original image
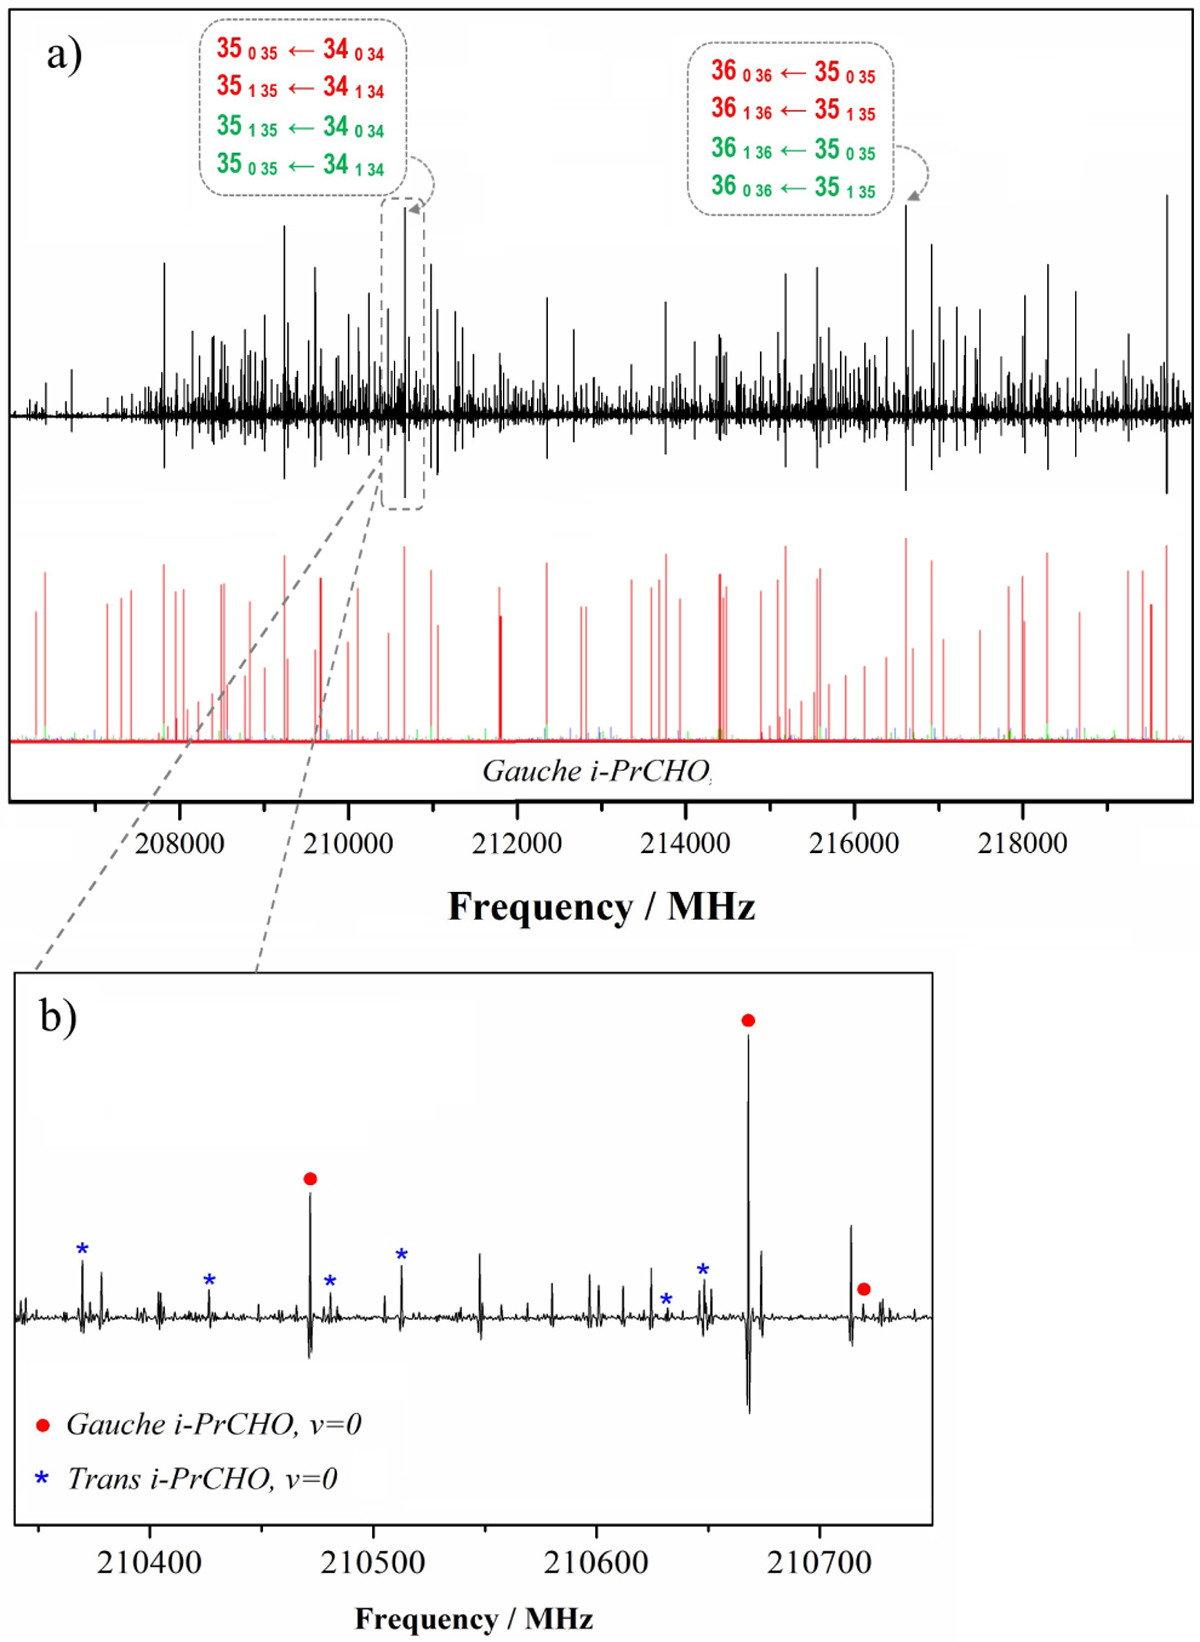
Room-temperature millimeter-wave spectrum of i-PrCHO. (a) Portion of the spectrum showing intense a-type R-branch transitions of the gauche conformer. The final computed spectrum for this conformer, computed for 300 K, is given for comparison (a-type lines are depicted in red, b-type lines are depicted in green, and c-type lines are depicted in purple). (b) Zoomed-in view of the spectrum, showing several a-type R-branch lines belonging to trans i-PrCHO (in blue) together with some intense lines of gauche i-PrCHO (in red). Intensity is given in arbitrary units.
Current usage metrics show cumulative count of Article Views (full-text article views including HTML views, PDF and ePub downloads, according to the available data) and Abstracts Views on Vision4Press platform.
Data correspond to usage on the plateform after 2015. The current usage metrics is available 48-96 hours after online publication and is updated daily on week days.
Initial download of the metrics may take a while.