| Issue |
A&A
Volume 666, October 2022
|
|
|---|---|---|
| Article Number | A82 | |
| Number of page(s) | 9 | |
| Section | Interstellar and circumstellar matter | |
| DOI | https://doi.org/10.1051/0004-6361/202142024 | |
| Published online | 11 October 2022 | |
Type IIP supernova SN2016X in radio frequencies
Racah Institute of Physics. The Hebrew University of Jerusalem.
Jerusalem
91904, Israel
e-mail: This email address is being protected from spambots. You need JavaScript enabled to view it.
Received:
15
August
2021
Accepted:
11
April
2022
Abstract
Context. The study of radio emission from core-collapse supernovae (SNe) probes the interaction of the ejecta with the circumstellar medium (CSM) and reveals details of the mass-loss history of the progenitor.
Aims. We report observations of the type IIP supernova SN 2016X during the plateau phase, at ages between 21 and 75 days, obtained with the Karl G. Jansky Very Large Array (VLA) radio observatory.
Methods. We modelled the radio spectra as self-absorbed synchrotron emission, and we characterised the shockwave and the mass-loss rate of the progenitor. We also combined our results with previously reported X-ray observations to verify the energy equipartition assumption.
Results. The properties of the shockwave are comparable to other type IIP supernovae. The shockwave expands according to a self-similar law R ∝ tm with m = 0.76 ± 0.08, which is notably different from a constant expansion. The corresponding shock velocities are approximately 10700–8000 km s−1 during the time of our observations. The constant mass-loss rate of the progenitor is Ṁ = (7.8 ± 0.9) × 10−7 α−8/19 (ϵB/0.1)−1 M⊙ yr−1, for an assumed wind velocity of 10 km s−1. We observe spectral steepening in the optically thin regime at the earlier epochs, and we demonstrate that it is caused by electron cooling via the inverse Compton effect. We show that the shockwave is characterised by a moderate deviation from energy equipartition by a factor of ϵe/ϵB ≈ 28, being the second type IIP supernova to show such a feature.
Key words: stars: mass-loss / supernovae: general / supernovae: individual: ASASSN-16at, SN 2016X / circumstellar matter / galaxies: individual: UGC 08041 / radio continuum: general
© R. Ruiz-Carmona et al. 2022
 Open Access article, published by EDP Sciences, under the terms of the Creative Commons Attribution License (https://creativecommons.org/licenses/by/4.0), which permits unrestricted use, distribution, and reproduction in any medium, provided the original work is properly cited.
This article is published in open access under the Subscribe-to-Open model. This email address is being protected from spambots. You need JavaScript enabled to view it. to support open access publication.
1 Introduction
Massive stars experience mass loss via stellar winds or due to eruptive events that can produce enhanced mass-loss rates towards the end of their lives (Foley et al. 2007; Pastorello et al. 2007; Smith et al. 2010; Margutti et al. 2014b; Moriya et al. 2014; Ofek et al. 2014; Bruch et al. 2021; Strotjohann et al. 2021). Mass loss enriches the circumstellar medium (CSM), affects the subsequent evolution of the star, and influences the phenomenology of some supernovae depending on the amount of mass lost at the moment of explosion (e.g. Smith et al. 2009; van Loon 2010).
These massive stars die in core-collapse supernova (SN) explosions, once their cores cannot be supported by thermonuclear reactions (see Smartt 2015 for a review). SN explosions eject large amounts of mass at high velocities, that collide with the pre-existing CSM and produce shocks, which in turn accelerate particles to relativistic velocities and enhance the local magnetic field. As a result, synchrotron radiation is generated, which can be prominent in radio and X-ray wavelengths (Chevalier 1982). Conversely, this emission can be used to constrain the mass-loss history of the progenitor, and this provides key information on the latest stages of stellar evolution.
The radio emission from SNe has been theoretically modelled (Chevalier 1982, 1998; Weiler et al. 2002; Chevalier et al. 2006), and observationally studied in several cases (e.g. Weiler et al. 1990; Chevalier 1998; Stockdale et al. 2003; Ryder et al. 2004; Soderberg et al. 2005; Horesh et al. 2013a; Margutti et al. 2014a; Corsi et al. 2014; Bietenholz et al. 2021). Radio observations at early phases after the SN explosion, in combination with X-ray observations, have revealed properties of the CSM shock, provided estimates of the mass-loss rate of the progenitor, and constrained the fraction of post-shock energy converted to particle acceleration and magnetic field amplification (e.g. Soderberg et al. 2010; Horesh et al. 2013a,b, 2020; Margutti et al. 2014a; Yadav et al. 2014; Kamble et al. 2016).
Type IIP SNe (SNe IIP) are the most abundant SN explosions; over half of all core-collapse SNe in several volume-limited samples are SNe IIP (Smartt 2009 and references therein). SNe IIP exhibit a long plateau phase in the optical light curve, associated with the hydrogen envelope of the progenitor star. The progenitors of SNe IIP are red supergiant stars (RSGs; Chevalier et al. 2006). RSGs are characterised by masses in the range 8–25 M⊙ and radii in the range 500–1500 R⊙ (Heger et al. 2003; Hirschi et al. 2004; Chevalier 1976; Arnett 1980), although pre-explosion imaging has only identified progenitors towards the lower mass so far (Van Dyk et al. 2003; Li et al. 2005; Maund & Smartt 2005). RSGs are believed to sustain slow winds that drive moderate mass loss at rates Ṁ = 10−6−10−4 M⊙ with a wind velocity of approximately ω ≈ 10 km s−1 (Smith 2014). However, the mass loss from these stars has been measured empirically in a small number of cases.
In this paper we present radio observations of the type IIP supernova SN 2016X. We model the radio spectra with the standard SN–CSM interaction model (Chevalier 1981) and derive the properties of the shock and the mass-loss rate of the progenitor.
The paper is structured as follows. In Sect. 2 we summarise the previously published results on SN2016X. In Sect. 3 we present our radio observations in detail. In Sect. 4 we then describe the SN–CSM interaction model and analyse the radio spectra to characterise the shock and calculate the mass-loss rate of the progenitor. Electron cooling and its effects are discussed in Sect. 5, while in Sect. 6 we discuss the possible deviation from the energy equipartition assumption. Finally, we discuss our results and summarise our conclusions in Sect. 7.
2 SN 2016X
SN2016X was discovered on 20.6 January 2016 by the All Sky Automated Survey for SuperNovae (ASASSN-16at; Bock et al. 2016), and classified as a SN IIP using optical spectroscopy acquired within the first three days after discovery (Hosseinzadeh et al. 2016; Zheng & Zhang 2016). The adopted time of the explosion is 18.9 January 2016 (MJD = 57 405.92 ± 0.57; Huang et al. 2018), based on a non-detection (V > 18.0 mag) on 18.4 January and a first detection (V ~ 16.6 mag) on 19.5 January. The host galaxy, UGC 08041, is at a distance of 15.2 Mpc (Tully-Fisher distance, Sorce et al. 2014), and we adopt this as the distance to SN 2016X.
Huang et al. (2018) and Bose et al. (2019) present high-cadence optical and ultraviolet light curves and spectra from the early phases after explosion until the nebular phase. The radius of the progenitor star, as revealed by the rise time, is in the range 860–990 R⊙ (Gall et al. 2015). Using mass-radius relations for RSGs, the mass of the progenitor is estimated to be 18.5–19.7 M⊙. The quasi-bolometric luminosity is comparable to other SNe IIP, but it declines quickly during the plateau phase. The study of absorption features in the spectral lines Hα, Hβ, and Fe II 5169, 5018, and 4924 Å shows that photospheric velocities are high compared to other SNe IIP such as SN 1999em and SN 2005cs, but are comparable to SN 2013ej and SN 2014cx (Leonard et al. 2002; Pastorello et al. 2009; Huang et al. 2015, 2016), evolving rapidly from ~9000 km s−1 at t = 20 days to ~6000 km s−1 at t =80 days for Hα.
SN 2016X was also observed in X-rays with the Neil Gehrels Swift Observatory and the Chandra X-ray Observatory in the 0.3–10 keV energy band. The observed X-ray luminosity was LX ~ 2.5 × 1039 erg s−1 at t ~2–5 days, and declined by a factor of 5 by t ~ 19 days (Bose et al. 2019). The count rate is too low to perform any spectral analysis on the X-ray observations.
Finally, it is noteworthy that SN2016X showed double-peaked Balmer lines with strong asymmetries during the nebular phase. This phenomenology has been associated with bipolar ejecta or aspherical distribution of the CSM (Bose et al. 2019; Utrobin & Chugai 2019), and possibly with the formation of dust in the ejecta (Inserra et al. 2011; Bose et al. 2019).
3 Observations
We observed SN2016X (α = 12h 55m 15s.61, δ = 12° 05′ 59″.35, J2000) with the National Radio Astronomy Observatory (NRAO) Karl G. Jansky Very Large Array (VLA) under the programme 15B-395 (PI: A. Horesh). Observations were acquired at four epochs: 9.50 February, 15.47 February, 2.56 March, and 3.84 April 2016, which correspond to 21.58, 27.55, 43.54, and 75.42 days after the explosion, adopting the ephemeris of the explosion by Bose et al. (2019). Observations were carried out in bands S (2–4 GHz), C (4–8GHz), X (8–12GHz), Ku (12–18 GHz), and K (18–26 GHz) in the three later epochs, while only C- and K-band observations were obtained in the first epoch. The antenna array was in configuration C.
We reduced the observational data with the Common Astronomy Software Applications package (CASA; McMullin et al. 2007). The reduction was done manually, as additional flagging was needed in most bands. The radio sources J 1246–0730 and 3C 286 were used as phase and flux calibrators, respectively. We imaged the field of SN 2016X in several sub-bands depending on the signal-to-noise ratio of the detection and the predominance of radio frequency interference (RFI) using the task CLEAN interactively. We extracted the flux of the source by fitting a two-dimensional Gaussian with the task IMFIT, and we added in quadrature the contribution of three factors to estimate the error bars on the flux: (a) the error provided by the fitting routine, (b) the RMS of the image estimated in an empty region around the source, and (c) 10% of the peak flux to account for calibration errors. We adopted three times the RMS of the image as a 3σ upper limit on the flux for non-detections. In the S -band images, SN 2016X appears embedded in the side lobe of a bright source in the field. We do not use the S-band data in this work since the extracted flux in that band is artificially high. A summary of the observations is presented in Table 1, and images at 4.8 and 22.0 GHz are represented in Fig. 1.
4 Analysis of radio observations
We use the SN–CSM interaction model by Chevalier (1981) to study the radio emission from SN 2016X. We make the following assumptions in our analysis: (i) we model the radio flux as self-absorbed synchrotron radiation, as described in Chevalier (1998) and Chevalier et al. (2006), although we note that other absorption mechanisms such as free-free absorption by ionised gas may also play a role in the case of SNe IIP (see Sect. 4.3); (ii) we assume that the density profile of the CSM decreases with radius as ρCSM ∝ R−2; (iii) we assume that only half of the spherical volume inside the radius R is contributing to the radio emission at all times (i.e. the filling factor is f = 0.5); (iv) we do not include the effects of electron cooling in our modelling; and (v) we assume that there is energy equipartition between particles and fields, that is, the fraction of the post-shock energy converted into particle acceleration, ϵe, and the fraction of the post-shock energy converted into magnetic field amplification, ϵB, are equal and approximately 0.1. Therefore, the equipartition parameter α becomes unity (α ≡ ϵe/ϵB = 1). We note that deviations from the assumptions above will affect the shockwave and mass-loss estimates, as we investigate in Sects. 5 and 6.
The energy distribution of the relativistic electrons follows a power law, N(E) = N0E−γ, where E is the electron energy and N0 is a constant. Under the energy equipartition assumption we can relate the constant N0 and the magnetic field strength, B,
 (1)
(1)
where El = 0.51 MeV is the rest mass energy of the electron.
The complete expression that describes the synchrotron emission from SNe is given in Eq. (1) of Chevalier (1998). The observable flux in the optically thick regime is
 (2)
(2)
and in the optically thin regime yields
 (3)
(3)
Here c1 is a constant (Chevalier 1998); c5 and c6 are functions of the electron energy distribution power-law index γ (Pacholczyk 1970); D is the distance to the supernova; R is the radius of the forward shock; B is the magnetic field strength; and f is the filling factor. The spectral slope in the optically thin part of the spectrum, β, is a function of the electron energy distribution power-law index: β = −(γ − 1)/2.
It can be seen from Eqs. (2) and (3) that the transition from optically thick to optically thin emission creates a peak in the spectrum. By characterising the observed spectral peak by its frequency, νpeak, and its flux, Fpeak, we can obtain the following expressions for the radius of the shock and the magnetic field strength (in cgs units, see Chevalier 1998):
 (4)
(4)
 (5)
(5)
The mass-loss rate of the progenitor, Ṁ, divided by the wind velocity, ω, can be calculated using the fact that the magnetic energy density is a fraction ϵB of the post-shock energy,
 (6)
(6)
where ρCSM = Ṁ/4πω R2 is the density of the CSM, and Vsh is the expansion velocity of the shock. Assuming constant expansion velocity (Vsh = R/t), and using Eqs. (5) and (6), we obtain
 (7)
(7)
Summary of radio observations of SN 2016X.
4.1 Single-epoch spectral modelling
In this section we analyse the radio spectrum for individual epochs. The free parameters of the SN–CSM interaction model (Chevalier 1998) are the power-law index of the electron energy distribution, γ; the radius of the forward shock, R; and the magnetic field strength, B. Theoretical considerations and observations of other SNe IIP indicate that γ ≈ 3.0 (e.g. Chevalier 1998 and references within). This implies that the spectral index in the optically thin regime equals β = −1, although steepening of the spectral slope is possible due to electron cooling. Since the simple SN–CSM interaction model described in Chevalier (1998) does not account for electron cooling, any modelling of a spectral index steeper than β = −1 when cooling is in effect may incorrectly point to large values of the electron energy distribution power-law index, γ. Since our analysis suggests that electron cooling is important for SN 2016X, as we demonstrate in Sect. 5, we fix the electron energy distribution power-law index to γ = 3.0, and fit for the optically thin spectral index, β, instead. Transforming Eq. (1) of Chevalier (1998), our model reads
![Mathematical equation: ${F_v} = {{\pi {c_5}} \over {{c_6}}}{{{R^2}} \over {{D^2}}}{B^{ - 1/2}}{\left( {{v \over {2{c_1}}}} \right)^{5/2}}\left[ {1 - \exp {{\left( { - {v \over {{v_1}}}} \right)}^{\beta - 5/2}}} \right],$](/articles/aa/full_html/2022/10/aa42024-21/aa42024-21-eq8.png) (8)
(8)
where ν1 is the frequency at which the optical depth equals unity for self-absorbed synchrotron:
 (9)
(9)
We implement a Markov chain Monte Carlo (MCMC) algorithm sampling over the optically thin spectral index, β, the radius of the shock, R, and the magnetic field strength, B. We determine the best values and the error bars of the free parameters from the posterior probability distributions. We also estimate the confidence intervals of the frequency and flux of the spectral peak from the Markov chains. The velocity of the shock is calculated assuming constant expansion, Vsh = R/t, and the ratio of the mass-loss rate to the wind velocity is calculated with Eq. (7). The results of the analysis of individual epochs are gathered in Table 2, and the best-fit models are represented in Fig. 2.
We note that the optically thick part of the spectrum and the spectral peaks in the later epochs, especially the fourth one, are not well constrained by the modelling, which results in larger error bars in the estimates of the physical quantities. We observe a steepening of the spectral slope β in the first three epochs, while the spectral index approaches the expected value β ≈ −1 in the last epoch, which we interpret as a consequence of electron cooling (see Sect. 5). The radius of the shock expands from R ≈ 2.6 × 1015 cm at t = 21.6 days to R ≈ 5.0 × 1015 cm at t = 75.4 days. The resulting shock velocities, assumed constant in this section (Vsh = R/t), are in the range 13 900–7800 km s−1, and are higher than for other SNe IIP observed at ages between 8 and 81 days, which typically show expansion velocities below 10 000 km s−1 (e.g. Beswick et al. 2005b; Chevalier et al. 2006; Yadav et al. 2014). The high expansion velocities we obtained can indicate that the free expansion phase, where R ∝ t, does not extend to the time of our observations. Our estimates of the shock radius are compatible with a power law R ∝ tm with index m = 0.8 ± 0.1, excluding the last epoch. Finally, we obtain a weighted average mass-loss rate of Ṁ = (4.4 ± 0.3) × 10−7 M⊙ yr−1, for an assumed wind velocity of ω = 10 km s−1.
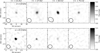 |
Fig. 1 Images of SN2016X at the four epochs of our observations, obtained at 4.8GHz (top row) and 22.0GHz (bottom row). The flux on the images is indicated by the colour bars on the right, and the beam size is represented at the bottom left of every image. |
Results of the single-epoch spectral analysis.
4.2 Multiple-epoch spectral modelling
In this section we analyse the radio spectra at all epochs including expressions for the temporal evolution of the radius of the shock and the magnetic field. We assume that the electron energy distribution power-law index (γ = 3) and the filling factor (f = 0.5) remain constant for the entire evolution of the supernova, as observations have shown in other SNe (e.g. Weiler et al. 1991).
We introduce a self-similar solution for the evolution of the radius of shock, R = R0 (t/t0)m, where m is a number between 2/3 and 1 (Chevalier 1982). We also introduce a self-similar solution for the evolution of the magnetic field: B = B0 (t/t0)−b. The value of the exponent b is indicative of the amplification mechanism of the magnetic field: b ≈ 1 points towards turbulent motions in the shocked regions, while b ≈ m implies compression of the circumstellar magnetic fields (Chevalier 1982).
We implement a Markov chain Monte Carlo algorithm, sampling over the spectral slope at individual epochs, β, the parameters describing the temporal evolution of the radius of the shock, R0 and m, and the parameters describing the temporal evolution of the magnetic field, B0 and b. We evaluate R0 and B0 at the first epoch of our observations by fixing t0 to t = 21.6 days. We estimate the values and the error bars of the free parameters from the posterior probability distributions, for which we obtain R0 = (2.6 ± 0.1) × 1015 cm,  , B0 = (1.25 ± 0.06) G, and b = 1.00 ± 0.06 (with a χ2 = 7.8 and degrees of freedom =27). We also derive the features of the spectral peaks at individual epochs from the Markov chains. We estimate the magnetic field strength, the shock radius and the expansion velocity from their temporal evolution (Vsh = dR/dt = R0 m tm−1 for the shock velocity). We calculate the ratio of the mass-loss rate to the wind velocity with a modified version of Eq. (7) that includes a factor m−2 to account for the evolution of the shock radius. The results of the multiple-epoch analysis are summarised in Table 3, and the best-fit model is represented in Fig. 3.
The results of the multiple-epoch analysis are similar to those in Sect. 4.1, except for the slower expansion velocities in the range 10700–8000 km s−1. The temporal evolution of the magnetic field (b ≈ 1) suggests that turbulent motions are responsible for the amplification mechanism. We obtain a weighted average mass-loss rate of Ṁ = (7.8 ± 0.9) × 10−7 M⊙ yr−1, taking into account the error bars and for an assumed wind velocity of ω = 10 km s−1. We also observe spectral steepening during the first three epochs (see Sect. 5). Since the spectral peaks are more tightly constrained with the multiple-epoch analysis and the error bars are generally lower, we use the results of this section in Sects. 5 and 6.
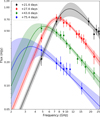 |
Fig. 2 Single-epoch spectral modelling of SN2016X. The shaded regions represent the 1σ confidence intervals of the best models. |
4.3 Absorption mechanism
Radio emission from SNe is affected by absorption at early times. Our radio model presented in Sect. 4 includes self-absorbed synchrotron radiation, but free-free absorption by ionised gas in the CSM can also play an important role. Here we investigate the significance of the free-free absorption for SN2016X.
Free-free absorption has been studied in detail (e.g. Chevalier 1982; Weiler et al. 2002; Chevalier & Fransson 2006), and examined for individual SNe on several occasions (e.g. Horesh et al. 2012; Nayana et al. 2018). The optical depth for free-free absorption is calculated as
 (10)
(10)
where Te is the temperature of the electrons in the CSM, the frequency is expressed in GHz, and EM is the integral of the square of the electron density along the line of sight expressed in cm−6 pc, known as emission measure. The EM from a radius, R, to infinity can be calculated as
 (11)
(11)
where n0 is the electron density at radius R0.
Expressing n0 as a function of Ṁ/ω and substituting the radius by its time evolution solution found in Sect. 4.2 (R = R0(t/t0)m), the free-free optical depth becomes
 (12)
(12)
where we use Te = 105 K (Lundqvist & Fransson 1988, Chevalier et al. 2006). For our first epoch, we obtain τffa[ν = 4.8, 8.4, 22.0 GHz] = [0.018, 0.006, 0.001], which shows that the free-free optical depth is not relevant for our observations of SN2016X.
5 Electron cooling
Relativistic electrons can undergo synchrotron or inverse Compton cooling, and affect the spectra and light curves of SNe. In particular inverse Compton cooling can be important for some SNe IIP during the plateau phase due to the high density of photospheric photons (Chevalier et al. 2006). Our spectral analysis in Sect. 4 suggests that electron cooling may be significant for SN 2016X; therefore, we study the characteristic timescales and frequencies of the cooling mechanisms in this section.
First, we compare the timescales of synchrotron and the inverse Compton cooling, tsynch and tIC, to the timescale of the expansion of the radio-emitting shell, tSN. We use Eqs. (5) and (6) from Chevalier et al. (2006),
 (13)
(13)
 (14)
(14)
where Lbol is the bolometric luminosity of the supernova in erg s−1, the velocity of the shock is expressed in km s−1, the ratio of the mass-loss rate to the wind velocity is expressed in M⊙ yr−1/km s−1, times are expressed in days, and frequencies are expressed in GHz. We approximate the bolometric light curve presented in Huang et al. (2018) by a power law, Lbol(t) ∝ tδ, with δ = −0.59, between phases t = 30 days (Lbol(30) = 6.3 × 1041 erg s−1)and t = 80 days (Lbol(80) = 3.5 × 1041 erg s−1). Assuming ϵB = 0.1, we obtain tsynch/tSN ≈ 2.4–9.5 and tIC/tSN ≈ 0.4–1.7 for the frequencies and the times of our observations (ν = 4.8–22.0GHz, t = 21.6–75.4 days). We note that the shorter cooling timescales are obtained at earlier times and higher frequencies. These timescales indicate that inverse Compton cooling can be important for SN 2016X, which in turn may indicate low values of the mass-loss rate, Ṁ, and ϵB (Chevalier et al. 2006).
Second, we estimate the cooling frequencies for both mechanisms. The synchrotron cooling frequency is
 (15)
(15)
where me and qe are the mass and charge of the electron, c is the speed of light, σT is the Thomson cross-section, and all variables are expressed in cgs units. The inverse Compton cooling frequency is
 (16)
(16)
where the bolometric luminosity is expressed in erg s−1, the velocity of the shock is expressed in km s−1, and the ratio of the mass-loss rate to the wind velocity is expressed in M⊙ yr−1/km s−1.
We obtain characteristic synchrotron cooling frequencies above νsynch ≳ 200 GHz for all our epochs, so our observations are not affected by synchrotron cooling. We obtain inverse Compton cooling frequencies in the range νIC = 2.8–14.7 GHz, which can affect our observations. We interpret the steepening of the optically thin spectral index at the earlier epochs, especially at t = 27.6 days for which β ≈ −1.4, as the signature of inverse Compton cooling in the radio spectrum.
Results of the multiple-epoch spectral analysis.
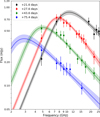 |
Fig. 3 Multiple-epoch spectral modelling of SN2016X. The shaded regions represent the 1σ confidence intervals of the best model. |
6 X-ray emission and energy equipartition
In this section we study the origin of the X-ray emission from SN 2016X, and we combine the X-ray data with our radio analysis results to verify the energy equipartition assumption. We use the X-ray luminosity registered by Chandra,  in the 0.3–10 keV band at phase t = 18.9 days (Bose et al. 2019), and we assume that the X-ray luminosity remains constant until the time of our first radio observations at t = 21.6 days.
First, we consider thermal emission from the circumstellar and reverse shocks as the source of the X-ray emission. We estimate the temperatures behind the circumstellar shock, Tcs, and the reverse shock, Trs, as (Fransson et al. 1996)
![Mathematical equation: ${T_{{\rm{cs}}}} = 22.7{m^2}V_{{\rm{sh}}}^2 = 1.5_{ - 0.5}^{ + 0.7} \times {10^9}{\rm{K}}\,[m = 0.76],$](/articles/aa/full_html/2022/10/aa42024-21/aa42024-21-eq77.png) (17)
(17)
![Mathematical equation: ${T_{{\rm{rs}}}} = {\left( {1 - {1 \over m}} \right)^2}{T_{{\rm{cs}}}} = 1.5_{ - 1.1}^{ + 3.0} \times {10^8}{\rm{K}}\,\,[m = 0.76],$](/articles/aa/full_html/2022/10/aa42024-21/aa42024-21-eq78.png) (18)
(18)
where m is the exponent of the evolution of the shock radius (R ∝ tm), and Vsh is expressed in km s−1.
With these temperatures, we calculate the X-ray emission per unit energy (Eqs. (8) and (9) from Chevalier et al. 2006),
 (19)
(19)
 (20)
(20)
in erg s−1 keV−1 units. Here EX = 4.9 keV is the average energy of the X-ray photon, the temperatures are expressed in 109 K units, the ratio of the mass-loss rate to the wind velocity is expressed in M⊙ yr−1/km s−1, the velocity of the shock is expressed in km s−1, and the age of the SN is expressed in days. Adding these two contributions, we obtain a thermal X-ray emission of ~6.8 × 1035erg s−1 keV−1, for which the uncertainty is dominated by the estimates of the temperatures. This can roughly account for 1% of the X-ray emission observed with Chandra.
X-ray thermal emission can be absorbed by a dense shell of cool low-ionised plasma in the contact discontinuity region if the reverse shock is radiative (Fransson et al. 1996). Radiative reverse shocks are plausible when the supernova presents large density gradients (i.e. n ≳ 9 with ρSN ∝ R−n), but we find n = (2m − 3)/(m − 1) ≈ 6.2 for SN2016X. Moreover, the presence of a layer of cool absorbing plasma also requires short cooling times for free-free emission behind the reverse shock; however, for SN 2016X we find
 (21)
(21)
We therefore conclude that absorption of X-ray emission from the reverse shock is not relevant for SN 2016X.
Since the thermal emission cannot explain the observed X-ray flux alone, we consider emission via inverse Compton scattering of photospheric photons. The X-ray emission per unit energy due to inverse Compton scattering is (Eq. (11) from Chevalier et al. 2006)
 (22)
(22)
where Γmin is the minimum Lorentz factor of the electron population, and Lbol = 1042 erg s−1 is the bolometric luminosity at t = 21.6 days (Huang et al. 2018). We assume that the minimum Lorentz factor is Γmin = 1 as the population of non-relativistic electrons can be significant for all subtypes of SNe II (Chevalier & Fransson 2006). We obtain an X-ray luminosity via inverse Compton scattering of 6.2 × 1036 erg s−1 keV−1, which accounts for approximately 14% of the observed emission with Chandra. We note that the X-ray luminosity could have decreased at the epoch of our first radio observations. We also note that these calculations are sensitive to the energy equipartition assumption as a deviation from equipartition leads to an underestimation of the mass-loss rate divided by the wind velocity.
Hence, we investigate potential deviations from energy equipartition combining the X-ray and radio observations. From Eqs. (5) and (6) it can be seen that
 (23)
(23)
Using the results of Sect. 4.2, we obtain S* = 5.2 × 10¹² g cm−1. Assuming that inverse Compton cooling is responsible for the observed X-ray flux, we can rewrite Eq. (22) substituting the mass-loss rate term by S*,
 (24)
(24)
from which we can obtain the ratio α = ϵe/ϵB. For Γmin = 1,
 (25)
(25)
we obtain α = 28.4, and assuming ϵe = 0.1, we get ϵB = 0.0035. This result represents a moderate departure from the energy equipartition assumption compared to other SNe where α ≳ 100, such as SN 2011dh (Soderberg et al. 2012; Horesh et al. 2013b), SN 2012aw (Yadav et al. 2014), or SN 2020oi (Horesh et al. 2020). This deviation from the energy equipartition assumption implies that our radio analysis overestimated the shock radii by ~19%, and the magnetic field strengths by a factor of ~2, and underestimated the ratio of the mass-loss rate to the wind velocity by a factor of ~6.9.
7 Discussion
7.1 Radio analysis
We presented radio observations of the type IIP supernova SN 2016X obtained with the VLA. We performed a spectral analysis of these observations using the SN–CSM interaction model and modelling the emission as self-absorbed synchrotron radiation. We modelled both individual epochs and multiple epochs introducing self-similar solutions for the evolution of the radius of the shock and the magnetic field. The results of the two analyses are compatible with each other, although the multiple-epoch analysis better constrains the spectral peaks, which is expected given the limited number of data points for individual epochs.
The expansion properties of SN2016X are comparable to other SNe IIP. We calculated from the multiple-epoch analysis that the radius of the shock expands from (2.6 ± 0.1) × 1015 cm to (6.7 ± 0.7) ×1015 cm during the epochs of our observations, evolving according to a power law, R ∝ tm, with index  . The resulting expansion velocities are between 10700 ± 1100 km s−1 and 8000 ± 1700 km s−1. The expansion velocities are slightly higher than for other SNe IIP observed at the same ages (e.g. Chevalier et al. 2006), although this result depends on the equipartition assumption. The observed evolution of the magnetic field can be explained by the turbulent motion of particles in the shocked regions.
Assuming a wind velocity of ω = 10 km s−1 and a self-similar temporal evolution of the shock, we obtained a mass-loss rate of Ṁ = (7.8 ± 0.9) × 10−7 α−8/19 (ϵB/0.1)−1 M⊙ yr−1. This mass-loss rate is compatible with the expectations of RSGs and comparable to other SNe IIP, such as SN 1999gi (Schlegel 2001), SN 2004dj (Nayana et al. 2018), or SN 2011ja (Chakraborti et al. 2013), if equipartition is assumed.
We assessed the significance of free-free absorption by estimating the free-free optical depth at our first epoch of observations. For our lowest frequency, the free-free optical depth is τffa(ν = 4.8 GHz) = 0.018. Hence, we conclude that self-absorbed synchrotron is the dominant absorption mechanism.
Bose et al. (2019) interpreted double-peaked Balmer lines in the SN 2016X spectrum as a result of bipolar ejecta or asymmetric wind distribution. Our radio analysis incorporates possible deviations from spherical symmetries through the volume filling factor, f. However, the flat functional dependence of the physical parameters on the filling factor, R ∝ f−1/19 and B ∝ f−4/19, does not allow for an accurate determination. For instance, reducing the filling factor by half only changes the result of the shock radius by less than 4%. Since the CSM density for SN2016X is proportional to R−2.1, in agreement with the density profile of spherically symmetric wind (∝ R−2), we see no evidence of asymmetric plasma distribution in our radio data. It should also be borne in mind that the only evidence that supports the claim of asphericity (i.e. the double-peaked optical lines) only appears when the nebular phase is well established (t > 200 days), which may not be relevant for our radio observations.
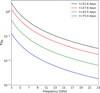 |
Fig. 4 Free-free optical depth as a function of frequency for the epochs of observation of SN 2016X. |
7.2 Electron cooling and equipartition
The characteristic cooling timescales and frequencies suggest that inverse Compton electron cooling is important for SN 2016X. The signature of inverse Compton cooling is evident in the radio spectrum, where we observe a steepening of the optically thin spectral slope at early times, when electron cooling is most important. This behaviour has been observed in other SNe of different types (e.g. SN2002ap, Björnsson & Fransson 2004; SN2012aw, Yadav et al. 2014; SN2020oi, Horesh et al. 2020).
Combining our results from the radio analysis with X-ray observations reported by Bose et al. (2019), we find a moderate deviation from energy equipartition by a factor α = 28.4. Assuming that the fraction of the energy invested in particle acceleration is ϵe = 0.1, the fraction of the post-shock energy deposited in magnetic field intensity is ϵB = 0.0035. This deviation is modest compared to other SNe, where α ≳ 100 (e.g. SN2011dh Soderberg et al. 2012; Horesh et al. 2013b; SN 2012aw Yadav et al. 2014; SN 2020oi Horesh et al. 2020). This deviation from equipartition implies that our results overestimate the shock radii and magnetic field and underestimate the mass-loss rate. The corrected mass-loss rate is Ṁ = (5.4 ± 0.6) × 10−6 M⊙ yr−1, which is similar to that of SN 1999em (Pooley et al. 2002), SN 2002hh (Nymark et al. 2006), or SN2004et (Misra et al. 2007).
Since the free-free optical depth depends on the mass-loss rate, we review our calculations here. In Fig. 4 we present the optical depth as a function of frequency for our epochs of observations. The maximum value of the free-free optical depth is τffa(ν = 4.8 GHz, t = 21.6 d) = 0.85, which is below unity. Additionally, we can check if free-free absorption is important by verifying whether the shell velocities obtained from the radio model are lower than the velocities derived from optical spectral lines. For SN2016X, we obtained shock velocities of 10 700–8000 km s−1, while Huang et al. (2018) inferred velocities in the range ~9000–6000 km s−1 between t = 20 and t = 80 days from Hα lines. With these results, we argue that the self-absorbed synchrotron is the dominant absorption mechanism.
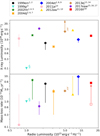 |
Fig. 5 Radio and X-ray properties of SNe IIP. The radio luminosity at ~5 GHz# is measured at the peak of the light curve for SN 1999em, SN2004dj, SN2004et, SN2012aw, and SN2016X; and limits on the flux peak are used for the rest of the SNe§. The X-ray luminosity is taken as close to the peak as possible in the energy ranges ~0.4–8 keV for SN 1999em, SN2002hh, SN2004dj, SN2004et, SN2013ej, and ~0.3–10 keV for the rest of the SNe. The mass-loss rate is estimated from radio observations, except for SN 1999gi, SN 2013ej, and SN 2017eaw. For SN 2016X we plot the mass-loss rate assuming equipartition (empty symbol) and departure from equipartition (filled symbol). The vertical lines are not error bars, but rather ranges of possible values reported by different authors (e.g. Nayana et al. 2018). References: [1] Pooley et al. (2002), [2] Chevalier et al. (2006), [3] Schlegel (2001), [4] Pooley & Lewin (2002), [5] Beswick et al. (2005a), [6] Beswick et al. (2005b), [7] Chakraborti et al. (2012), [8] Beswick et al. (2004), [9] Misra et al. (2007), [10] Chakraborti et al. (2013), [11] Chakraborti et al. (2016), [12] Bietenholz et al. (2021), [13] Immler & Brown (2012), [14] Yadav et al. (2014), [15] Argo et al. (2017), [16] Grefensetette et al. (2017), [17] Szalai et al. (2019), [18] This work. Notes:(#) SN2013ej was observed in radio at 9 GHz.(§) SN 1999gi was not detected in radio, so it is plotted at the arbitrary radio luminosity Lradio = 1025 erg s−1 Hz−1. |
7.3 SN2016X compared to other SNe IIP
SN 2016X is one of the few SNe IIP that are detected in both radio and X-rays, and it is arguably one of the best monitored in radio bands since we collected 36 data points in several frequencies and four different epochs. The other SNe IIP with similar or better radio coverage are SN2004dj (Nayana et al. 2018), SN2004et (Misra et al. 2007), and SN2012aw (Yadav et al. 2014).
In this section we compare the properties of SN 2016X to other SNe IIP observed in radio and X-ray bands. We present an overview of these SNe IIP in our Fig. 5, updating the sample in Nayana et al. (2018)’s Fig. 5. SN2016X is the most luminous SN IIP in the radio, with L4.8GHz ≈ 1.5 × 1026 erg s−1 Hz−1 (t = 43.5d). The X-ray luminosity of SN2016X is average, larger than for SN 1999gi, SN 1999em, SN 2004dj, or SN 2004et, similar to SN 2011ja and SN 2002hh, and smaller than for SN 2012aw, SN 2017eaw, and SN 2013ja. While the range of radio luminosities is restricted to roughly one order of magnitude, the values of X-ray luminosity span four orders of magnitude.
The mass-loss rate of SN IIP is well constrained within ~1–10 × 10−6M⊙ yr−1 for an assumed wind velocity of 10 km s−1. SN2016X exhibits a mass-loss rate towards the lower limit if equipartition is assumed, but comparable to the highest mass-loss rates taking into account deviations from equipartition.
The radio spectrum of SN2016X is also affected by electron cooling via inverse Compton scattering, such as SN2004dj, SN2004et, and SN2012aw, which may suggest that it is a common process for SNe IIP. SN2016X also has in common with SN2012aw the fact that both exhibit deviations from energy equipartition, although the deviation is more severe for SN 2012aw (α ~ 112). The mass-loss rate of SN 2016X is higher than that of SN 2012aw by a factor of ~3. The case of SN 2016X illustrates the importance of obtaining early radio and X-ray observations of young SNe.
8 Summary
In this paper we presented radio observations at frequencies 4.8–25.0 GHz obtained at four different epochs at ages in the range 21.6–75.4days, which makes it one of the best monitored SN IIP in radio frequencies. The observations can be well modelled with a self-absorbed synchrotron model, introducing self-similar expressions for the time evolution of the shock radius and magnetic field. The results are consistent with the interaction of ejecta with density profile ρSN ∝ R−6.2 with a CSM with density profile ρw ∝ R−2.1. The expansion of the shock radius shows moderate deceleration, R ∝ t−0.76.
We observed steeping of the spectral index in the optically thin regime at earlier epochs, which we interpreted as the signature of electron cooling via inverse Compton scattering. We combined our radio data with X-ray observations, and we found a mild deviation from energy equipartition, with α = ϵe/ϵB ≈ 28.4. This is the second SN IIP to exhibit this phenomenology, after SN 2012aw.
Acknowledgements
We thank the referee for a thorough assessment of our work and for helping improve this paper. R.R.C. acknowledges support from the Lady Davis Trust Fellowship and the Emily Erskine Endowment Funds at the Hebrew University of Jerusalem. A.H. is grateful for the support by grants from the Israel Science Foundation, the US-Israel Binational Science Foundation (BSF), and the I-CORE Program of the Planning and Budgeting Committee and the Israel Science Foundation. The VLA is a component of the National Radio Astronomy Observatory, a facility of the National Science Foundation operated under cooperative agreement by Associated Universities, Inc. We have made extensive use of the data reduction software CASA (McMullin et al. 2007), and the PYTHON packages: ASTROPY (Astropy Collaboration 2013), NUMPY (Oliphant 2006), MATPLOTLIB (Hunter 2007), EMCEE (Foreman-Mackey et al. 2013), and CORNER (Foreman-Mackey 2016).
References
- Argo, M., Torres, M. P., Beswick, R., & Wrigley, N. 2017, ATel, 10472, 1 [NASA ADS] [Google Scholar]
- Arnett, W. D. 1980, ApJ, 237, 541 [Google Scholar]
- Astropy Collaboration (Robitaille, T. P., et al.) 2013, A&A, 558, A33 [NASA ADS] [CrossRef] [EDP Sciences] [Google Scholar]
- Beswick, R. J., Muxlow, T. W. B., Argo, M. K., Pedlar, A., & Marcaide, J. M. 2004, IAU Circ., 8435, 3 [NASA ADS] [Google Scholar]
- Beswick, R. J., Fenech, D., Thrall, H., et al. 2005a, IAU Circ., 8572, 1 [NASA ADS] [Google Scholar]
- Beswick, R. J., Muxlow, T. W. B., Argo, M. K., et al. 2005b, ApJ, 623, L21 [NASA ADS] [CrossRef] [Google Scholar]
- Bietenholz, M. F., Bartel, N., Argo, M., et al. 2021, ApJ, 908, 75 [NASA ADS] [CrossRef] [Google Scholar]
- Björnsson, C.-I., & Fransson, C. 2004, ApJ, 605, 823 [CrossRef] [Google Scholar]
- Bock, G., Shappee, B. J., Stanek, K. Z., et al. 2016, ATel, 8566, 1 [NASA ADS] [Google Scholar]
- Bose, S., Dong, S., Elias-Rosa, N., et al. 2019, ApJ, 873, L3 [NASA ADS] [CrossRef] [Google Scholar]
- Bruch, R. J., Gal-Yam, A., Schulze, S., et al. 2021, ApJ, 912, 46 [NASA ADS] [CrossRef] [Google Scholar]
- Chakraborti, S., Yadav, N., Ray, A., et al. 2012, ApJ, 761, 100 [NASA ADS] [CrossRef] [Google Scholar]
- Chakraborti, S., Ray, A., Smith, R., et al. 2013, ApJ, 774, 30 [NASA ADS] [CrossRef] [Google Scholar]
- Chakraborti, S., Ray, A., Smith, R., et al. 2016, ApJ, 817, 22 [NASA ADS] [CrossRef] [Google Scholar]
- Chevalier, R. A. 1976, ApJ, 207, 872 [NASA ADS] [CrossRef] [Google Scholar]
- Chevalier, R. A. 1981, ApJ, 251, 259 [NASA ADS] [CrossRef] [Google Scholar]
- Chevalier, R. A. 1982, ApJ, 259, 302 [Google Scholar]
- Chevalier, R. A. 1998, ApJ, 499, 810 [NASA ADS] [CrossRef] [Google Scholar]
- Chevalier, R. A., & Fransson, C. 2006, ApJ, 651, 381 [NASA ADS] [CrossRef] [Google Scholar]
- Chevalier, R. A., Fransson, C., & Nymark, T. K. 2006, ApJ, 641, 1029 [NASA ADS] [CrossRef] [Google Scholar]
- Corsi, A., Ofek, E. O., Gal-Yam, A., et al. 2014, ApJ, 782, 42 [NASA ADS] [CrossRef] [Google Scholar]
- Foley, R. J., Smith, N., Ganeshalingam, M., et al. 2007, ApJ, 657, L105 [NASA ADS] [CrossRef] [Google Scholar]
- Foreman-Mackey, D. 2016, J. Open Source Softw., 1, 24 [Google Scholar]
- Foreman-Mackey, D., Hogg, D. W., Lang, D., & Goodman, J. 2013, PASP, 125, 306 [Google Scholar]
- Fransson, C., Lundqvist, P., & Chevalier, R. A. 1996, ApJ, 461, 993 [NASA ADS] [CrossRef] [Google Scholar]
- Gall, E. E. E., Polshaw, J., Kotak, R., et al. 2015, A&A, 582, A3 [NASA ADS] [CrossRef] [EDP Sciences] [Google Scholar]
- Grefensetette, B., Harrison, F., & Brightman, M. 2017, ATel, 10427, 1 [NASA ADS] [Google Scholar]
- Heger, A., Fryer, C. L., Woosley, S. E., Langer, N., & Hartmann, D. H. 2003, ApJ, 591, 288 [CrossRef] [Google Scholar]
- Hirschi, R., Meynet, G., & Maeder, A. 2004, A&A, 425, 649 [NASA ADS] [CrossRef] [EDP Sciences] [Google Scholar]
- Horesh, A., Kulkarni, S. R., Fox, D. B., et al. 2012, ApJ, 746, 21 [NASA ADS] [CrossRef] [Google Scholar]
- Horesh, A., Kulkarni, S. R., Corsi, A., et al. 2013a, ApJ, 778, 63 [NASA ADS] [CrossRef] [Google Scholar]
- Horesh, A., Stockdale, C., Fox, D. B., et al. 2013b, MNRAS, 436, 1258 [NASA ADS] [CrossRef] [Google Scholar]
- Horesh, A., Sfaradi, I., Ergon, M., et al. 2020, ApJ, 903, 132 [NASA ADS] [CrossRef] [Google Scholar]
- Hosseinzadeh, G., Arcavi, I., McCully, C., et al. 2016, ATel, 8567, 1 [NASA ADS] [Google Scholar]
- Huang, F., Wang, X., Zhang, J., et al. 2015, ApJ, 807, 59 [Google Scholar]
- Huang, F., Wang, X., Zampieri, L., et al. 2016, ApJ, 832, 139 [NASA ADS] [CrossRef] [Google Scholar]
- Huang, F., Wang, X.-F., Hosseinzadeh, G., et al. 2018, MNRAS, 475, 3959 [NASA ADS] [CrossRef] [Google Scholar]
- Hunter, J. D. 2007, Comput. Sci. Eng., 9, 90 [NASA ADS] [CrossRef] [Google Scholar]
- Immler, S., & Brown, P. J. 2012, ATel, 3995, 1 [NASA ADS] [Google Scholar]
- Inserra, C., Turatto, M., Pastorello, A., et al. 2011, MNRAS, 417, 261 [Google Scholar]
- Kamble, A., Margutti, R., Soderberg, A. M., et al. 2016, ApJ, 818, 111 [NASA ADS] [CrossRef] [Google Scholar]
- Leonard, D., Filippenko, A., Gates, E., et al. 2002, PASP, 114, 35 [NASA ADS] [CrossRef] [Google Scholar]
- Li, W., Van Dyk, S. D., Filippenko, A. V., & Cuillandre, J.-C. 2005, PASP, 117, 121 [NASA ADS] [CrossRef] [Google Scholar]
- Lundqvist, P., & Fransson, C. 1988, A&A, 192, 221 [NASA ADS] [Google Scholar]
- Margutti, R., Milisavljevic, D., Soderberg, A. M., et al. 2014a, ApJ, 780, 21 [Google Scholar]
- Margutti, R., Milisavljevic, D., Soderberg, A. M., et al. 2014b, ApJ, 797, 107 [NASA ADS] [CrossRef] [Google Scholar]
- Maund, J. R., & Smartt, S. J. 2005, MNRAS, 360, 288 [NASA ADS] [CrossRef] [Google Scholar]
- McMullin, J. P., Waters, B., Schiebel, D., Young, W., & Golap, K. 2007, ASP Conf. Ser., 376, 127 [Google Scholar]
- Misra, K., Pooley, D., Chandra, P., et al. 2007, MNRAS, 381, 280 [NASA ADS] [CrossRef] [Google Scholar]
- Moriya, T. J., Maeda, K., Taddia, F., et al. 2014, MNRAS, 439, 2917 [NASA ADS] [CrossRef] [Google Scholar]
- Nayana, A. J., Chandra, P., & Ray, A. K. 2018, ApJ, 863, 163 [NASA ADS] [CrossRef] [Google Scholar]
- Nymark, T. K., Fransson, C., & Kozma, C. 2006, A&A, 449, 171 [NASA ADS] [CrossRef] [EDP Sciences] [Google Scholar]
- Ofek, E. O., Sullivan, M., Shaviv, N. J., et al. 2014, ApJ, 789, 104 [NASA ADS] [CrossRef] [Google Scholar]
- Oliphant, T. E. 2006, A Guide to NumPy (USA: Continuum Press) [Google Scholar]
- Pacholczyk, A. G. 1970, Radio astrophysics. Nonthermal Processes in Galactic and Extragalactic Sources (San Francisco, California, USA: W. H. Freeman) [Google Scholar]
- Pastorello, A., Smartt, S. J., Mattila, S., et al. 2007, Nature, 447, 829 [NASA ADS] [CrossRef] [Google Scholar]
- Pastorello, A., Valenti, S., Zampieri, L., et al. 2009, MNRAS, 394, 2266 [Google Scholar]
- Pooley, D., & Lewin, W. H. G. 2002, IAU Circ., 8024, 2 [NASA ADS] [Google Scholar]
- Pooley, D., Lewin, W. H. G., Fox, D. W., et al. 2002, ApJ, 572, 932 [NASA ADS] [CrossRef] [Google Scholar]
- Ryder, S. D., Sadler, E. M., Subrahmanyan, R., et al. 2004, MNRAS, 349, 1093 [NASA ADS] [CrossRef] [Google Scholar]
- Schlegel, E. M. 2001, ApJ, 556, L25 [NASA ADS] [CrossRef] [Google Scholar]
- Smartt, S. J. 2009, Ann. Rev. Astron. Astrophys., 47, 63 [CrossRef] [Google Scholar]
- Smartt, S. J. 2015, PASA, 32, e016 [NASA ADS] [CrossRef] [Google Scholar]
- Smith, N. 2014, Ann. Rev. Astron. Astrophys., 52, 1 [Google Scholar]
- Smith, N., Hinkle, K. H., & Ryde, N. 2009, AJ, 137, 3558 [NASA ADS] [CrossRef] [Google Scholar]
- Smith, N., Miller, A., Li, W., et al. 2010, AJ, 139, 1451 [NASA ADS] [CrossRef] [Google Scholar]
- Soderberg, A. M., Kulkarni, S. R., Berger, E., et al. 2005, ApJ, 621, 908 [NASA ADS] [CrossRef] [Google Scholar]
- Soderberg, A. M., Brunthaler, A., Nakar, E., Chevalier, R. A., & Bietenholz, M. F. 2010, ApJ, 725, 922 [NASA ADS] [CrossRef] [Google Scholar]
- Soderberg, A. M., Margutti, R., Zauderer, B. A., et al. 2012, ApJ, 752, 78 [NASA ADS] [CrossRef] [Google Scholar]
- Sorce, J. G., Tully, R. B., Courtois, H. M., et al. 2014, MNRAS, 444, 527 [Google Scholar]
- Stockdale, C. J., Weiler, K. W., Van Dyk, S. D., et al. 2003, ApJ, 592, 900 [NASA ADS] [CrossRef] [Google Scholar]
- Strotjohann, N. L., Ofek, E. O., Gal-Yam, A., et al. 2021, ApJ, 907, 99 [NASA ADS] [CrossRef] [Google Scholar]
- Szalai, T., Vinkó, J., Könyves-Tóth, R., et al. 2019, ApJ, 876, 19 [Google Scholar]
- Utrobin, V. P., & Chugai, N. N. 2019, MNRAS, 490, 2042 [NASA ADS] [CrossRef] [Google Scholar]
- Van Dyk, S. D., Li, W., & Filippenko, A. V. 2003, PASP, 115, 1 [NASA ADS] [CrossRef] [Google Scholar]
- van Loon, J. T. 2010, ASP Conf. Ser., 425, 279 [NASA ADS] [Google Scholar]
- Weiler, K. W., Panagia, N., & Sramek, R. A. 1990, ApJ, 364, 611 [NASA ADS] [CrossRef] [Google Scholar]
- Weiler, K. W., Dyk, S. D. V., Discenna, J. L., Panagia, N., & Sramek, R. A. 1991, ApJ, 380, 161 [NASA ADS] [CrossRef] [Google Scholar]
- Weiler, K. W., Panagia, N., Montes, M. J., & Sramek, R. A. 2002, ARA&A, 40, 387 [NASA ADS] [CrossRef] [Google Scholar]
- Yadav, N., Ray, A., Chakraborti, S., et al. 2014, ApJ 782, 30 [NASA ADS] [CrossRef] [Google Scholar]
- Zheng, X.-M., & Zhang, J.-J. 2016, ATel, 8584, 1 [NASA ADS] [Google Scholar]
All Tables
All Figures
|
Fig. 1 Images of SN2016X at the four epochs of our observations, obtained at 4.8GHz (top row) and 22.0GHz (bottom row). The flux on the images is indicated by the colour bars on the right, and the beam size is represented at the bottom left of every image. |
| In the text | |
|
Fig. 2 Single-epoch spectral modelling of SN2016X. The shaded regions represent the 1σ confidence intervals of the best models. |
| In the text | |
|
Fig. 3 Multiple-epoch spectral modelling of SN2016X. The shaded regions represent the 1σ confidence intervals of the best model. |
| In the text | |
|
Fig. 4 Free-free optical depth as a function of frequency for the epochs of observation of SN 2016X. |
| In the text | |
|
Fig. 5 Radio and X-ray properties of SNe IIP. The radio luminosity at ~5 GHz# is measured at the peak of the light curve for SN 1999em, SN2004dj, SN2004et, SN2012aw, and SN2016X; and limits on the flux peak are used for the rest of the SNe§. The X-ray luminosity is taken as close to the peak as possible in the energy ranges ~0.4–8 keV for SN 1999em, SN2002hh, SN2004dj, SN2004et, SN2013ej, and ~0.3–10 keV for the rest of the SNe. The mass-loss rate is estimated from radio observations, except for SN 1999gi, SN 2013ej, and SN 2017eaw. For SN 2016X we plot the mass-loss rate assuming equipartition (empty symbol) and departure from equipartition (filled symbol). The vertical lines are not error bars, but rather ranges of possible values reported by different authors (e.g. Nayana et al. 2018). References: [1] Pooley et al. (2002), [2] Chevalier et al. (2006), [3] Schlegel (2001), [4] Pooley & Lewin (2002), [5] Beswick et al. (2005a), [6] Beswick et al. (2005b), [7] Chakraborti et al. (2012), [8] Beswick et al. (2004), [9] Misra et al. (2007), [10] Chakraborti et al. (2013), [11] Chakraborti et al. (2016), [12] Bietenholz et al. (2021), [13] Immler & Brown (2012), [14] Yadav et al. (2014), [15] Argo et al. (2017), [16] Grefensetette et al. (2017), [17] Szalai et al. (2019), [18] This work. Notes:(#) SN2013ej was observed in radio at 9 GHz.(§) SN 1999gi was not detected in radio, so it is plotted at the arbitrary radio luminosity Lradio = 1025 erg s−1 Hz−1. |
| In the text | |
Current usage metrics show cumulative count of Article Views (full-text article views including HTML views, PDF and ePub downloads, according to the available data) and Abstracts Views on Vision4Press platform.
Data correspond to usage on the plateform after 2015. The current usage metrics is available 48-96 hours after online publication and is updated daily on week days.
Initial download of the metrics may take a while.