Fig. 5
Download original image
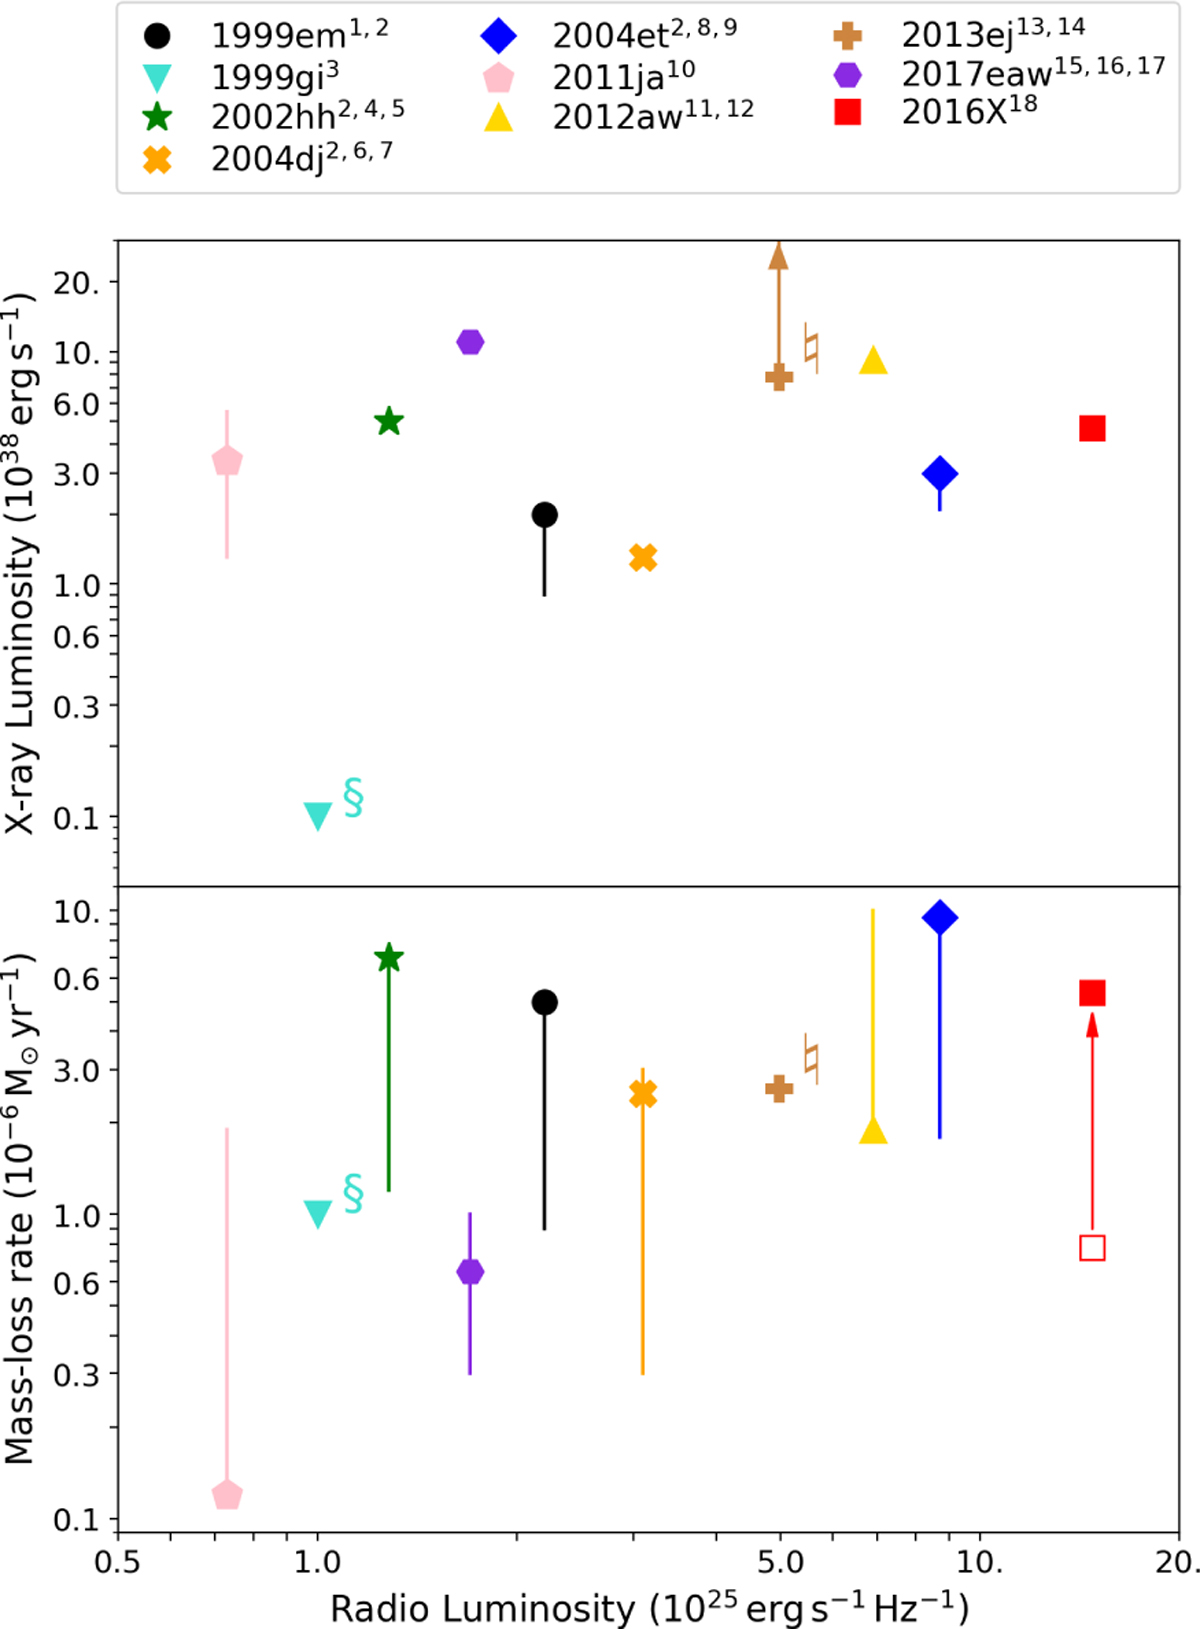
Radio and X-ray properties of SNe IIP. The radio luminosity at ~5 GHz# is measured at the peak of the light curve for SN 1999em, SN2004dj, SN2004et, SN2012aw, and SN2016X; and limits on the flux peak are used for the rest of the SNe§. The X-ray luminosity is taken as close to the peak as possible in the energy ranges ~0.4–8 keV for SN 1999em, SN2002hh, SN2004dj, SN2004et, SN2013ej, and ~0.3–10 keV for the rest of the SNe. The mass-loss rate is estimated from radio observations, except for SN 1999gi, SN 2013ej, and SN 2017eaw. For SN 2016X we plot the mass-loss rate assuming equipartition (empty symbol) and departure from equipartition (filled symbol). The vertical lines are not error bars, but rather ranges of possible values reported by different authors (e.g. Nayana et al. 2018). References: [1] Pooley et al. (2002), [2] Chevalier et al. (2006), [3] Schlegel (2001), [4] Pooley & Lewin (2002), [5] Beswick et al. (2005a), [6] Beswick et al. (2005b), [7] Chakraborti et al. (2012), [8] Beswick et al. (2004), [9] Misra et al. (2007), [10] Chakraborti et al. (2013), [11] Chakraborti et al. (2016), [12] Bietenholz et al. (2021), [13] Immler & Brown (2012), [14] Yadav et al. (2014), [15] Argo et al. (2017), [16] Grefensetette et al. (2017), [17] Szalai et al. (2019), [18] This work. Notes:(#) SN2013ej was observed in radio at 9 GHz.(§) SN 1999gi was not detected in radio, so it is plotted at the arbitrary radio luminosity Lradio = 1025 erg s−1 Hz−1.
Current usage metrics show cumulative count of Article Views (full-text article views including HTML views, PDF and ePub downloads, according to the available data) and Abstracts Views on Vision4Press platform.
Data correspond to usage on the plateform after 2015. The current usage metrics is available 48-96 hours after online publication and is updated daily on week days.
Initial download of the metrics may take a while.