Open Access
Fig. 1
Download original image
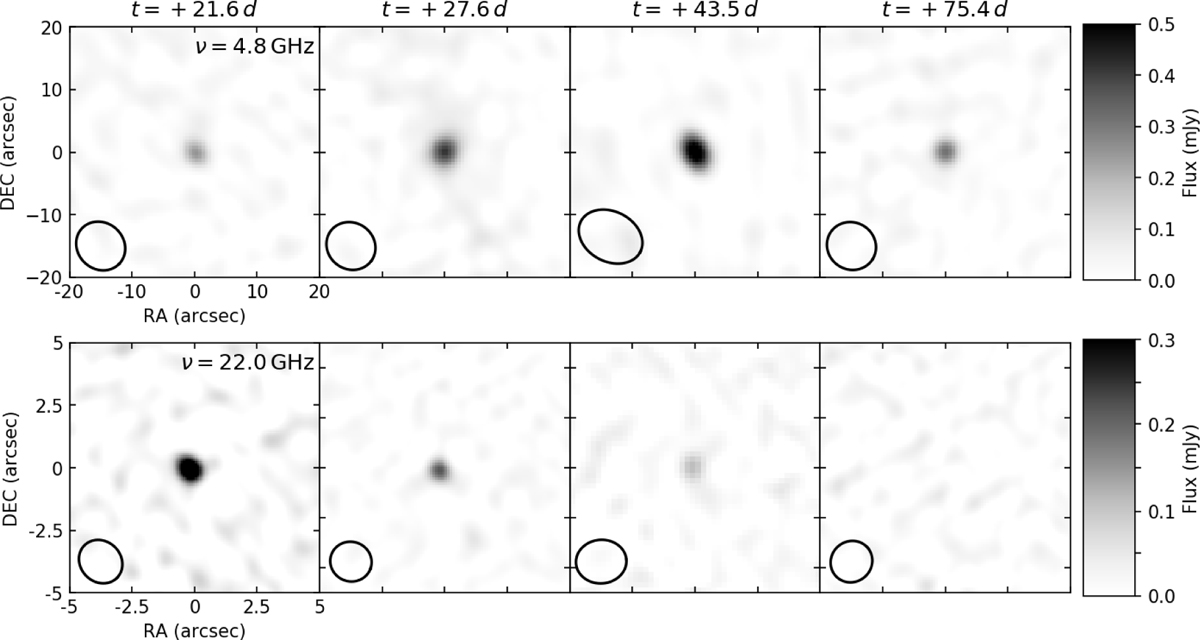
Images of SN2016X at the four epochs of our observations, obtained at 4.8GHz (top row) and 22.0GHz (bottom row). The flux on the images is indicated by the colour bars on the right, and the beam size is represented at the bottom left of every image.
Current usage metrics show cumulative count of Article Views (full-text article views including HTML views, PDF and ePub downloads, according to the available data) and Abstracts Views on Vision4Press platform.
Data correspond to usage on the plateform after 2015. The current usage metrics is available 48-96 hours after online publication and is updated daily on week days.
Initial download of the metrics may take a while.