| Issue |
A&A
Volume 665, September 2022
|
|
|---|---|---|
| Article Number | L4 | |
| Number of page(s) | 6 | |
| Section | Letters to the Editor | |
| DOI | https://doi.org/10.1051/0004-6361/202244556 | |
| Published online | 16 September 2022 | |
Letter to the Editor
First look with JWST spectroscopy: Resemblance among z ∼ 8 galaxies and local analogs
1
Observatoire de Genève, Université de Genève, Chemin Pegasi 51, 1290 Versoix, Switzerland
e-mail: This email address is being protected from spambots. You need JavaScript enabled to view it.
2
CNRS, IRAP, 14 Avenue E. Belin, 31400 Toulouse, France
3
Cosmic Dawn Center (DAWN), Niels Bohr Institute, University of Copenhagen, Jagtvej 128, København N 2200, Denmark
4
Center for Astrophysics, Harvard & Smithsonian, 60 Garden Street, Cambridge, MA 02138, USA
5
Bogolyubov Institute for Theoretical Physics, National Academy of Sciences of Ukraine, 14-b Metrolohichna str., Kyiv 03143, Ukraine
Received:
20
July
2022
Accepted:
27
August
2022
Abstract
Deep images and near-IR spectra of galaxies in the field of the lensing cluster SMACS J0723.3−7327 were recently taken as part of the Early Release Observations (EROs) program of the James Webb Space Telescope (JWST). Among these, two NIRSpec spectra of galaxies, at z = 7.7 and at z = 8.5, were obtained, revealing, for the first time, the rest-frame optical emission line spectra of galaxies in the epoch of reionization, including the detection of the important [O III]λ4363 auroral line (see JWST PR 2022-035). We present an analysis of the emission line properties of these galaxies, finding that these galaxies have a high excitation (as indicated by high ratios of [O III]λ5007/[O II] λ3727, [Ne III] λ3869/[O II] λ3727), strong [O III]λ4363, high equivalent widths, and other properties typical of low-metallicity star-forming galaxies. Using the direct method, we determined oxygen abundances of 12 + log(O/H)≈7.9 in two z = 7.7 galaxies and a lower metallicity of 12 + log(O/H)≈7.4 − 7.5 (∼5% solar) in the z = 8.5 galaxy using different strong line methods. More accurate metallicity determinations will require better data. With stellar masses estimated from spectral energy distribution (SED) fits, we find that the three galaxies lie close to or below the z ∼ 2 mass-metallicity relation. Overall, these first galaxy spectra at z ∼ 8 show a strong resemblance in their the emission line properties of galaxies in the epoch of reionization with those of relatively rare local analogs previously studied with the SDSS. Clearly, the first JWST observations demonstrate already the incredible power of spectroscopy to reveal the properties of galaxies in the early Universe.
Key words: galaxies: high-redshift / dark ages / reionization / first stars / galaxies: ISM
© D. Schaerer et al. 2022
 Open Access article, published by EDP Sciences, under the terms of the Creative Commons Attribution License (https://creativecommons.org/licenses/by/4.0), which permits unrestricted use, distribution, and reproduction in any medium, provided the original work is properly cited.
This article is published in open access under the Subscribe-to-Open model. This email address is being protected from spambots. You need JavaScript enabled to view it. to support open access publication.
1. Introduction
Optical emission line spectroscopy has long provided important insights on the physical composition, properties of the interstellar medium (ISM), and the nature of the ionizing power of galaxies, yielding thus key information to understand many key aspects of galaxy evolution (see review of Kewley et al. 2019). The well-known emission lines of H, He, O, N, S, Ne, and other elements detected in optical galaxy spectra, emitted in the ionized ISM (H II regions primarily) have been detected in nearly one million of galaxy spectra, out to redshifts of z ∼ 0.5 − 1 with the Sloan Digital Sky Survey (SDSS, Ahumada et al. 2020). Ground-based near-IR spectroscopy has recently pushed these limits to z ∼ 1.5 − 3, where ∼1500 measurements of the strongest rest-optical lines have been possible, for instance, with the MOSDEF survey (Kriek et al. 2015), thus revealing the ISM properties at cosmic noon (e.g., Förster Schreiber & Wuyts 2020).
The recent launch of the JWST and the spectroscopic capabilities of its multi-object near-infrared spectrograph (NIRSpec) has now opened up an entirely new window onto the early Universe, where, for the first time, all the “classical” optical diagnostics developed at low-z can be used to study the properties of galaxies over a wide redshift range, from z ∼ 3 out to the epoch of reionization (z > 6.5).
The first public NIRSpec observations, part of the Early Release Observations (ERO) of JWST, have covered the SMACS J0723.3−7327 galaxy cluster, providing 1.8 − 5.2 μm spectra of 35 objects in the field. Among those, three galaxies in the epoch of reionization were observed, showing spectacular, rich rest-frame optical emission line spectra of objects at z = 7.7 and z = 8.5 (see JWST Press release 2022-0351). Here, we report the first determination of the metallicity (O/H) of these galaxies, along with a detailed analysis of their emission line properties and a comparison with observed properties of low-z emission line galaxies. At the time of revision, the JWST targets have been the object of other studies analysing their emission line spectra and derived properties (see Arellano-Córdova et al. 2022; Brinchmann 2022; Carnall et al. 2022; Curti et al. 2022; Katz et al. 2022; Rhoads et al. 2022; Taylor et al. 2022; Trump et al. 2022).
2. Observations
2.1. JWST NIRSpec observations
Rest-frame UV and optical spectra were obtained on 30 June 2022 using NIRSpec with the micro-shutter assembly (MSA). Observations consist of two different pointings (s007 and s008), each of them using two grating-filter combinations: G235M/F170LP and G395M/F290LP. The total exposure time is 2 × 8754 s for each grating and filter pairing. This provides a spectral resolution R ≃ 1000 and a continuous spectral coverage of ≃1.75 − 5.20 μm. Fully calibrated spectra (calibration level 3) were retrieved from the Mikulski Archive for Space Telescopes2, which had previously been processed with the JWST Science Calibration Pipeline (CAL_VER: 1.5.3 and CRDS_CTX: jwst-0916.pmap). For each source, two individual 1D spectra (s007 and s008) were combined using the average flux, following a masking of the spectral regions affected by cosmic rays and other artifacts based on an inspection of the 2D spectra. For 04590, we excluded data above λobs ≥ 4.5 μm (i.e., after the detector gap) for observation s008, since the 2D spectrum in this region shows several artifacts that might compromise the flux calibration, including a considerable flux gradient along the spatial direction. An example of the combined spectrum of 06355 at z ≃ 7.7 is shown in Fig. 1.
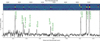 |
Fig. 1. 2D (top) and 1D (bottom) NIRSpec/JWST spectrum of 06355 at z = 7.664 (black) and 1σ uncertainty (grey). Vertical dashed lines mark the position of well-detected nebular emission lines. The continuum emission is also detected as seen in the 2D spectrum. X-axis in the bottom and top panels refer to the observed (μm) and rest-frame wavelengths (Å), respectively. |
The spectra of the three sources show nebular emission lines, many of them detected with high significance (> 3σ). These include Balmer lines (Hβ, Hγ, Hδ), [O II] and [O III], [Ne III], and He I. In particular, the auroral [O III]λ4363 line, which is key for accurate determinations of the O/H abundance using the direct method, is detected in all galaxies with a significance of 3.9 − 5.7σ. Gaussian profiles are fitted to each line using the Python nonlinear least-squares function CURVE-FIT and assuming a constant level for the continuum (in fλ). We derive the redshifts for these sources using the brightest lines, namely Hγ, Hβ, and [O III] λλ4959,5007 lines (Table 1). The continuum is clearly detected in the two z ≃ 7.7 sources (10612 and 06355, see Fig. 1), allowing for the determination of the equivalent widths of the lines (Table 1). However, these do not include any correction for slit-losses and other possible effects attributed to the different morphologies of the continuum emission and nebular lines.
Observed and derived quantities for the three high-z galaxies.
After careful inspection of the flux measurements we noticed that some line ratios have nonphysical values, suggesting systematics on the flux calibration and throughput in the current JWST pipeline. For example, the observed Balmer line ratios are found to be larger than the intrinsic Hγ/Hβ and Hδ/Hβ ratios, assuming case B recombination. Before more accurate calibration reference files are available, we overcame this issue by applying an ad hoc correction to the flux calibration. More specifically, we fit a power law (∝λα) to (i) the intrinsic Hγ/Hβ = 0.47, Hδ/Hβ = 0.26 (case B), and (He I+H8)/Hβ = 0.2 and to (ii) the observed line ratios. The correction factor as a function of wavelength is thus given by the division between (i) and (ii) for each source, and it is applied to the full spectral range covered by the G235M/F170LP grating/filter configuration. This empirical correction results in a maximum increase of ∼20 − 50% (depending on galaxy) for the O32 = [O III] λ5007/[O II] λ3727 ratio, and smaller corrections for other line ratios. By doing this, we are also applying a first-order correction to the Balmer decrement, thus losing the information on the dust attenuation. Given the uncertainties on the flux calibration and on our empirical correction, we conservatively add 20% of uncertainties on our flux measurements, which should also account for other sources of uncertainty, such as those arising from the estimation of the continuum level. This depends on the different assumptions (e.g., size of the spectral windows used in the fit, constant level or straight line, noise fluctuations, etc.) and may affect the flux measurements of different lines. The measured line ratios, prior to and after correction, are shown in Fig. 2. Where possible, our analysis will focus mostly on lines ratios between nearby lines (see Sect. 3), thus minimizing possible issues on the flux calibration and dust attenuation.
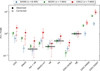 |
Fig. 2. Relative line intensities of the measured lines with respect to Hβ. Full and open symbols show the ratios prior to and after applying our flux correction (see text). |
It must be noted that presently the data reduction process is still in a preliminary stage, which involves, in particular, pre-launch calibration files (Rigby et al. 2022). To tackle with these limitations, different groups have used different approaches, including observations of a standard star, different extractions of the 2D spectra, different combinations of the two visits and other corrections (cf., Curti et al. 2022; Rhoads et al. 2022; Trump et al. 2022). A comparison shows differences in several line ratios, by amounts that are sometimes larger than the quoted uncertainties. To illustrate this, we subsequently compared our measurements with those from Curti et al. (2022), who improved the calibration using a standard star. For other comparisons see also Taylor et al. (2022) and Brinchmann (2022).
2.2. JWST NIRCam observations
We make use of a single NIRCam pointing in the six wide filters F090W, F150W, F200W, F277W, F356W, and F444W, with a uniform exposure time of 2.1 h in each and shallower NIRISS imaging in F115W. We obtained the calibrated and distortion-corrected NIRCam and NIRISS images from the publicly available reduction by Brammer (2022). The images were processed with the standard JWST pipeline up to stage 2b, before they were WCS aligned and combined with the grizli3 pipeline (see Brammer et al., in prep.). The images were pixel aligned at 40 mas pixel scales, before producing a multi-wavelength catalog with SExtractor (Bertin & Arnouts 1996). Fluxes are measured in small circular apertures of 0 32 diameter and corrected to total fluxes using the AUTO fluxes from the F200W detection image.
To determine stellar masses, SED fits to the seven bands were carried out using the latest versions of the CIGALE and Prospector codes (Boquien et al. 2019; Johnson et al. 2021), exploring a relatively wide range of priors. Without correcting for magnification, we found masses of log(M⋆/M⊙)∼8.9 − 9.2 as well as significant differences between the codes. We also note that the masses derived by Carnall et al. (2022) are systematically lower than ours, which should mainly be due to consistently younger ages found by these authors. Before more detailed analyses of the SEDs and spectra of these galaxies become available, we adopt the stellar masses from our preferred CIGALE fits and a conservative uncertainty of ±0.3 (see Table 1). To correct the masses for gravitational magnification from the cluster, we used the magnification factors μ from the lens models of Caminha et al. (2022). Other lens models, such as those used by Carnall et al. (2022), yield similar magnifications (differences of 10–50% at most) for the sources studied here.
2.3. Comparison samples
To make a comparison with low-z galaxies, we used a sample of 5607 star-forming galaxies from the SDSS Data Release 14 compiled by Y. Izotov and collaborators, analyzed in earlier publications (e.g., Guseva et al. 2019; Ramambason et al. 2020). The selection criteria used for the extraction of star-forming galaxies are presented in Izotov et al. (2014). Then we require a detection of the [O III]λ4363 line with an accuracy better than 4σ, thus allowing for direct abundance determinations to be obtained using the Te-method (this sample is subsequently referred to as Izotov-DR14).
We also used the spectra of 89 galaxies at z ∼ 0.3 from the Low-Z Lyman Continuum Survey (LzLCS), the first large sample of galaxies with UV spectroscopy covering both the Lyman continuum and non-ionizing UV (see Flury et al. 2022a,b). Approximately half of the sample has [O III]λ4363 detections.
3. Observed and derived properties of the z ∼ 8 galaxies
3.1. Emission line properties
First, we examined the observed emission line ratios in the three high-z galaxies and compared them to those of the low-z samples (cf., above). Figure 3 shows the main line ratios including the lines of [Ne III]λ3869, [O II]λ3727, [O III]λ4363, [O III]λ5007, and Hγ, which were detected in the JWST spectra. The [Ne III]/[O II] (Ne3O2) ratio is well known to closely trace O32, since both high ionization lines of [Ne III] and [O III] originate in the same zone of the H II region. Our measurements in the high-z galaxies (and those from Curti et al. 2022, shown for comparison) are compatible with the observed correlation, providing confidence for our empirical flux calibration. Based on these line ratios, the three high-z galaxies are found at relatively high excitation, corresponding to the tail of the distribution in low-z compact star-forming galaxies (cf. Izotov et al. 2021a). Compared to the low-z samples, the intensity of [O III]λ4363 is also found to be relatively high, with [O III]λ4363 < SPSDOUBLEDOLLAR > /Hγ ∼ 0.3 − 0.5, as illustrated in Fig. 3. The highest-z source (04590) is a bit offset towards low [O III]λ5007/[O III]λ4363.
 |
Fig. 3. Observed Ne3O2 ratio vs. O32 (left panel) and [O III]λ4363/Hγ vs. [O III]λ5007/[O III]λ4363 (right panel) for the z ∼ 8 galaxies (black stars: our measurements; green stars: data from Curti et al. 2022), the Izotov-DR14 sample of star-forming galaxies (grey and red points, according to EW(Hβ) < 100 Å and > 100 Å, respectively), and the LzLCS sample (blue points). |
The detection of the auroral [O III]λ4363 line and [O III]λ5007 provides access to the electron temperature, Te, and thus allows abundance determinations using the so-called “direct method” (see e.g., Kewley & Dopita 2002). To do this, we follow the prescriptions of Izotov et al. (2006), assuming low densities. The results are listed in Table 1. We find electron temperatures Te(O2+) ∼ 16 000 − 18 000 K for the two z = 7.7 galaxies and nebular O/H abundances of 12 + log(O/H)≈7.86 − 7.88 for the two objects. This includes both ionic abundances of O+ and O2+, determined from the optical lines; in both cases O2+ dominates. For 04590, the unusually low [O III]λ5007/[O III]λ4363 ratio leads to unphysically high electron temperatures (Te ∼ 35 kK) that are in excess of the highest accurate electron temperatures measured for star-forming galaxies at low-z (Te = 24 800 ± 900 K, Izotov et al. 2021b). This result is consistently found by all other papers who have analyzed the JWST; some authors have derived electron temperatures as high as Te = 37 200 ± 9900 K (Rhoads et al. 2022). Although the detection of the [O III]λ4363 line has been confirmed beyond a doubt, we find that better data will be needed before the electron temperatures can be accurately determined. Therefore, the direct metallicity determinations for these high-z galaxies should presently be taken with caution.
Different metallicity estimates can be obtained for the z = 8.495 galaxy 04590 (see Table 1): From their finding of Te ≳ 20 kK, Trump et al. (2022) concluded that 12 + log(O/H) < 7.69 (< 1/10 solar), from the empirical relation between Te and 12 + log(O/H) (cf. Pérez-Montero et al. 2021). Since standard strong line methods are not applicable at such low metallicities and for objects with “extreme” line ratios, we can, for instance, use the empirical calibration of Izotov et al. (2021b) based on measurements of R234 and O32, established at 12 + log(O/H) < 7.5. For 04590, we find 12 + log(O/H) = 7.39 with our measurements and 12 + log(O/H) = 7.24 using the line ratios reported by Curti et al. (2022), who derived 12 + log(O/H) = 6.99 ± 0.11 by the direct method. With the measurements from Rhoads et al. (2022) we obtain an intermediate metallicity, 12 + log(O/H) = 7.30, using the same calibration. All studies are thus far in agreement that 04590 shows the lowest metallicity among the three z ∼ 8 galaxies.
In Fig. 4 we show the Ne3O2 and [O III]λ4363 /Hγ ratios as a function of metallicity for the low-z samples and the three z ∼ 8 galaxies. We use these line ratios, which are close in wavelength, to minimize possible uncertainties of the flux calibration, differential slit losses, and other properties. Empirically, these line ratios can also provide a simple estimate of the metallicity O/H, as discussed by earlier studies (see e.g., Nagao et al. 2006; Sanders et al. 2020). In any case, we see that our metallicity estimates of the high-z galaxies lead to fairly compatible locations in these diagrams. We conclude that the three z ∼ 8 star-forming galaxies have low metallicities, in the range of 12 + log(O/H)∼7.4 − 8.0. More accurate determinations and a proper evaluation of the uncertainties require better data overall, including higher signal-to-noise ratio (S/N) spectra, proper calibrations, and a more sophisticated data reduction process, as well as continuum and line flux extractions.
 |
Fig. 4. [Ne III] λ3869/[O II] λ3727 ratio (left panel) and intensity of the auroral [O III]λ4363 line relative to [O III]λ5007 (right panel), as a function of O/H. Same symbols as in Fig. 3. |
Since the continuum is also detected in the NIRSpec spectra of the two z = 7.7 galaxies (and very weakly in the third object as well), we also measured the [O III] equivalent width (see Table 1). We compared our measurements with those from the low-z galaxies in Fig. 5, where strong correlations between EW([O III]λ5007) and properties such as O32, Ne3O2, and others have been found (Tang et al. 2019; Izotov et al. 2021a). It is possible that the high-z sources are somewhat offset. In any case, the EWs are high in the galaxies with significant continuum detections, with EW([O III]λ5007)∼700 Å in the brightest source.
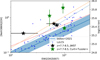 |
Fig. 5. Relation between the observed Ne3O2 ratio (left y-axis), ξion (right y-axis), and EW([O III]λ5007). The z ∼ 8 galaxies are marked with by black stars for our measurements and green stars using the line ratios and equivalent widths taken from Curti et al. (2022) and Trussler et al. (2022) respectively. The shaded stripe shows the mean Ne3O2–EW relation and scatter in the large low-z sample of Izotov et al. (2021a). The dotted lines show the relations between ξion (right axis) and EW([O III]λ5007) found at z ∼ 0 − 1 (Chevallard et al. 2018; Izotov et al. 2021a). |
Empirically, the ionizing photon production efficiency, ξion, is found to increase with the [O III]λ5007 equivalent width, as also shown in Fig. 5. Using the relations found at low-z and z ∼ 1 − 2 (see Tang et al. 2019; Izotov et al. 2021a), we estimate log(ξion)≈25.1 − 25.5 erg−1 Hz, up to a factor of ∼2 higher than the “canocical” value often assumed in ionizing photon budget calculations (Robertson et al. 2013). This is comparable to other estimates of ξion at high redshift (e.g., Stefanon et al. 2022).
3.2. Physical properties of the z ∼ 8 galaxies and the mass-metallicity relation
As discussed in this work, the three z ∼ 8 galaxies show emission line properties comparable to compact star-forming galaxies at low-z with strong emission lines. Izotov et al. (2021a) have shown that the low-z galaxies with strong lines (EW(Hβ) > 100 Å) are good analogs of many of the z ∼ 1 − 3 star-forming galaxies (Lyman-alpha emitters and Lyman-break galaxies) studied so far. By inference, the emission line properties of the three z ∼ 8 galaxies studied here also resemble those at intermediate redshifts.
By construction, the galaxies selected here cannot be claimed to be “typical,” and larger, systematic studies will be needed. From our measurements, one object (10612) shows a very high ratio [O III]λ5007 /Hβ ≈ 10 and a strong [O III]λ4363 line, which could indicate an active galaxy (Seyfert 2, see also Brinchmann 2022; Curti et al. 2022). On the other hand, we clearly find evidence for one star-forming galaxy with a fairly low metallicity (04590 with 12 + log(O/H)≈7.2 − 7.4).
If we combine our nebular metallicity estimates with the stellar masses described earlier, we obtain the mass–metallicity relation shown in Fig. 6. Our objects are found close to or below the mass–metallicity relation observed at z ∼ 2 and possibly offset by ∼0.2 − 0.3 below this relation, in good agreement with the relation derived by Ma et al. (2016) from simulations. Similar results were also obtained by Jones et al. (2020) using an indirect method based on ALMA emission line detections. However, at the present stage, we consider the stellar masses uncertain, since these strongly depend on assumptions of the star formation history and on the age of stellar populations (see also Tang et al. 2022), as well as the uncertainties with the zeropoints of NIRCam (see Rigby et al. 2022). For example, comparing the masses derived from SEDs by Carnall et al. (2022), Curti et al. (2022), and our work, we can see differences that are generally larger than the uncertainties cited. Then, adopting the lower masses from Carnall et al. (2022), for instance, would imply that our z ∼ 8 galaxies lie close to the z ∼ 2 mass–metallicity relation. The lower masses are mostly due to the very young ages (∼1 − 2 Myr) inferred by these authors, whereas our SED fits appears to favor less extreme populations. Although Carnall et al. (2022) have claimed that the SEDs show evidence for Balmer jumps (i.e., Balmer breaks in emission due to strong nebular continuum), we do not see such a behavior in the NIRSpec spectrum of the brightest source, 06355, shown in Fig. 1.
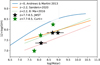 |
Fig. 6. Mass–metallicity relation of the three z ∼ 8 galaxies (black stars) compared to mean relations observed at z = 0 and 2.2 (Andrews & Martini 2013; Sanders et al. 2020), and the results from numerical simulations at z = 2.2 and 8 (dotted lines) from Ma et al. (2016). Green stars show the results from adopting stellar masses determined by Curti et al. (2022), who quote very small uncertaintes for their stellar masses. |
Having shown that the z ∼ 8 galaxies closely resemble strong emission line galaxies from our low-z sample, it is tempting to indirectly infer other properties using correlations established at low-z. Certainly, the high O32 ratios, low metallicity, and blue UV slopes (β) suggest that these galaxies could contribute to cosmic reionization, that is to say, have escaping Lyman continuum photons. For example, for the observed values of O32, 12 + log(O/H), and β, the LzLCS results suggest a 30–60% detection fraction of the Lyman continuum. Adopting the mean relation between the LyC escape fraction, fesc, and the UV slope, we estimate fesc = 0.03 − 0.08 for the three z ∼ 8 galaxies, although the LyC escape could also be significantly higher (see Chisholm et al. 2022).
Future improvements in the calibration and data reduction and additional observations will allow us to more accurately determine the equivalent widths and total line fluxes of emission lines, measure continuum shapes, combine the photometry and spectra, and so on – hence improving our overall knowledge of the physical properties of galaxies at high-redshift.
4. Conclusion
We analyzed the rest-frame optical spectra of two galaxies at z = 7.7 and one at z = 8.5 from the JWST EROs. The spectra, exhibit numerous emission lines of H, He I, [O II], [O III], and [Ne III], as commonly seen in metal-poor star-forming galaxies at low redshift. These provide, for the first time in the epoch of reionization, detailed information on the chemical composition and interstellar medium of these galaxies. Our main results are summarized as follows:
-
The auroral [O III]λ4363 line is significantly detected in all galaxies with 3.9 − 5.7σ, allowing us to determine the O/H abundance (metallicity) using the direct method. With this method and different strong-line methods, we estimate metallicities between 12 + log(O/H) = 7.4 − 8.0, namely, ∼5 − 20% of solar.
-
All three galaxies show a high excitation, as measured by their line ratios of O32 = 6 − 11 and Ne3O2 = 0.4 − 0.7, or even higher, according to Curti et al. (2022) and Rhoads et al. (2022). The observed emission line ratios are similar to those of rare low-z star-forming galaxies, which are considered analogs of high-redshift (z ∼ 1 − 3) galaxies. One of the z = 7.6 galaxies shows unusually high [O III]λ5007/Hβ ≈ 10, possibly indicative of nuclear activity (Seyfert 2).
-
The z ∼ 8 galaxies show quite high equivalent widths, that is, EW([O III]λ5007) up to ∼700 Å, as expected from low-z galaxies with high excitation. Such galaxies are known to be efficient producers of ionizing photons. We conservatively estimate log(ξion)∼25.2 − 25.5 erg−1 Hz for our galaxies.
-
Using stellar mass estimates from SED fits, we find the z ∼ 8 galaxies to lie close to or below the mass–metallicity relation (MZR) at z ∼ 2. To assess whether the MZR continues to evolve from z = 2 to 8, future studies of larger galaxy samples and accurate metallicity determinations will be required.
Overall, the first analysis of the rest-frame optical spectra of galaxies at z ∼ 8 indicates that the emission lines properties of galaxies in the epoch of reionization resemble those of relatively rare “local analogs” that have previously been the subject of study by the SDSS and for which numerous physical properties have already been determined. These low-z samples will soon be rivaled by numerous measurements with NIRSpec onboard JWST. Clearly, the first data release reveals already an extremely promising “preview” of upcoming science with JWST in the early Universe. More robust inferences will require better data, including higher S/N spectra and improvements in the calibration, data reduction, and continuum and line flux extractions.
R23=([O III] λλ4959,5007/Hβ+[O II] λ3727/Hβ).
Acknowledgments
We are very grateful to the ERO and other teams who made these JWST observations possible. The Early Release Observations and associated materials were developed, executed, and compiled by the ERO production team: Hannah Braun, Claire Blome, Matthew Brown, Margaret Carruthers, Dan Coe, Joseph DePasquale, Nestor Espinoza, Macarena Garcia Marin, Karl Gordon, Alaina Henry, Leah Hustak, Andi James, Ann Jenkins, Anton Koekemoer, Stephanie LaMassa, David Law, Alexandra Lockwood, Amaya Moro-Martin, Susan Mullally, Alyssa Pagan, Dani Player, Klaus Pontoppidan, Charles Proffitt, Christine Pulliam, Leah Ramsay, Swara Ravindranath, Neill Reid, Massimo Robberto, Elena Sabbi, Leonardo Ubeda. The EROs were also made possible by the foundational efforts and support from the JWST instruments, STScI planning and scheduling, and Data Management teams. We acknowledge support from the Swiss National Science Foundation through project grant 200020_207349 (PAO, LB). The Cosmic Dawn Center (DAWN) is funded by the Danish National Research Foundation under grant No. 140. Cloud-based data processing and file storage for this work is provided by the AWS Cloud Credits for Research program. Y.I. and N.G. acknowledge support from the National Academy of Sciences of Ukraine by its priority project No. 0122U002259 “Fundamental properties of the matter and its manifestation in micro world, astrophysics and cosmology”.
References
- Ahumada, R., Prieto, C. A., Almeida, A., et al. 2020, ApJS, 249, 3 [Google Scholar]
- Andrews, B. H., & Martini, P. 2013, ApJ, 765, 140 [NASA ADS] [CrossRef] [Google Scholar]
- Arellano-Córdova, K. Z., Berg, D. A., Chisholm, J., et al. 2022, ApJ, submitted [arXiv:2208.02562] [Google Scholar]
- Bertin, E., & Arnouts, S. 1996, A&AS, 117, 393 [NASA ADS] [CrossRef] [EDP Sciences] [Google Scholar]
- Boquien, M., Burgarella, D., Roehlly, Y., et al. 2019, A&A, 622, A103 [NASA ADS] [CrossRef] [EDP Sciences] [Google Scholar]
- Brammer, G. 2022, https://doi.org/10.5281/zenodo.6874300 [Google Scholar]
- Brinchmann, J. 2022, MNRAS, submitted [arXiv:2208.07467] [Google Scholar]
- Caminha, G. B., Suyu, S. H., Mercurio, A., et al. 2022, A&A, submitted [arXiv:2207.07567] [Google Scholar]
- Carnall, A. C., Begley, R., McLeod, D. J., et al. 2022, MNRAS, submitted [arXiv:2207.08778] [Google Scholar]
- Chevallard, J., Charlot, S., Senchyna, P., et al. 2018, MNRAS, 479, 3264 [Google Scholar]
- Chisholm, J., Saldana-Lopez, A., Flury, S., et al. 2022, MNRAS, submitted [arXiv:2207.05771] [Google Scholar]
- Curti, M., D’Eugenio, F., & Carniani, S. 2022, MNRAS, submitted [arXiv:2207.12375] [Google Scholar]
- Flury, S. R., Jaskot, A. E., Ferguson, H. C., et al. 2022a, ApJS, 260, 1 [NASA ADS] [CrossRef] [Google Scholar]
- Flury, S. R., Jaskot, A. E., Ferguson, H. C., et al. 2022b, ApJ, 930, 126 [NASA ADS] [CrossRef] [Google Scholar]
- Förster Schreiber, N. M., & Wuyts, S. 2020, ARA&A, 58, 661 [Google Scholar]
- Guseva, N. G., Izotov, Y. I., Fricke, K. J., & Henkel, C. 2019, A&A, 624, A21 [NASA ADS] [CrossRef] [EDP Sciences] [Google Scholar]
- Izotov, Y. I., Stasińska, G., Meynet, G., Guseva, N. G., & Thuan, T. X. 2006, A&A, 448, 955 [CrossRef] [EDP Sciences] [Google Scholar]
- Izotov, Y. I., Guseva, N. G., Fricke, K. J., & Henkel, C. 2014, A&A, 561, A33 [NASA ADS] [CrossRef] [EDP Sciences] [Google Scholar]
- Izotov, Y. I., Guseva, N. G., Fricke, K. J., & Henkel, C. 2019, A&A, 623, A40 [NASA ADS] [CrossRef] [EDP Sciences] [Google Scholar]
- Izotov, Y. I., Guseva, N. G., Fricke, K. J., et al. 2021a, A&A, 646, A138 [NASA ADS] [CrossRef] [EDP Sciences] [Google Scholar]
- Izotov, Y. I., Thuan, T. X., & Guseva, N. G. 2021b, MNRAS, 504, 3996 [NASA ADS] [CrossRef] [Google Scholar]
- Johnson, B. D., Leja, J., Conroy, C., & Speagle, J. S. 2021, ApJS, 254, 22 [NASA ADS] [CrossRef] [Google Scholar]
- Jones, T., Sanders, R., Roberts-Borsani, G., et al. 2020, ApJ, 903, 150 [CrossRef] [Google Scholar]
- Katz, H., Saxena, A., Cameron, A. J., et al. 2022, MNRAS, submitted [arXiv:2207.13693] [Google Scholar]
- Kewley, L. J., & Dopita, M. A. 2002, ApJS, 142, 35 [Google Scholar]
- Kewley, L. J., Nicholls, D. C., & Sutherland, R. S. 2019, ARA&A, 57, 511 [Google Scholar]
- Kriek, M., Shapley, A. E., Reddy, N. A., et al. 2015, ApJS, 218, 15 [NASA ADS] [CrossRef] [Google Scholar]
- Ma, X., Hopkins, P. F., Faucher-Giguère, C.-A., et al. 2016, MNRAS, 456, 2140 [NASA ADS] [CrossRef] [Google Scholar]
- Nagao, T., Maiolino, R., & Marconi, A. 2006, A&A, 459, 85 [NASA ADS] [CrossRef] [EDP Sciences] [Google Scholar]
- Pérez-Montero, E., Amorín, R., Sánchez Almeida, J., et al. 2021, MNRAS, 504, 1237 [CrossRef] [Google Scholar]
- Ramambason, L., Schaerer, D., Stasińska, G., et al. 2020, A&A, 644, A21 [NASA ADS] [CrossRef] [EDP Sciences] [Google Scholar]
- Rhoads, J. E., Wold, I. G. B., Harish, S., et al. 2022, ApJ, submitted [arXiv:2207.13020] [Google Scholar]
- Rigby, J., Perrin, M., McElwain, M., et al. 2022, ArXiv e-prints [arXiv:2207.05632] [Google Scholar]
- Robertson, B. E., Furlanetto, S. R., Schneider, E., et al. 2013, ApJ, 768, 71 [Google Scholar]
- Sanders, R. L., Shapley, A. E., Reddy, N. A., et al. 2020, MNRAS, 491, 1427 [NASA ADS] [CrossRef] [Google Scholar]
- Stefanon, M., Bouwens, R. J., Illingworth, G. D., et al. 2022, ApJ, 935, 94 [NASA ADS] [CrossRef] [Google Scholar]
- Tang, M., Stark, D. P., Chevallard, J., & Charlot, S. 2019, MNRAS, 489, 2572 [NASA ADS] [CrossRef] [Google Scholar]
- Tang, M., Stark, D. P., & Ellis, R. S. 2022, MNRAS, 513, 5211 [NASA ADS] [CrossRef] [Google Scholar]
- Taylor, A. J., Barger, A. J., & Cowie, L. L. 2022, AAS, submitted [arXiv:2208.06418] [Google Scholar]
- Trump, J. R., Arrabal Haro, P., Simons, R. C., et al. 2022, AAS, submitted [arXiv:2207.12388] [Google Scholar]
- Trussler, J. A. A., Adams, N. J., Conselice, C. J., et al. 2022, ArXiv e-prints [arXiv:2207.14265] [Google Scholar]
All Tables
All Figures
|
Fig. 1. 2D (top) and 1D (bottom) NIRSpec/JWST spectrum of 06355 at z = 7.664 (black) and 1σ uncertainty (grey). Vertical dashed lines mark the position of well-detected nebular emission lines. The continuum emission is also detected as seen in the 2D spectrum. X-axis in the bottom and top panels refer to the observed (μm) and rest-frame wavelengths (Å), respectively. |
| In the text | |
|
Fig. 2. Relative line intensities of the measured lines with respect to Hβ. Full and open symbols show the ratios prior to and after applying our flux correction (see text). |
| In the text | |
|
Fig. 3. Observed Ne3O2 ratio vs. O32 (left panel) and [O III]λ4363/Hγ vs. [O III]λ5007/[O III]λ4363 (right panel) for the z ∼ 8 galaxies (black stars: our measurements; green stars: data from Curti et al. 2022), the Izotov-DR14 sample of star-forming galaxies (grey and red points, according to EW(Hβ) < 100 Å and > 100 Å, respectively), and the LzLCS sample (blue points). |
| In the text | |
|
Fig. 4. [Ne III] λ3869/[O II] λ3727 ratio (left panel) and intensity of the auroral [O III]λ4363 line relative to [O III]λ5007 (right panel), as a function of O/H. Same symbols as in Fig. 3. |
| In the text | |
|
Fig. 5. Relation between the observed Ne3O2 ratio (left y-axis), ξion (right y-axis), and EW([O III]λ5007). The z ∼ 8 galaxies are marked with by black stars for our measurements and green stars using the line ratios and equivalent widths taken from Curti et al. (2022) and Trussler et al. (2022) respectively. The shaded stripe shows the mean Ne3O2–EW relation and scatter in the large low-z sample of Izotov et al. (2021a). The dotted lines show the relations between ξion (right axis) and EW([O III]λ5007) found at z ∼ 0 − 1 (Chevallard et al. 2018; Izotov et al. 2021a). |
| In the text | |
|
Fig. 6. Mass–metallicity relation of the three z ∼ 8 galaxies (black stars) compared to mean relations observed at z = 0 and 2.2 (Andrews & Martini 2013; Sanders et al. 2020), and the results from numerical simulations at z = 2.2 and 8 (dotted lines) from Ma et al. (2016). Green stars show the results from adopting stellar masses determined by Curti et al. (2022), who quote very small uncertaintes for their stellar masses. |
| In the text | |
Current usage metrics show cumulative count of Article Views (full-text article views including HTML views, PDF and ePub downloads, according to the available data) and Abstracts Views on Vision4Press platform.
Data correspond to usage on the plateform after 2015. The current usage metrics is available 48-96 hours after online publication and is updated daily on week days.
Initial download of the metrics may take a while.