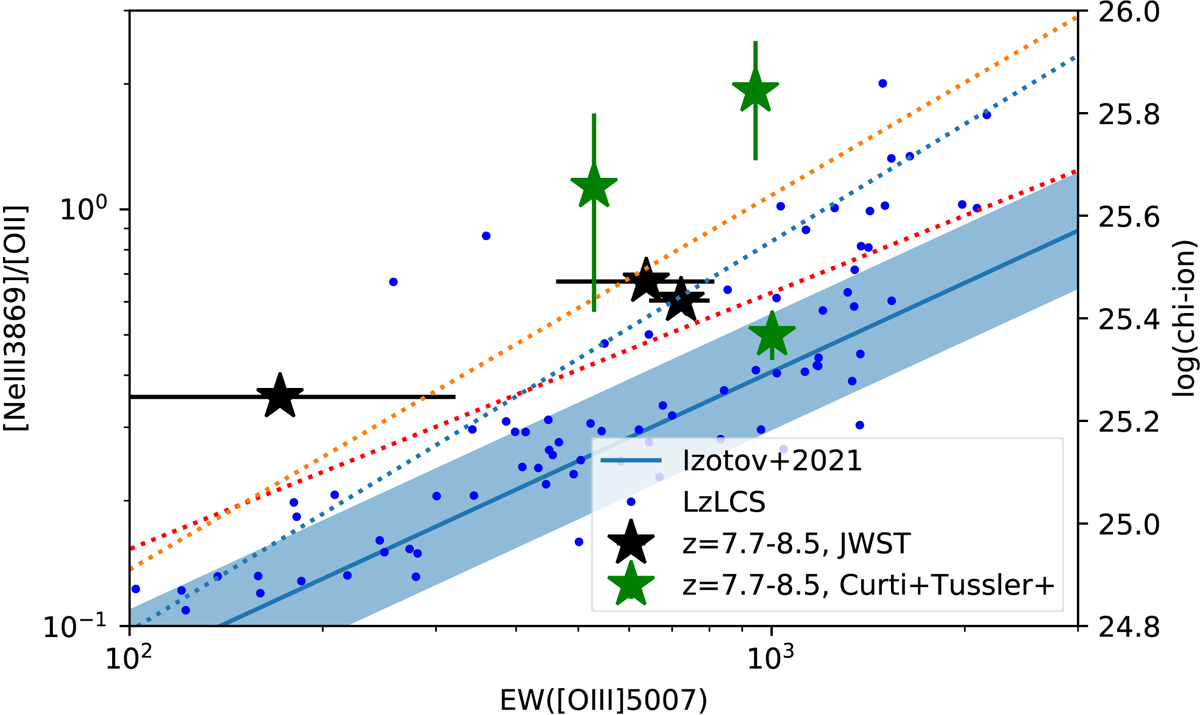
Fig. 5.
Download original image
Relation between the observed Ne3O2 ratio (left y-axis), ξion (right y-axis), and EW([O III]λ5007). The z ∼ 8 galaxies are marked with by black stars for our measurements and green stars using the line ratios and equivalent widths taken from Curti et al. (2022) and Trussler et al. (2022) respectively. The shaded stripe shows the mean Ne3O2–EW relation and scatter in the large low-z sample of Izotov et al. (2021a). The dotted lines show the relations between ξion (right axis) and EW([O III]λ5007) found at z ∼ 0 − 1 (Chevallard et al. 2018; Izotov et al. 2021a).
Current usage metrics show cumulative count of Article Views (full-text article views including HTML views, PDF and ePub downloads, according to the available data) and Abstracts Views on Vision4Press platform.
Data correspond to usage on the plateform after 2015. The current usage metrics is available 48-96 hours after online publication and is updated daily on week days.
Initial download of the metrics may take a while.