| Issue |
A&A
Volume 665, September 2022
|
|
|---|---|---|
| Article Number | A103 | |
| Number of page(s) | 10 | |
| Section | The Sun and the Heliosphere | |
| DOI | https://doi.org/10.1051/0004-6361/202243272 | |
| Published online | 15 September 2022 | |
The faintest solar coronal hard X-rays observed with FOXSI
1
Space Sciences Laboratory, University of California Berkeley, Berkeley, CA, USA
e-mail: This email address is being protected from spambots. You need JavaScript enabled to view it.
2
Physics Department, University of California, Berkeley, CA, USA
3
University of Minnesota, Physics and Astronomy, Minneapolis, MN, USA
4
NASA Goddard Space Flight Center, Greenbelt, MD, USA
5
University of Applied Sciences and Arts Northwestern Switzerland, Windisch, Switzerland
6
Johns Hopkins University Applied Physics Laboratory, Laurel, MD, USA
7
NASA Marshall Space Flight Center, Huntsville, AL, USA
8
ESA, European Space Research and Technology Centre (ESTEC), Noordwijk, The Netherlands
9
Heliospace Corporation, Berkeley, CA, USA
10
University of Colorado, Boulder, CO, USA
11
Kavli Institute for the Physics and Mathematics of the Universe (WPI), The University of Tokyo, Tokyo, Japan
12
Department of Physics, The University of Tokyo, Tokyo, Japan
13
Institute of Space and Astronautical Science, Kanagawa, Japan
14
National Astronomical Observatory of Japan, Tokyo, Japan
15
Rikkyo University, Graduate School of Artificial Intelligence and Science, Tokyo, Japan
16
Nagoya University, Graduate School of Science, Aichi, Japan
17
Tokyo University of Science, Shinjuku City, Tokyo, Japan
Received:
4
February
2022
Accepted:
6
June
2022
Abstract
Context. Solar nanoflares are small impulsive events releasing magnetic energy in the corona. If nanoflares follow the same physics as their larger counterparts, they should emit hard X-rays (HXRs) but with a rather faint intensity. A copious and continuous presence of nanoflares would result in a sustained HXR emission. These nanoflares could deliver enormous amounts of energy into the solar corona, possibly accounting for its high temperatures. To date, there has not been any direct observation of such persistent HXRs from the quiescent Sun. However, the quiet-Sun HXR emission was constrained in 2010 using almost 12 days of quiescent solar off-pointing observations by the Reuven Ramaty High Energy Solar Spectroscopic Imager (RHESSI). These observations set 2σ upper limits at 3.4 × 10⁻² photons s−1 cm−2 keV−1 and 9.5 × 10⁻⁴ photons s−1 cm−2 keV−1 for the 3–6 keV and 6–12 keV energy ranges, respectively.
Aims. Observing faint HXR emission is challenging because it demands high sensitivity and dynamic range instruments. The Focusing Optics X-ray Solar Imager (FOXSI) sounding rocket experiment excels in these two attributes when compared with RHESSI. FOXSI completed its second and third successful flights (FOXSI-2 and -3) on December 11, 2014, and September 7, 2018, respectively. This paper aims to constrain the quiet-Sun emission in the 5–10 keV energy range using FOXSI-2 and -3 observations.
Methods. To fully characterize the sensitivity of FOXSI, we assessed ghost ray backgrounds generated by sources outside of the field of view via a ray-tracing algorithm. We used a Bayesian approach to provide upper thresholds of quiet-Sun HXR emission and probability distributions for the expected flux when a quiet-Sun HXR source is assumed to exist.
Results. We found a FOXSI-2 upper limit of 4.5 × 10⁻² photons s−1 cm−2 keV−1 with a 2σ confidence level in the 5–10 keV energy range. This limit is the first-ever quiet-Sun upper threshold in HXR reported using ∼1 min observations during a period of high solar activity. RHESSI was unable to measure the quiet-Sun emission during active times due to its limited dynamic range. During the FOXSI-3 flight, the Sun exhibited a fairly quiet configuration, displaying only one aged nonflaring active region. Using the entire ∼6.5 min of FOXSI-3 data, we report a 2σ upper limit of ∼10−4 photons s−1 cm−2 keV−1 for the 5–10 keV energy range.
Conclusions. The FOXSI-3 upper limits on quiet-Sun emission are similar to that previously reported, but FOXSI-3 achieved these results with only 5 min of observations or about 1/2600 less time than RHESSI. A possible future spacecraft using hard X-ray focusing optics like those in the FOXSI concept would allow enough observation time to constrain the current HXR quiet-Sun limits further, or perhaps even make direct detections. This is the first report of quiet-Sun HXR limits from FOXSI and the first science paper using FOXSI-3 observations.
Key words: Sun: X-rays / gamma rays / Sun: corona / Sun: activity / X-rays: diffuse background / methods: statistical
© J. C. Buitrago-Casas et al. 2022
 Open Access article, published by EDP Sciences, under the terms of the Creative Commons Attribution License (https://creativecommons.org/licenses/by/4.0), which permits unrestricted use, distribution, and reproduction in any medium, provided the original work is properly cited.
This article is published in open access under the Subscribe-to-Open model. This email address is being protected from spambots. You need JavaScript enabled to view it. to support open access publication.
1. Introduction
In solar and heliophysics the coronal heating problem relates to the puzzle of identifying and understanding the mechanism(s) causing the corona’s temperatures to be multiple thousands of times hotter than the solar surface (e.g., Klimchuk 2006, 2015). Among the various plausible hypotheses proposed, the two strongest candidates are MHD wave dissipation and copious low-energy magnetic reconnections (or nanoflares, a term coined by Parker in 1988) (e.g., Hudson 1991; Bogachev et al. 2020). Klimchuk (2006) pointed out that, when examined thoroughly, most plausible coronal heating explanations imply nonthermal heating that happens impulsively on individual flux tubes (strands). If such small impulsive events follow the physics of larger flares, nonthermal electrons energized during the small ubiquitous reconnections in the corona should be the base for heating the coronal plasma. The emission of hard X-rays (HXRs) is a direct consequence of these nonthermal electrons slowing down in the chromosphere. HXRs have been observed in nonflaring active regions, revealing the presence of hot plasma of over 7 million Kelvin (e.g., Ishikawa et al. 2017). Other authors have shown evidence of nonthermal particles in microflares (typical energies of E ∼ 1027 erg) by directly analyzing their emission in HXRs (e.g., Christe et al. 2008; Hannah et al. 2011; Glesener et al. 2020; Duncan et al. 2021). For nanoflares, with energies of E ∼ 1024 erg or less, HXRs are far fainter than those from larger flares and challenging to detect due to the limited sensitivity of current instruments. The presence of nonthermal particles in nanoflares is (so far) the most plausible explanation for the emission observed directly and indirectly in other wavelengths. These observations include (a) short-lived UV brightenings measured with the Interface Region Imaging Spectrograph (IRIS) at loop footpoints in nonflaring active regions (e.g., Testa et al. 2014, 2020), (b) nonthermal radio emission from the quiescent corona (e.g., James & Subramanian 2018; Mondal et al. 2020), and (c) multi-wavelength evidence of non-Maxwellian distributions and non-equilibrium ionization in the quiet transition region, corona, and solar wind (e.g., Dudík et al. 2017b,a). Nanoflare observations in HXRs can complement our current understanding of the role of nonthermal particle processes in heating the quiescent corona.
In recent years, the Focusing Optics X-ray Solar Imager (FOXSI) sounding rocket experiment has provided high-sensitivity (and high dynamic range) solar X-ray observations in the band of ∼4–20 keV, with capabilities of performing imaging spectroscopy at 8.8 arcsec spatial and 0.5 keV energy resolutions (Krucker et al. 2014; Christe et al. 2016; Musset et al. 2019). FOXSI observed areas in the solar disk free of active regions during its second and third flights. Analyzing the very few counts observed with FOXSI when pointing to the quiet Sun is currently the best way we have to evaluate the faintest sources of HXRs from the solar corona, which is the core of this work.
2. The FOXSI sounding rocket
The FOXSI sounding rocket program is a mission to develop and test grazing-incidence HXR optics for solar observations. FOXSI uses a set of seven Wolter-I figured grazing-incidence X-ray telescope modules to perform imaging spectroscopy of solar HXRs from 5–20 keV. The optics focal length, limited by the size of the sounding rocket payload (2 m), sets the 20 keV energy upper limit. The parameters of the optics, such as diameter and focal length, were set to suit the payload of a Terrier-Black-Brant sounding rocket. These optics were produced at the NASA Marshall Space Flight Center applying a low-cost electroformed nickel alloy replication process, whereby nickel mirrors are electro-deposited onto super-polished mandrels (Ramsey 2005). For increased effective area, shells of various radii are co-axially nested together into modules of seven or ten mirrors. The averaged resolution of the integrated modules was measured in the laboratory to be 4.3 ± 0.6 arcsec (full width at half maximum, FWHM) and 27 ± 1.7 arcsec (half-power diameter, HPD) for an on-axis source. Constrained to the Si detector square area, the field of view (FOV) is 16 × 16 arcmin2. A number of papers in the literature provide additional details about the FOXSI rocket experiment. Krucker et al. (2013, 2014) describe the original payload and the first scientific results of the mission. Glesener et al. (2016) provide an overview of the first two flights of the experiment. Christe et al. (2016) describe major updates made for the second flight as well as details on the mirror shell prescription. Musset et al. (2019), Athiray et al. (2017), and Furukawa et al. (2019) describe the hardware upgrades for the third flight of the sounding rockets. This paper is a continuation of the work described in Buitrago-Casas et al. (2017) that describes the implementations to reduce singly reflected X-rays. Outstanding scientific results based on the FOXSI observations are reported by Ishikawa et al. (2017), Athiray et al. (2020) and Vievering et al. (2021). Buitrago-Casas et al. (2021) describe the adaptation of the payload for a fourth rocket flight intended to observe a medium to large solar flare in 2024. The GitHub repository1 contains complete instructions on how to access and process FOXSI data collected during the first three rocket flights.
3. Quiet-Sun pointing with FOXSI-2
The FOXSI rocket experiment has successfully flown three times from the White Sands Missile Range. The second launch (FOXSI-2) took place on December 11, 2014, at 19:11:00 UTC and targeted the Sun for six minutes and 40.8 seconds starting at 19:12:42 UTC. The FOXSI-2 FOV was limited to about a quarter of the solar disk (see Fig. 1). We targeted five portions of the solar disk during the observation time to maximize science outcomes. The detailed list of FOXSI-2 targets is given in Athiray et al. (2020) and Vievering et al. (2021). One of the targets covered a portion of the quiet Sun at the solar north pole for a total of 92.7 s (see Fig. 1). We refer to this quiet-Sun target as target I, following the terminology coined by Vievering et al. (2021). The dark gray box in Fig. 1 is the FOV for one of the silicon detectors in FOXSI-2. All the other silicon detectors in the payload had the same FOV size, but were clocked in a set of different angles with respect to the one shown in Fig. 1.
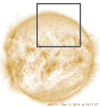 |
Fig. 1. FOXSI-2 quiet-Sun target, at the north solar pole, observed during the FOXSI-2 rocket flight. The background image is the AIA solar full disk in the 171 angstrom filter. The black square represents a sample of the FOXSI detector’s FOV. The payload pointed to this target for a total of 92.7 s on December 11, 2014 (from 19:17:13.5 UTC to 19:18:46.2 UTC). The last 24.2 s of this time were used to measure background via shutters placed in front of the detectors. |
For the last 24.2 s, pointing at target I, we remotely activated an attenuator wheel that placed thick aluminum disks on top of the detectors for background measurements. Later, in Sect. 7, we use these background measurements to assess the existence, or not, of a source of HXRs of solar origin in target I. The top part of Table 1 contains the total number of events observed with four of the silicon detectors when pointing to target I and during the background measurements.
ON/OFF analysis (input and output parameters) for the FOXSI-2 observations.
4. Quiet-Sun observation with FOXSI-3
The FOXSI-3 rocket campaign took place at the White Sands Missile Range. The rocket launched on September 7, 2018, at 17:21 UT and observed the Sun from 17:22:44.6 UT until 17:29:14.1 UT, for a total of six minutes and 29.5 seconds. The payload contained seven Wolter-I optics modules paired with semiconductor detectors (see Musset et al. 2019 for details of the payload). Four detectors had silicon strip sensors; two other detectors worked with finer pitch CdTe strip sensors (60 μm instead of the 75 μm used in the silicon sensors). These six detectors were optimized for observations in the 4–20 keV energy range. The seventh detector (PhoEnIX) was a 2048 × 2048 pixel CMOS sensor designed for soft X-ray observations (0.5–5.0 keV) (see Ishikawa et al. 2018 for details).
One of the primary goals for the FOXSI-3 rocket campaign was to place a more stringent HXR upper limit of the quiet Sun than previously reported. The launch of FOXSI-3 happened during a time of extremely low activity in the Sun. Figure 2 depicts a solar image in 171 Å (at the time of the FOXSI-3 launch) taken with the Atmospheric Imaging Assembly (AIA) on board the Solar Dynamic Observatory (SDO). A nonflaring aged active region can be identified in the western solar hemisphere. This active region was no longer intense enough to be labeled and included in the National Oceanic and Atmospheric Administration (NOAA) catalog. However, that active region existed for several solar rotations and was previously cataloged as NOAA AR12713 the last time it was sufficiently active (June 2018). Figure 2 also shows a coronal hole at the solar north pole and sparse small extreme ultraviolet (EUV) brightenings outside the aged active region.
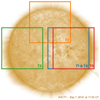 |
Fig. 2. Background image of the entire SDO/AIA 171 Å solar disk at the time of the FOXSI-3 observations (September 7, 2018, at 17:24 UT). Solar activity was very low at the time of the FOXSI-3 rocket launch. A very aged nonflaring active region was located in the western hemisphere. The colored squares represent the approximate FOV of a silicon detector and the targets during the FOXSI-3 observations. These boxes are approximate FOVs because every detector is clocked differently. |
FOXSI-3 pointed to the Sun and recorded data during 367.3 s total. FOXSI-3 targeted the aged active region for 128.2 s (blue T1 in Fig. 2), the north pole for 24.0 s (orange T2 in Fig. 2), the eastern quiet-Sun limb for 144.6 s (green T3 in Fig. 2), and returned to the aged active region for 26.3 s (blue T4 in Fig. 2). The observations concluded with a 2 arcmin shift toward the western limb where FOXSI-3 stayed for the remaining 44.2 s (red T5 in Fig. 2). Further details of the rocket campaign and the upgrades in the payload can be found in Musset et al. (2019).
For the study using FOXSI-3 data presented here, we limited our analysis only to observations of three silicon detectors flown in the rocket. The fourth silicon detector included in the payload (and the two CdTe detectors) presented relatively high electronic noise during the flight, making them unsuitable for low counts analysis. Due to the low solar activity, HXRs recorded by FOXSI-3 were very sparse. The top part of Table 2 summarizes the total number of events observed with each of the three silicon detectors (D102, D105, and D106) in the 5–10 keV energy range for every FOXSI-3 target (T1, T2, T3, T4, and T5).
FOXSI-3 observation summary.
Because of technical difficulties we did not activate attenuators for the FOXSI-3 flight. The consequence of not having attenuators for some fraction of the observation time is that we do not have in-flight background measurements.
5. Ghost ray treatment
FOXSI uses Wolter-I-figured grazing incidence X-ray telescopes to focus on solar X-rays. The Wolter-I geometry consists of two grazing-incidence mirror segments, a paraboloid primary mirror and a hyperboloid secondary reflector, referred to as mirror shells. On-axis rays that reflect on both mirrors are focused into an image on the focal plane. However, there is a possibility that rays from off-axis sources may reflect only on a single mirror shell and reach the focal plane. These single-reflecting rays are broadly referred to as stray light or ghost rays (see the right panel in Fig. 3). A full description of ghost rays for FOXSI, and strategies to minimize them (honeycomb structures used in FOXSI-3 for example), can be found in Musset et al. (2019) and Buitrago-Casas et al. (2017, 2020).
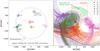 |
Fig. 3. Ghost ray characterization for the FOXSI-2 quiet-Sun observations. Left: full disk FeXVIII map constructed from the 94, 171, and 211 AIA/SDO maps following Del Zanna (2013). Seven intense, hot localized sources are identified. The center of target I at [200″, 750″] (FOXSI-2 optical axis) is shown in gray. The solid black circle represents the photosphere. The dashed black circle sets the upper radius limit above which quiet-Sun HXRs are not expected from (50 Mm above the photosphere). At this height, the ambient electron density gets lowered by more than four orders of magnitude compared to the photosphere (i.e., the HXR bremsstrahlung emission also gets substantially reduced; (see, e.g., Aschwanden 2006)). A few structures that are not circled, but seem as bright as others like S7, are ignored; because of their short off-axis distances, their ghost rays are negligible, as is the case for sources S2, S4, and S5. Right: simulated ghost rays generated by the five intense sources when pointing to target I. Each of the five source rays is color-coded according to the labels in the figure. The big black dashed circle represents the upper limit radius for coronal HXRs. The area in solid green sets the limit chosen as a region mostly free of ghost rays inside the solar disk. The red box is the FOV of one of the silicon detectors. The other silicon detectors in FOXSI-2 had the same FOV size, but were clocked with respect to the one shown in this figure. |
To assess ghost rays polluting the FOXSI FOV, we need to know every identifiable off-axis intense HXR source at the time of observing target I. We constructed an AIA Fe XVIII map for December 11, 2014, at 19:17 UTC (target I start time), using the method given by Del Zanna (2013). This map, displayed as the background image in the left panel of Fig. 3, shows the hottest components of the coronal plasma at the time of our observations (i.e., potential sources of HXRs). From this Fe XVIII map, seven compact off-axis kernels are easily identifiable as potential sources of ghost rays. We used a FOXSI customized ray-tracing simulation (see Buitrago-Casas et al. 2020) to assess the ghost ray effect that each of the seven compact sources has over the FOXSI-2 FOV. We show the results of this assessment in the right panel of Fig. 3. Although ghost rays impinge on a significant region within the detectors, they are constrained to an identifiable zone of the FOV. Our goal is not to characterize the intensity of ghost rays. Instead, we are trying to determine locations where ghost rays could reasonably be nonzero to exclude them from our analysis. Taking advantage of the ghost ray confinement, we can mask out ghost rays and define an area within the detector reasonably free of ghost ray light. Since our goal is to evaluate the solar origin of events FOXSI-2 observed, we selected a region (colored in green in the right panel of Fig. 3) from which coronal HXRs could originate. We study the events observed with FOXSI-2 in that region during the 64.5 s the rocket pointed to target I, before activating the attenuators. Additionally, we used the last 24.2 s of target I pointing as a background measurement.
6. Statistical issue: Assessing a weak source mixed with background data
Typically, in high-energy astrophysics and physics, experiments measuring discrete sets of events (counts) may contain multiple signals (source(s) of interest mixed with background(s)). It is common practice to take additional auxiliary measurements to assess the background(s) by setting the experiment in a configuration believed to be free of the source(s) of interest. In these sets of measurements, the goal is usually to establish an actual count rate for the source(s) of interest. For reasonably large numbers of counts, many straightforward statistical background subtraction techniques are suitable to determine the existence of genuine sources (see, e.g., McIvor 2000; Piccardi 2004; Benezeth et al. 2010). For faint sources and backgrounds, the measured counts are so few that usual Gaussian techniques based on normal distributions do not hold. Instead, Poisson and binomial distributions appropriately describe low count statistics. Li & Ma (1983) published a first thorough review of this source and background low count statistics problem. Such a problem is today known as the ON/OFF problem or the Li-Ma problem. Although Li & Ma (1983) proposed their statistical method originally in the context of gamma-ray astronomy, its generality is so wide that it can be directly applied to other fields in physics and astronomy. Particularly, the Li-Ma problem suits the FOXSI observations considered in this paper.
7. ON/OFF Li-Ma analysis
It is known that Non integer events measured by a counting experiment during a specific period of time follow the Poisson distribution (see, e.g., Li & Ma 1983; Gehrels 1986; Knoetig 2014; Casadei 2014)
 (1)
(1)
where λ is the non-negative real number of expected events, which is known as the Poisson parameter. In the most simple ON/OFF problem, the Li-Ma problem, the Non measured counts are supposed to result from s expected counts coming from a signal of interest overlaid with b expected counts from a background. The ON/OFF Li-Ma framework assumes that s and b are independent Poisson variables, meaning that the sum λ = s + b should follow a Poisson distribution with
 (2)
(2)
If Noff represents the number of background counts measured when the experiment was set in a signal-off configuration, the distribution of such background counts is also a Poisson distribution with
 (3)
(3)
In general, the observation times for the on and off experiment configurations, Ton and Toff, are not the same. To account for this difference, and others related to the details of the experiment setup (e.g., sensitive area A, detector livetimes lt, observed solid angle Ω), a parameter α is introduced in the ON/OFF problem framework defined as
 (4)
(4)
and is assumed to have negligible uncertainty (see, e.g., Berge et al. 2007). The expected counts from the background alone in the on- and off-signal of interest experiment setup (b and b′ respectively) relate via b = α b′.
Originally Li & Ma (1983) proposed assessing the significance of a weak signal mixed with a background by use of a hypothesis test (e.g., Wilks 1962; Eadie et al. 1971; Gregory 2005). Later, Knoetig (2014) and Casadei (2014) developed these hypothesis test methods further, proposing objective Bayesian solutions for the ON/OFF Li-Ma problem using the three measurable quantities Non, Noff, and α.
For the hypothesis test method, s and b are the unknown parameters, and the null hypothesis (H0) is that s ≡ 0 (i.e., the only signal is the background). The alternative hypothesis (H1) considers s > 0. The conditional probability of H0, P(H0|Non, Noff, α) is expressible in terms of the Bayes theorem (e.g., Knoetig 2014):
 (5)
(5)
Here, P(Non, Noff|H0, α) represents the probability of measuring Non and Noff, given a scenario where H0 is true. P(Non, Noff|α) is a normalization probability, and P0(H0) is the prior probability for H0.
There is a discussion among different authors regarding the effectiveness of different priors for the ON/OFF Li-Ma problem (e.g., Berger et al. 2001; Casadei 2014; Nosek & Nosková 2016). Nosek & Nosková (2016) thoroughly analyzed the effect that three well-known priors (scale-invariant, uniform, and Jeffreys) have on the ON/OFF Li-Ma method when applied to weak signals. Nosek & Nosková (2016) concluded that Bayesian inferences using the Jeffreys prior distributions are generally a safe compromise compared to the other priors they examined (scale invariant and uniform prior, for instance). Although the Jeffreys prior distributions require more complicated calculations based on integral expressions, it leads to reasonable limits of the source existence for close to zero observed counts. Knoetig (2014) implemented Jeffreys’ prior and found an analytical solution to the ON/OFF Li-Ma problem in terms of special integral functions (Gamma and hypergeometric). The inputs of Knoetig (2014)’s analytical solution are Non, Noff, and α. The outcomes are P(H0|Non, Noff, α), the Bayesian significance ![Mathematical equation: $ S_{\mathrm{b}}=\sqrt{2}\,\text{ erf}^{-1}[1-P(H_0|N_{\mathrm{on}},N_{\mathrm{off}},\alpha)] $](/articles/aa/full_html/2022/09/aa43272-22/aa43272-22-eq6.gif) , and a signal upper limit λσ, with an uncertainty of σ (see the details of the general analytical solution in Sect. 3.4 of Knoetig 2014). Knoetig’s solution is the one we implement here to analyze FOXSI-2 and -3 observations.
, and a signal upper limit λσ, with an uncertainty of σ (see the details of the general analytical solution in Sect. 3.4 of Knoetig 2014). Knoetig’s solution is the one we implement here to analyze FOXSI-2 and -3 observations.
8. ON/OFF Li-Ma analysis for FOXSI-2
In the search for HXRs of quiet-Sun origin, we applied Knoetig’s solution of the ON/OFF Li-Ma problem to the observations of target I in FOXSI-2. The first step is to set the off- and on-signal configurations. The off-signal observations occurred during the last 24.2 s of pointing to target I, after the attenuators were activated (i.e., blocking the solar flux from reaching the experiment detectors). The sensitive area was the whole detector for the off-signal configuration (i.e., 16 × 16 arcmin2). The on-signal observations consist of the counts recorded by a detector (during the 68.5 s of no-attenuators) within the green area described in the right panel of Fig. 3.
FOXSI-2 flew seven optics-detector assemblies. However, here we use only the four most reliable detectors to apply the ON/OFF Li-Ma analysis (hereafter D101, 104, D105, and D108). Of the remaining three detectors, two were a bit noisy for weak sources studies, and one was placed on a location in the payload with no attenuator (i.e., with no background measurement). All four detectors we use in this study had a silicon sensor and were positioned behind a seven-mirror optics module. Figure 4 shows the counts observed by one of these detectors (D105) during the on-signal configured observation. The ten green dots in Fig. 4 constitute Non; Noff for that same detector is four counts. We calculated α as the ratio of observation time (corrected by the detector livetimes) to the observed areas between the on- and off-configuration. For D105, α = 0.86. These values, and those for the other three analyzed detectors, are summarized in Table 1. Table 1 also displays the outcomes of Knoetig’s method for the four detectors: the probability of H0 (P(H0|Non, Noff, α)), the significance Sb, and the upper limit with a 2σ (97.72%) confidence.
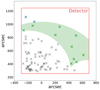 |
Fig. 4. Counts registered by one of the FOXSI-2 silicon detectors when pointing to target I. The area in solid green sets the limit chosen as a region mostly free of ghost rays inside the solar disk (see Fig. 3 for reference). The red square shows the FOV of one detector. All Xs in the plot are events recorded for one of the detectors. The dots are black if they are classified as ghost rays, green if the events fall within the solar region free of ghost rays, and blue if they are outside the solar disk. |
Knoetig’s method produces the distribution function for s (i.e., the probability P(s|Non, Noff, α, H1) as a function of the expected signal of interest counts). We can express such a distribution function in terms of the HXR flux from the whole Sun by using the conversion
 (6)
(6)
where Δt is the observation time (corrected by the detector livetime), ΔE is the observed energy bandwidth, and ΔA is the optics effective area averaged over the energy bands considered (5–10 keV). We additionally correct by the scale ratio of solid angles ( ) to get an estimate of the flux over the whole observable solar corona. Using the conversion in expression (6) we plot the probability distribution function for each of the four detectors in Fig. 5. Additionally, Fig. 5 displays vertical dashed lines indicating the upper limits with a 2σ certainty for distribution functions of each of the four detectors. Regardless of the very low count statistics, all four colored distribution functions in Fig. 5 exhibit similar behavior, with maximum probabilities around ∼0.03 s−1 cm−2 keV−1 and comparable upper limits.
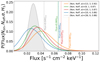 |
Fig. 5. Source flux distribution functions for four of the silicon detectors in FOXSI-2. The lines are colored to match Table 1. All four colored distribution functions show a similar profile. The slight differences among the lines can be attributed to low count statistical effects. The dashed vertical lines are the upper limits with a 2σ certainty for each of the four distribution functions. The gray-filled curve is the normalized distribution function putting together the observations of all four detectors (accounting for each detector livetime and average optics effective area). The corresponding upper limit (gray dashed line) corresponds to a HXR solar flux of > 0.045 s−1 cm−2 keV−1. The maximum value of the gray distribution function lies at ∼0.029 s−1 cm−2 keV−1. |
The gray filled curve in Fig. 5 corresponds to the normalized source distribution function, versus the HXR solar flux, using data from all four detectors put together (accounting for the respective livetimes and effective areas of each detector-optics ensemble). To compute the ON/OFF Li-Ma analysis for the combination of the four detectors, α is transformed into αcombined defined as
 (7)
(7)
where ∑d is the sum over each of the four detector-optics sets. When performing the single ON/OFF Li-Ma analysis for the four detectors combined, the statistical significance of the measurements improves, Sb = 4.4 (see Table 1). In general, such a high significance suggests the detection of a signal. However, we abstain from claiming that that signal comes from the quiet Sun for this particular case. The reason is that although we characterized the most severe sources of ghost rays, there may still be stray light of other origins that we are not accounting for. Such possible additional stray light could come from a relatively slight misalignment among the optics module axes (that we believe to be under ∼1.5 arcmin based on measurements performed before and after the rocket flight). The optics point spread function’s wings could also be another source of extra faint stray light. Within the calibration resources available in a sounding rocket program, it is not possible to completely rule out the presence of ghost rays in our measurement area. Instead, we report an upper limit for a signal of solar origin. Our careful ghost ray treatment enables this to be a highly sensitive limit. From the analysis that uses data from all four detectors, we found an upper limit for the HXR quiet-Sun flux of 0.045 s−1 cm−2 keV−1 with a 97.72% (2σ) certainty (dashed vertical gray line in Fig. 5). If we want to be conservative with the claims in this work, we can instead choose the largest of the four limits shown in Fig. 5. That conservative limit is 0.081 s−1 cm−2 keV−1 (dashed vertical orange line in Fig. 5).
9. Statistical analysis of the FOXSI-3 quiet-Sun observations
Because of the lack of in-flight background measurements during the FOXSI-3 observation, we used two alternatives to analyze the quiescent data collected during that flight. The first (hereafter the Gehrels method) sets upper limits assuming a source (or a mix of weak sources) described with a Poisson distribution. For our second approach we use background measurements taken in FOXSI-2 to set upper limits on the FOXSI-3 observations.
9.1. Gehrels method to set upper quiet-Sun limits for FOXSI-3
Gehrels (1986) provided a set of upper limit tables for hypothetical signal rates as the source(s) of a small number of observed events. We used the total number of counts observed by each of the three silicon detectors, summarized in Table 2, to set the upper limits in Table 3 for a 2σ confidence level. Table 3 also contains the upper limit flux (F2σ) computed using a modified version of Eq. (6), where we replace s in the expression with the values of λ2σ:
 (8)
(8)
FOXSI-3 upper limits with a 2σ confidence level (λ2σ, in counts).
Despite the impossibility of doing background removal, applying the Gehrels method over the more than six minutes of observation time during FOXSI-3 gives us upper limits that are over two orders of magnitude lower than what we found for FOXSI-2. This is further evidence that the region identified as free of ghost rays may still contain background X-rays of solar or nonsolar origin. Later, in Sect. 11, we discuss whether this difference may lie in an intrinsic correlation of the quiescent emission in HXRs with the phases of the solar cycle.
9.2. ON/OFF Li-Ma analysis on the FOXSI-3 observations
To implement the ON/OFF Li-Ma method, it is critical to have an OFF configured observation (i.e., a background measurement). We identified D105 as the single silicon detector flown in both FOXSI-2 and FOXSI-3 rocket campaigns. The FOXSI-2 and FOXSI-3 instruments were launched using the same type of rocket, comparable trajectory parameters, and similar ambient conditions for the payload. We can argue that because of the similarities of the two flights, we can use D105 background measurements from FOXSI-2 to apply the ON/OFF Li-Ma method with D105 observations recorded during FOXSI-3. Table 4 summarizes the result of applying such an ON/OFF Li-Ma analysis. We highlight that the HXR solar flux with a 2σ confidence level obtained with this method, F2σ = 9.6 × 10⁻⁴ s−1 cm−2 keV−1, is of the same order of magnitude as that found using the Gehrels method (which does not assume a background). The fact that the FOXSI-3 observation time was over six times longer than that of FOXSI-2 causes λ2σ to be significantly reduced (in this case, around 70 times smaller). Figure 6 shows the distribution function for D105 according to the ON/OFF Li-Ma analysis. There are two remarkable traits in Fig. 6. First, the distribution peak is at zero, consistent with the 89% probability that the null hypothesis is true. The null hypothesis demands no quiet-Sun sources observed in the FOXSI-3 data (i.e., all counts are solely background during the ON configured measurements) and second, as a consequence, the upper limits dramatically shift to lower values than those obtained for FOXSI-2 (see Fig. 5). There is a difference of over two orders of magnitude between the limits of FOXSI-2 and FOXSI-3. This difference, again, is the product of longer observation times, larger collecting areas (detectors free of ghost rays), and the fact that the whole Sun was quiet for the FOXSI-3 launch.
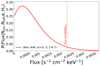 |
Fig. 6. Probability distribution function of a hypothetical HXR solar source as a function of its expected flux. This curve is constructed by implementing the ON/OFF Li-Ma method using FOXSI-3 observations and FOXSI-2 background measurements as the ON and OFF configurations, respectively. This figure corresponds to data registered by D105, which was the only silicon detector flown in FOXSI-2 and -3. |
ON/OFF analysis (input and output parameters) for the FOXSI-3 observations and FOXSI-2 background.
In Sects. 5 and 7 we presented a thorough analysis to identify regions free of ghost rays during the FOXSI-2 observations. For FOXSI-3, ghost rays are not a concern. The reasons lie in the fact that the Sun exhibited an extremely quiescent atmosphere for FOXSI-3 compared to FOXSI-2. During the FOXSI-3 observations, we scanned most of the solar disk (including the aged active region, which was the hottest part at the time), as depicted in Fig. 2. During those observations we did not find a single discernible intense compact source in HXRs. FOXSI-3 only registered sparse data, as shown in Table 2. According to Buitrago-Casas et al. (2020), ghost-ray intensities are one order of magnitude fainter than their focused counterparts. Therefore, any ghost-ray background in FOXSI-3 would have been one order of magnitude lower than what we observed within the detector’s fields of view. Since for FOXSI-3 both ghost rays and on-axis photons would have the same origin (quiet-Sun HXRs), the upper limits we report still hold.
10. Comparing our upper limits with those previously reported
Hannah et al. (2010) used ∼12 days of off-pointing RHESSI data to estimate upper limits for HXR quiet-Sun emission. Those ∼12 days of data correspond to observations during a period of solar cycle minimum. Hannah et al. (2010) reported upper thresholds for the photon flux, as shown in Fig. 7. In the same figure we overlap the three upper limits from our analyses. In orange we plot the upper limit we obtained by combining FOXSI-2 data from four silicon detectors (4.5 × 10⁻² s−1 cm−2 keV−1). In red, we show the upper limit we calculated using the ON/OFF Li-Ma method applied to D105 observations during FOXSI-3, and background measurements from FOXSI-2 (i.e., 9.6 × 10⁻⁴ s−1 cm−2 keV−1). The blue upper limit in Fig. 7 (6.0 × 10⁻⁴ s−1 cm−2 keV−1) is computed using the Gehrels method over data from three silicon detectors flown in FOXSI-3. For reference, the Hannah upper limits for the 3–6 keV and 6–12 keV are 3.4 × 10⁻² s−1 cm−2 keV−1 and 9.5 × 10⁻⁴ s−1 cm−2 keV−1, respectively. The FOXSI-2 and -3 limits found in this work are similar to the deepest limits for solar HXR emission yet reported (Hannah et al. 2010).
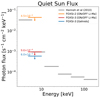 |
Fig. 7. Upper limits of the quiet-Sun photon flux spectrum. The thresholds in gray are taken from Hannah et al. (2010). They correspond to 2σ limits calculated based on the analysis of 11.9 days of solar off-pointing observations with RHESSI during solar quiescent conditions. The three upper limits found using FOXSI-2 and -3 data are overlapping, all three in the 5–10 keV energy range. The limit in orange (4.5 × 10⁻² s−1 cm−2 keV−1) is calculated by implementing the ON/OFF Li-Ma method over an area free of ghost rays during ∼1 min of FOXSI-2 observations. The threshold in red (9.6 × 10⁻⁴ s−1 cm−2 keV−1) corresponds to the upper limit obtained by combining FOXSI-3 measurements of only one detector that also had background measurements from the FOXSI-2 flight. This limit was also computed by implementing the ON/OFF Li-Ma method. The blue bar (6.0 × 10⁻⁴ s−1 cm−2 keV−1) is the upper threshold estimated from the 6.49 min of observations with three FOXSI-3 silicon detectors combined. For this last threshold (blue), the Gehrels (1986) approach was used to set the upper expected rate of a hypothetical source of solar origin. |
Hannah et al. (2010) used the limits they found with RHESSI to constrain the parameter space of an isothermal model and thin-target emission models (power-law and kappa distributions) for the solar corona. Hannah et al. (2010) showed with their limits that it is unlikely for nanoflares with nonthermal effects to be involved in heating the quiet corona. They concluded that such nanoflares would require a steep electron spectrum E−δ with δ > 5 extending to very low energies into the thermal energy range (< 1 keV). Remarkably, the upper limits we found using FOXSI-3 data are in statistical agreement with those reported by Hannah et al. (2010). Thus, all the conclusions asserted by Hannah et al. (2010) about the nature of nanoflares in the quiet-Sun still hold.
11. Discussion and conclusions
In this paper we provided for the first time a quantitative limit of the quiet-Sun HXR flux using data taken exclusively with the FOXSI sounding rocket instrument. We used data from FOXSI’s second and third flights, corresponding to high and low solar cycle activity periods, respectively.
Because of the high solar activity during the FOXSI-2 flight, the Sun had several bright compact HXR sources distributed all over the disk. When located off-axis, such compact sources produced ghost rays extending partially into the FOXSI detector areas. We characterized the ghost rays impact on the instrument by implementing a ray-tracing simulation. Using those algorithms, we identified areas within the detectors mostly free of ghost rays. This approach allowed us for the first time to assess the flux in HXRs of a quiescent solar region during a time of substantially high solar activity. This is something that has never been possible to do before with solar HXR telescopes that use indirect imaging techniques like RHESSI. We implemented a Bayesian analysis optimized for very low statistics (the Li-Ma ON/OFF method) to estimate an upper threshold of 0.045 s−1 cm−2 keV−1 for the HXR flux (5–10 keV) within the identified quiet-Sun area almost entirely free of ghost rays.
This paper is also the first science work that uses FOXSI-3 data. The Sun was at solar minimum when FOXSI-3 flew. Only a very aged active region observable in EUV was present on the solar disk. No compact source in HXRs was discernible during the time the FOXSI-3 payload targeted the Sun. We used the entire 6.49 min of rocket observation time to assess the HXR quiet-Sun flux for this period of minimum solar activity. We set upper limits for this flux implementing two independent techniques. We calculated an upper limit of 9.6 × 10⁻⁴ s−1 cm−2 keV−1 applying the Li-Ma ON/OFF method over data of one detector flown in FOXSI-2 (for background measurements) and FOXSI-3 (for direct quiet-Sun observations). The lowest quiet-Sun HXR flux upper limit we report here is 6.0 × 10⁻⁴ s−1 cm−2 keV−1. We obtained this limit using data from the three silicon detectors combined (all flown in FOXSI-3) and applying the Gehrels method, purely based on Poisson statistics.
The exact nature of why the FOXSI-2 upper limit is almost two orders of magnitude higher than the FOXSI-3 limits is not fully clear. Naïvely, this difference suggests that the quiet-Sun HXR flux during a time of intense solar activity (the case for FOXSI-2) might be higher than its counterpart during a minimum in the solar cycle (scenario for FOXSI-3). We cannot entirely rule out this possibility. However, there is a caveat in this case. For FOXSI-2, we isolated a region within the solar disk free of the most intense ghost rays. Even so, some remnant ghost rays from other weaker sources could potentially still be getting into the detectors, affecting our estimated FOXSI-2 constraints. Very recently, Purkhart & Veronig (2022) studied nanoflares in quiet-Sun regions during solar cycle 24 using SDO/AIA image series to assess their contribution to coronal heating during different levels of solar activity. They reported no correlation between the derived nanoflare energy flux and the solar activity level. Although the Purkhart & Veronig (2022) analyses are in EUV and not in HXRs, their results further discourage the hypothesis that the different limits we obtained from FOXSI-2 and -3 reflect an intrinsic disparity in the quiescent emission between different phases of the solar cycle.
Direct focusing HXRs brings the possibility of assessing quiet-Sun emission during periods of high solar activity. However, additional optical elements need to be part of the instrument to diminish ghost rays. Future space-based solar HXR telescopes using Wolter-I optics should implement ways to minimize (if not entirely block) ghost rays to analyze quiet-Sun emissions during maximums of solar activity. Further observations will give a definite answer on whether or not quiet-Sun HXR fluxes correlate with the solar cycle.
The HXR upper limits we calculate here using FOXSI data can be compared with prior reported constraints. Figure 7 compares our FOXSI limits (in the 5–10 keV energy range) with those estimated by Hannah et al. (2010) using almost 12 cumulated days of RHESSI solar off-pointing observations during periods of minimum activity. Hannah et al. (2010) binned the limits using the following energy bins; 3–6 keV, 6–12 keV, 12–25 keV, 25–50 keV, 50–100 keV, and 100–200 keV. The upper limits Hannah et al. (2010) report for the 3–6 keV and the 6–12 keV energy range, with a 2σ confidence level, are 3.4 × 10⁻² s−1 cm−2 keV−1 and 9.5 × 10⁻⁴ s−1 cm−2 keV−1, respectively. All the quiet-Sun HXR limits we report in this paper are in agreement with those thresholds calculated by Hannah et al. (2010). In particular, the FOXSI-3 limits that correspond to a period of minimum solar activity are of the same order of magnitude as the 6–12 keV limit from Hannah et al. (2010), ∼10−3 s−1 cm−2 keV−1.
Hannah et al. (2010) not only reported upper limits, they also presented interpretations of what these limits imply over possible solar physical processes with the potential of producing HXR emissions. Such interpretations include the assessment of nanoflare isothermal emission, nanoflare nonthermal thick-target and thin-target emissions, and solar axions. Since the FOXSI limits are not substantially lower than those from Hannah et al. (2010), all their physical interpretations still hold. In particular, FOXSI limits continue to agree with the isothermal emission constraints that Hannah et al. (2010) estimated (see Fig. 3 in their paper) and compared with results from previous missions that observed the quiet-Sun in X-rays, like Sphinx (Sylwester et al. 2010).
More recently, in Marsh et al. (2017) searched for HXR emission in the quiet solar corona with the Nuclear Spectroscopic Telescope Array (NuSTAR) satellite. They used the first observations of the quiet Sun with NuSTAR, which occurred on November 1, 2014. At the time of these observations, an off-axis solar active region contributed a notable amount of ghost rays. Marsh et al. (2017) were interested in searching for transient HXR brightenings present in the quiet Sun. To do so, they looked for increases in HXRs on timescales of 100 s in two energy bands, 2.5–4 keV and 10–20 keV. For the 10–20 keV, they additionally searched for brightenings with timescales of 30 and 60 s. Marsh et al. (2017) set upper limits of ∼17 s−1 cm−2 keV−1 for the 2.5–4 keV energy range, and 0.17 s−1 cm−2 keV−1 for 4–20 keV. This last limit is almost four times higher than the FOXSI-2 upper quiet-Sun threshold and two orders of magnitude higher than the limits from FOXSI-3. Marsh et al. (2017) discussed that during their quiet-Sun NuSTAR observations the nonsolar background would be the dominant source of high-energy emission in the NuSTAR FoV. Marsh et al. (2017) cited Wik et al. (2014), who give incident background rates of ∼2 × 10⁻⁵ s−1 cm−2 keV−1 for 4–20 keV, to support their argument.
We highlight that with observations of only about one minute for FOXSI-2 and about six minutes for FOXSI-3, we obtained quiet-Sun HXR upper limits comparable with previous observations of ∼12 days long (Hannah et al. 2010). As demonstrated by Sylwester et al. (2010), with observations extending over months of low levels of solar X-ray activity, the sensitivity increases for quiet-Sun emission assessments. Particularly for a satellite mission version of FOXSI, we anticipate an increased sensitivity by two to three orders of magnitude.
Acknowledgments
The first author of this paper is funded by the NASA FINESST grant 80NSSC19K1438. The FOXSI sounding rocket experiment is funded by NASA grants NNX11AB75G, NNX16AL60G, and 80NSSC21K0030. The Univeristy of Minnesota team is supported by an NSF Faculty Development Grant (AGS-1429512), an NSF CAREER award (NSF-AGS-1752268), and the SolFER DRIVE center (80NSSC20K0627). This work was also supported by JSPS KAKENHI Grant Numbers 22H00134, 21KK0052, JP18H03724, JP18H05463, JP17H04832, JP16H02170, JP16H03966, JP15H03647, JP24244021, JP21540251, JP20244017, and World Premier International Research Center Initiative (WPI), MEXT, Japan. The FOXSI team is grateful to the NSROC teams at WSMR and Wallops for the excellent operation of their systems. Furthermore, the authors would like to acknowledge the contributions of each member of the FOXSI experiment team to the project, particularly our team members at ISAS and Kavli IPMU for the provision of Si and CdTe detectors and at MSFC for the fabrication of the focusing optics.
References
- Aschwanden, M. 2006, Physics of the Solar Corona: an Introduction with Problems and Solutions (Springer Science& Business Media) [Google Scholar]
- Athiray, P., Buitrago-Casas, J. C., Bergstedt, K., et al. 2017, in UV, X-Ray, and Gamma-Ray Space Instrumentation for Astronomy XX, International Society for Optics and Photonics, 10397, 103970A [Google Scholar]
- Athiray, P., Vievering, J., Glesener, L., et al. 2020, ApJ, 891, 78 [NASA ADS] [CrossRef] [Google Scholar]
- Benezeth, Y., Jodoin, P.-M., Emile, B., Laurent, H., & Rosenberger, C. 2010, J. Electron. Imag., 19, 033003 [NASA ADS] [CrossRef] [Google Scholar]
- Berge, D., Funk, S., & Hinton, J. 2007, A&A, 466, 1219 [CrossRef] [EDP Sciences] [Google Scholar]
- Berger, J. O., Pericchi, L. R., Ghosh, J., et al. 2001, Lecture Notes-Monograph Ser., 135 [Google Scholar]
- Bogachev, S. A., Ulyanov, A. S., Kirichenko, A. S., Loboda, I. P., & Reva, A. A. 2020, Physics-Uspekhi, 63, 783 [NASA ADS] [CrossRef] [Google Scholar]
- Buitrago-Casas, J. C., Elsner, R., Glesener, L., et al. 2017, in Optics for EUV, X-Ray, and Gamma-Ray Astronomy VIII, International Society for Optics and Photonics, 10399, 103990J [NASA ADS] [Google Scholar]
- Buitrago-Casas, J., Christe, S., Glesener, L., et al. 2020, J. Instrum., 15, P11032 [NASA ADS] [CrossRef] [Google Scholar]
- Buitrago-Casas, J. C., Vievering, J., Musset, S., et al. 2021, in UV, X-Ray, and Gamma-Ray Space Instrumentation for Astronomy XXII, International Society for Optics and Photonics, 11821, 118210L [Google Scholar]
- Casadei, D. 2014, ApJ, 798, 5 [NASA ADS] [CrossRef] [Google Scholar]
- Christe, S., Hannah, I., Krucker, S., McTiernan, J., & Lin, R. P. 2008, ApJ, 677, 1385 [NASA ADS] [CrossRef] [Google Scholar]
- Christe, S., Glesener, L., Buitrago-Casas, C., et al. 2016, J. Astron. Instrum., 5, 1640005 [CrossRef] [Google Scholar]
- Del Zanna, G. 2013, A&A, 558, A73 [NASA ADS] [CrossRef] [EDP Sciences] [Google Scholar]
- Dudík, J., Dzifčáková, E., Meyer-Vernet, N., et al. 2017a, Solar Physics, 292, 1 [CrossRef] [Google Scholar]
- Dudík, J., Polito, V., Dzifčáková, E., Del Zanna, G., & Testa, P. 2017b, ApJ, 842, 19 [CrossRef] [Google Scholar]
- Duncan, J., Glesener, L., Grefenstette, B. W., et al. 2021, ApJ, 908, 29 [CrossRef] [Google Scholar]
- Eadie, W. T., Drijard, D., & James, F. E. 1971, Statistical Methods in Experimental Physics (Amsterdam: North-Holland) [Google Scholar]
- Furukawa, K., Buitrago-Casas, J. C., Vievering, J., et al. 2019, Nucl. Instrum. Methods Phys. Res. Sect. A, 924, 321 [CrossRef] [Google Scholar]
- Gehrels, N. 1986, ApJ, 303, 336 [Google Scholar]
- Glesener, L., Krucker, S., Christe, S., et al. 2016, Space Telescopes and Instrumentation 2016: Ultraviolet to Gamma Ray, 9905, 99050E [NASA ADS] [CrossRef] [Google Scholar]
- Glesener, L., Krucker, S., Duncan, J., et al. 2020, ApJ, 891, L34 [Google Scholar]
- Gregory, P. 2005, Bayesian Logical Data Analysis for the Physical Sciences: A Comparative Approach with Mathematica Support (Cambridge: Cambridge University Press) [CrossRef] [Google Scholar]
- Hannah, I., Hudson, H., Hurford, G., & Lin, R. 2010, ApJ, 724, 487 [NASA ADS] [CrossRef] [Google Scholar]
- Hannah, I., Hudson, H., Battaglia, M., et al. 2011, Space Sci. Rev., 159, 263 [NASA ADS] [CrossRef] [Google Scholar]
- Hudson, H. 1991, Sol. Phys., 133, 357 [NASA ADS] [CrossRef] [Google Scholar]
- Ishikawa, S.-N., Glesener, L., Krucker, S., et al. 2017, Nat. Astron., 1, 771 [NASA ADS] [CrossRef] [Google Scholar]
- Ishikawa, S. N., Takahashi, T., Watanabe, S., et al. 2018, Nucl. Instrum. Methods Phys. Res. Sect. A, 912, 191 [CrossRef] [Google Scholar]
- James, T., & Subramanian, P. 2018, MNRAS, 479, 1603 [NASA ADS] [CrossRef] [Google Scholar]
- Klimchuk, J. A. 2006, Sol. Phys., 234, 41 [Google Scholar]
- Klimchuk, J. A. 2015, Phil. Trans. Roy. Soc. A: Math. Phys. Eng. Sci., 373, 20140256 [CrossRef] [Google Scholar]
- Knoetig, M. L. 2014, ApJ, 790, 106 [NASA ADS] [CrossRef] [Google Scholar]
- Krucker, S., Christe, S., Glesener, L., et al. 2013, in Solar Physics and Space Weather Instrumentation V, International Society for Optics and Photonics, 8862, 88620R [NASA ADS] [CrossRef] [Google Scholar]
- Krucker, S., Christe, S., Glesener, L., et al. 2014, ApJ, 793, L32 [NASA ADS] [CrossRef] [Google Scholar]
- Li, T.-P., & Ma, Y.-Q. 1983, ApJ, 272, 317 [Google Scholar]
- Marsh, A. J., Smith, D. M., Glesener, L., et al. 2017, ApJ, 849, 131 [NASA ADS] [CrossRef] [Google Scholar]
- McIvor, A. M. 2000, Proc. Image Vision Comput., 4, 3099 [Google Scholar]
- Mondal, S., Oberoi, D., & Mohan, A. 2020, ApJ, 895, L39 [NASA ADS] [CrossRef] [Google Scholar]
- Musset, S., Buitrago-Casas, J. C., Glesener, L., et al. 2019, in UV, X-Ray, and Gamma-Ray Space Instrumentation for Astronomy XXI, International Society for Optics and Photonics, 11118, 1111812 [Google Scholar]
- Nosek, D., & Nosková, J. 2016, Nucl. Instrum. Methods Phys. Res. Sect. A, 820, 23 [CrossRef] [Google Scholar]
- Parker, E. N. 1988, ApJ, 330, 474 [Google Scholar]
- Piccardi, M. 2004, 2004 IEEE International Conference on Systems, Man and Cybernetics (IEEE Cat. No. 04CH37583) (IEEE), 4, 3099 [CrossRef] [Google Scholar]
- Purkhart, S., & Veronig, A. M. 2022, A&A, 661, A149 [NASA ADS] [CrossRef] [EDP Sciences] [Google Scholar]
- Ramsey, B. D. 2005, Exp. Astron., 20, 85 [Google Scholar]
- Sylwester, J., Kowalinski, M., Gburek, S., et al. 2010, EOS Trans., 91, 73 [NASA ADS] [CrossRef] [Google Scholar]
- Testa, P., De Pontieu, B., Allred, J., et al. 2014, Science, 346, 315 [NASA ADS] [CrossRef] [Google Scholar]
- Testa, P., Polito, V., & De Pontieu, B. 2020, ApJ, 889, 124 [Google Scholar]
- Vievering, J. T., Glesener, L., Athiray, P. S., et al. 2021, ApJ, 913, 15 [CrossRef] [Google Scholar]
- Wik, D. R., Hornstrup, A., Molendi, S., et al. 2014, ApJ, 792, 48 [NASA ADS] [CrossRef] [Google Scholar]
- Wilks, S. S. 1962, Mathematical Statistics (Oxford: Oxford University Press) [Google Scholar]
All Tables
ON/OFF analysis (input and output parameters) for the FOXSI-3 observations and FOXSI-2 background.
All Figures
|
Fig. 1. FOXSI-2 quiet-Sun target, at the north solar pole, observed during the FOXSI-2 rocket flight. The background image is the AIA solar full disk in the 171 angstrom filter. The black square represents a sample of the FOXSI detector’s FOV. The payload pointed to this target for a total of 92.7 s on December 11, 2014 (from 19:17:13.5 UTC to 19:18:46.2 UTC). The last 24.2 s of this time were used to measure background via shutters placed in front of the detectors. |
| In the text | |
|
Fig. 2. Background image of the entire SDO/AIA 171 Å solar disk at the time of the FOXSI-3 observations (September 7, 2018, at 17:24 UT). Solar activity was very low at the time of the FOXSI-3 rocket launch. A very aged nonflaring active region was located in the western hemisphere. The colored squares represent the approximate FOV of a silicon detector and the targets during the FOXSI-3 observations. These boxes are approximate FOVs because every detector is clocked differently. |
| In the text | |
|
Fig. 3. Ghost ray characterization for the FOXSI-2 quiet-Sun observations. Left: full disk FeXVIII map constructed from the 94, 171, and 211 AIA/SDO maps following Del Zanna (2013). Seven intense, hot localized sources are identified. The center of target I at [200″, 750″] (FOXSI-2 optical axis) is shown in gray. The solid black circle represents the photosphere. The dashed black circle sets the upper radius limit above which quiet-Sun HXRs are not expected from (50 Mm above the photosphere). At this height, the ambient electron density gets lowered by more than four orders of magnitude compared to the photosphere (i.e., the HXR bremsstrahlung emission also gets substantially reduced; (see, e.g., Aschwanden 2006)). A few structures that are not circled, but seem as bright as others like S7, are ignored; because of their short off-axis distances, their ghost rays are negligible, as is the case for sources S2, S4, and S5. Right: simulated ghost rays generated by the five intense sources when pointing to target I. Each of the five source rays is color-coded according to the labels in the figure. The big black dashed circle represents the upper limit radius for coronal HXRs. The area in solid green sets the limit chosen as a region mostly free of ghost rays inside the solar disk. The red box is the FOV of one of the silicon detectors. The other silicon detectors in FOXSI-2 had the same FOV size, but were clocked with respect to the one shown in this figure. |
| In the text | |
|
Fig. 4. Counts registered by one of the FOXSI-2 silicon detectors when pointing to target I. The area in solid green sets the limit chosen as a region mostly free of ghost rays inside the solar disk (see Fig. 3 for reference). The red square shows the FOV of one detector. All Xs in the plot are events recorded for one of the detectors. The dots are black if they are classified as ghost rays, green if the events fall within the solar region free of ghost rays, and blue if they are outside the solar disk. |
| In the text | |
|
Fig. 5. Source flux distribution functions for four of the silicon detectors in FOXSI-2. The lines are colored to match Table 1. All four colored distribution functions show a similar profile. The slight differences among the lines can be attributed to low count statistical effects. The dashed vertical lines are the upper limits with a 2σ certainty for each of the four distribution functions. The gray-filled curve is the normalized distribution function putting together the observations of all four detectors (accounting for each detector livetime and average optics effective area). The corresponding upper limit (gray dashed line) corresponds to a HXR solar flux of > 0.045 s−1 cm−2 keV−1. The maximum value of the gray distribution function lies at ∼0.029 s−1 cm−2 keV−1. |
| In the text | |
|
Fig. 6. Probability distribution function of a hypothetical HXR solar source as a function of its expected flux. This curve is constructed by implementing the ON/OFF Li-Ma method using FOXSI-3 observations and FOXSI-2 background measurements as the ON and OFF configurations, respectively. This figure corresponds to data registered by D105, which was the only silicon detector flown in FOXSI-2 and -3. |
| In the text | |
|
Fig. 7. Upper limits of the quiet-Sun photon flux spectrum. The thresholds in gray are taken from Hannah et al. (2010). They correspond to 2σ limits calculated based on the analysis of 11.9 days of solar off-pointing observations with RHESSI during solar quiescent conditions. The three upper limits found using FOXSI-2 and -3 data are overlapping, all three in the 5–10 keV energy range. The limit in orange (4.5 × 10⁻² s−1 cm−2 keV−1) is calculated by implementing the ON/OFF Li-Ma method over an area free of ghost rays during ∼1 min of FOXSI-2 observations. The threshold in red (9.6 × 10⁻⁴ s−1 cm−2 keV−1) corresponds to the upper limit obtained by combining FOXSI-3 measurements of only one detector that also had background measurements from the FOXSI-2 flight. This limit was also computed by implementing the ON/OFF Li-Ma method. The blue bar (6.0 × 10⁻⁴ s−1 cm−2 keV−1) is the upper threshold estimated from the 6.49 min of observations with three FOXSI-3 silicon detectors combined. For this last threshold (blue), the Gehrels (1986) approach was used to set the upper expected rate of a hypothetical source of solar origin. |
| In the text | |
Current usage metrics show cumulative count of Article Views (full-text article views including HTML views, PDF and ePub downloads, according to the available data) and Abstracts Views on Vision4Press platform.
Data correspond to usage on the plateform after 2015. The current usage metrics is available 48-96 hours after online publication and is updated daily on week days.
Initial download of the metrics may take a while.