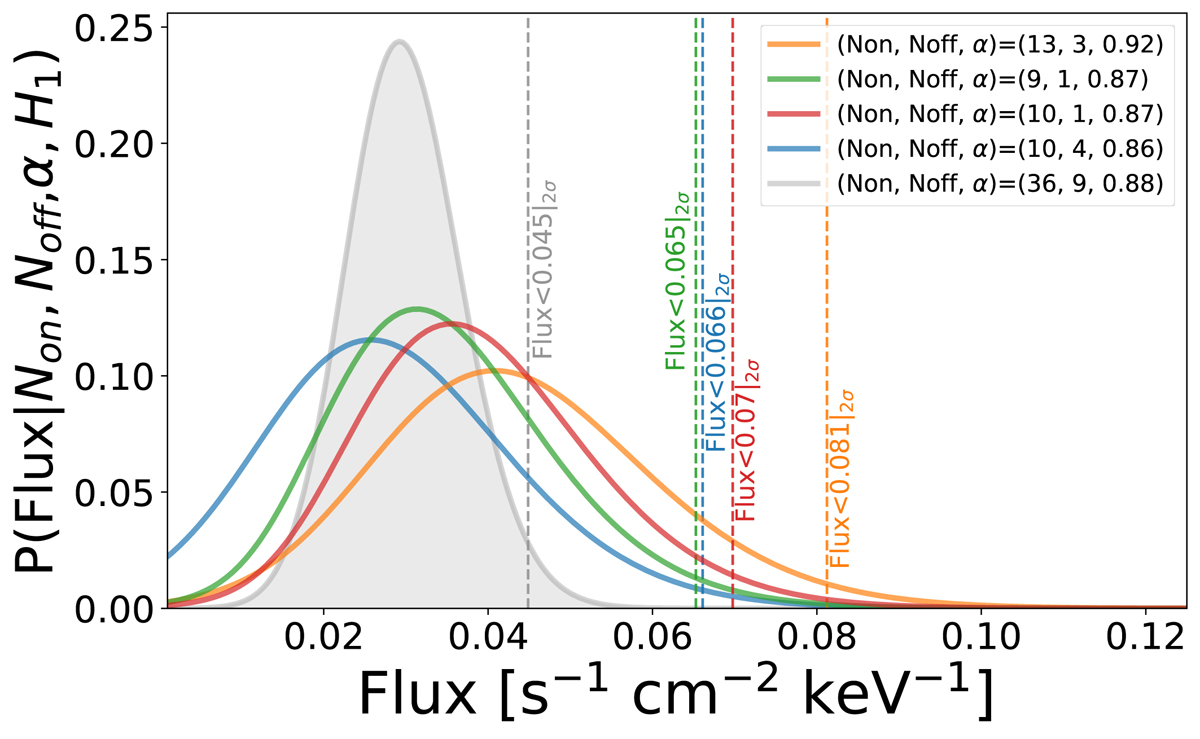
Fig. 5.
Download original image
Source flux distribution functions for four of the silicon detectors in FOXSI-2. The lines are colored to match Table 1. All four colored distribution functions show a similar profile. The slight differences among the lines can be attributed to low count statistical effects. The dashed vertical lines are the upper limits with a 2σ certainty for each of the four distribution functions. The gray-filled curve is the normalized distribution function putting together the observations of all four detectors (accounting for each detector livetime and average optics effective area). The corresponding upper limit (gray dashed line) corresponds to a HXR solar flux of > 0.045 s−1 cm−2 keV−1. The maximum value of the gray distribution function lies at ∼0.029 s−1 cm−2 keV−1.
Current usage metrics show cumulative count of Article Views (full-text article views including HTML views, PDF and ePub downloads, according to the available data) and Abstracts Views on Vision4Press platform.
Data correspond to usage on the plateform after 2015. The current usage metrics is available 48-96 hours after online publication and is updated daily on week days.
Initial download of the metrics may take a while.