Fig. 3.
Download original image
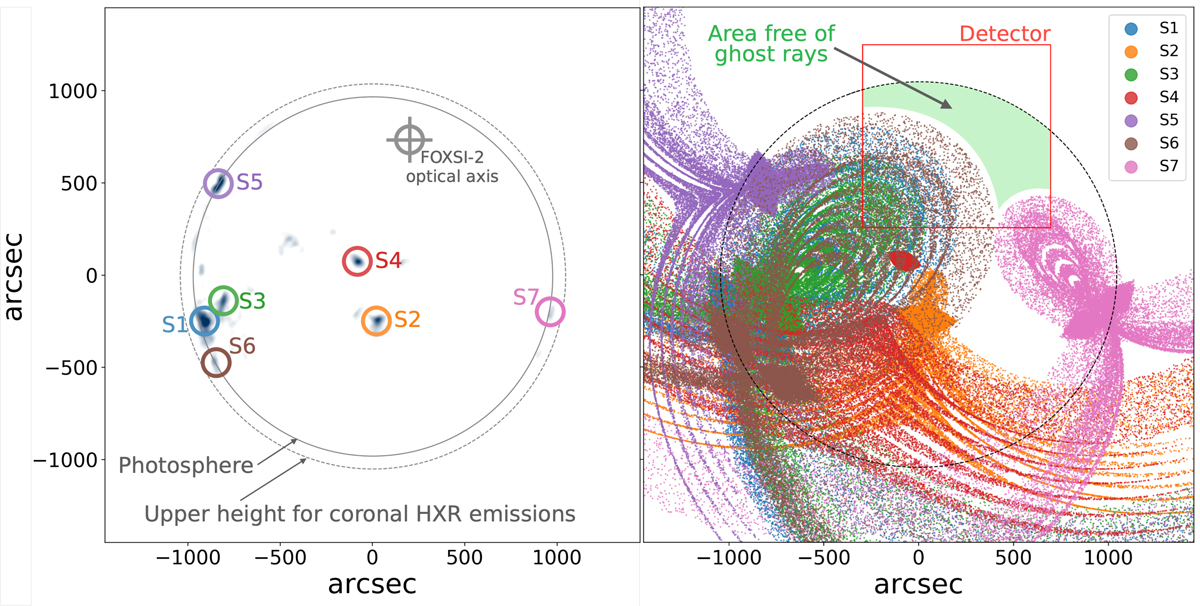
Ghost ray characterization for the FOXSI-2 quiet-Sun observations. Left: full disk FeXVIII map constructed from the 94, 171, and 211 AIA/SDO maps following Del Zanna (2013). Seven intense, hot localized sources are identified. The center of target I at [200″, 750″] (FOXSI-2 optical axis) is shown in gray. The solid black circle represents the photosphere. The dashed black circle sets the upper radius limit above which quiet-Sun HXRs are not expected from (50 Mm above the photosphere). At this height, the ambient electron density gets lowered by more than four orders of magnitude compared to the photosphere (i.e., the HXR bremsstrahlung emission also gets substantially reduced; (see, e.g., Aschwanden 2006)). A few structures that are not circled, but seem as bright as others like S7, are ignored; because of their short off-axis distances, their ghost rays are negligible, as is the case for sources S2, S4, and S5. Right: simulated ghost rays generated by the five intense sources when pointing to target I. Each of the five source rays is color-coded according to the labels in the figure. The big black dashed circle represents the upper limit radius for coronal HXRs. The area in solid green sets the limit chosen as a region mostly free of ghost rays inside the solar disk. The red box is the FOV of one of the silicon detectors. The other silicon detectors in FOXSI-2 had the same FOV size, but were clocked with respect to the one shown in this figure.
Current usage metrics show cumulative count of Article Views (full-text article views including HTML views, PDF and ePub downloads, according to the available data) and Abstracts Views on Vision4Press platform.
Data correspond to usage on the plateform after 2015. The current usage metrics is available 48-96 hours after online publication and is updated daily on week days.
Initial download of the metrics may take a while.