| Issue |
A&A
Volume 664, August 2022
|
|
|---|---|---|
| Article Number | L11 | |
| Number of page(s) | 6 | |
| Section | Letters to the Editor | |
| DOI | https://doi.org/10.1051/0004-6361/202244047 | |
| Published online | 17 August 2022 | |
Letter to the Editor
Circumnuclear dense gas disk fuelling the active galactic nucleus in the nearby radio galaxy NGC 4261
1
The Research Institute for Time Studies, Yamaguchi University, 1677-1 Yoshida, Yamaguchi, Yamaguchi 753-8511, Japan
e-mail: This email address is being protected from spambots. You need JavaScript enabled to view it.
2
Graduate School of Science, Osaka Metropolitan University, 1-1 Gakuen-cho, Naka-ku, Sakai, Osaka 599-8531, Japan
3
Joint ALMA Observatory, Alonso de Córdova 3107, Vitacura, Santiago 763-0355, Chile
4
NAOJ Chile Observatory, Alonso de Córdova 3788, Oficina 61B, Vitacura, Santiago, Chile
5
Department of Physics and Astronomy, Seoul National University, 1 Gwanak-ro, Gwanak-gu, Seoul 08826, Korea
Received:
18
May
2022
Accepted:
2
August
2022
Abstract
The cold molecular gas in the circumnuclear disk (CND) of radio galaxies provides critical information for understanding the mass accretion onto active galactic nuclei. We present the first detection and maps of HCN J = 1–0 and HCO+J = 1–0 emission lines from the circumnuclear region of a nearby radio galaxy, NGC 4261, using the Northern Extended Millimeter Array. Both molecular lines are detected at a radial velocity of ±700 km s−1 relative to the systemic velocity of the galaxy, and they arise from a CND with an outer radius of 100 pc. The velocity fields of HCN and HCO+ are fitted with a Keplerian disk rotation. The enclosed mass is (1.6 ± 0.1) × 109 M⊙, assuming a disk inclination angle of 64°. The continuum image at 80 GHz reveals a weak two-sided jet structure extending over 5 kpc along the east–west direction and a bright core at the centre. The continuum spectrum between 80 and 230 GHz shows a spectral index of −0.34 ± 0.02, which suggests optically thin synchrotron radiation. The dense gas mass associated with the CND is calculated to be 6.03 × 10⁷ M⊙. It supports a positive correlation between the dense gas mass in the CND and the accretion rate onto the supermassive black hole, though there are uncertainties in the parameters of the correlation.
Key words: ISM: molecules / galaxies: active / galaxies: ISM / galaxies: jets / galaxies: nuclei / radio lines: galaxies
© S. Sawada-Satoh et al. 2022
 Open Access article, published by EDP Sciences, under the terms of the Creative Commons Attribution License (https://creativecommons.org/licenses/by/4.0), which permits unrestricted use, distribution, and reproduction in any medium, provided the original work is properly cited.
This article is published in open access under the Subscribe-to-Open model. This email address is being protected from spambots. You need JavaScript enabled to view it. to support open access publication.
1. Introduction
It is widely accepted that an active galactic nucleus (AGN) is powered by mass accretion onto a supermassive black hole (SMBH) in the centre of the host galaxy. The gravitational energy of accreting matter is converted into radiation and/or jets. Radio galaxies (RGs) are radio-loud AGNs characterised by powerful synchrotron radiation driven by relativistic jets on scales approximately in the range 10–100 kiloparsec.
The interstellar medium (ISM) in the centre of the RGs can play a key role in fuelling the SMBH. Several research groups have suggested that the different roles of hot and cool ISM accretion can be related to a different mode of accretion in RGs, which can lead to different radio-loud AGN classifications (Hardcastle et al. 2007; Buttiglione et al. 2010; Best & Heckman 2012). Certain CO observations of RGs support the hypothesis that RGs are fed by cold gas that probes the circumnuclear disks (CNDs; Prandoni et al. 2010; Maccagni et al. 2018; Ruffa et al. 2019). The CNDs of RGs can serve as a reservoir of fuel for their SMBHs. Thus, by determining the molecular gas structure and kinematics of CNDs, important clues can be obtained regarding mass accretion in RGs. High angular resolution imaging of the molecular gas within the SMBH sphere of influence (rg) can also be a powerful tool for accurately measuring SMBH masses (e.g., Davis et al. 2013).
However, the distribution of low-J CO lines appears to extend to the edge of CNDs, and the detection of strong CO emission from within rg seems to be rare for CNDs in early-type galaxies (ETGs; Davis et al. 2018; Boizelle et al. 2019; North et al. 2019). Alternative lines may trace the molecular gas distribution within rg better, thereby enabling more accurate measurements of SMBH masses. At present, emission lines other than CO have largely been overlooked, and dense gas tracers such as HCN and HCO+ lines are expected to trace possibly farther into rg than the optically thick low-J CO lines. Moreover, recent interferometric observations of the dense gas emission-line tracer HCN towards Seyfert galaxies (SGs) have indicated that the accretion onto SMBHs is triggered by star formation and supernovae originating from within CNDs (Izumi et al. 2016). To date, star formation activities in CNDs have been investigated in a limited number of RGs, such as NGC 5128 (Espada et al. 2019), NGC 1052 (Kameno et al. 2020), and NGC 1275 (Nagai & Kawakatu 2021). These investigations of RGs have been primarily conducted using the distribution of CO as a molecular gas mass tracer. Dense gas tracers can potentially serve as better probes for examining star formation activity in CNDs because star formation is closely related to dense gas.
NGC 4261 (3C 270) is a nearby Fanaroff–Riley I RG with a symmetric, kiloparsec-scale two-sided jet (Birkinshaw & Davies 1985). Its AGN is classified as a type 2 low-ionisation nuclear emission-line region (LINER) galaxy (Jaffe et al. 1996; Ho et al. 1997) with a low Eddington ratio, Lbol/LEdd, ranging from 10−5.11 to 10−4.54 (Hernández-García et al. 2013; Inayoshi et al. 2020) and a low X-ray luminosity of L2−10 keV = 1041.51 erg s−1 (Hernández-García et al. 2013). This galaxy is known to have a nuclear disk of dust and gas with a radius of a few hundred parsecs lying orthogonal to the jet, as revealed by Hubble Space Telescope (HST) observations (Jaffe et al. 1993, 1996).
At radio frequencies, H I absorption has been detected at the systemic velocity of the galaxy (Vsys) towards the core via the Very Large Array (VLA; Jaffe & McNamara 1994), and it has been confirmed at a projected distance of approximately 2.5 pc from the core with the European Very Long Baseline Interferometry (VLBI) Network (van Langevelde et al. 2000). The H I absorbing gas is interpreted to be in the inner part of the disk of dust and gas found in the HST image, and it obscures the core and innermost counter jet. Subsequent VLBI observations at multiple frequencies revealed the presence of parsec-scale ionised absorbing gas, which was likely at the inner parsec-scale radii of the HST disk (Jones & Wehrle 1997; Jones et al. 2000, 2001; Haga et al. 2015). Molecular lines were observed towards the centre of NGC 4261 for emission (CO J = 2–1 and J = 3–2; Boizelle et al. 2021) and absorption (CO J = 1–0; Jaffe & McNamara 1994).
In this Letter, we report the first detection and the interferometric emission-line maps of HCN J = 1–0 and HCO+J = 1–0 transitions in NGC 4261, which trace a 100-parsec rotating CND perpendicular to the kiloparsec-scale radio jet. We adopt a luminosity distance (DL) of 31.7 Mpc and a Vsys of 2212 km s−1 (e.g., Babyk et al. 2019; Cappellari et al. 2011). Hence, 1 arcsec corresponds to 151 pc for the galaxy.
2. Observations and data reduction
Observations were conducted on February 15, 2019, with the NOrthern Extended Millimeter Array (NOEMA) of the Institut de radioastronomie millimétrique (IRAM) in A configuration with ten antennas. The phase centre was set to the position of NGC 4261 at RA(J2000) = 12h19m23.s220 and Dec(J2000) = 05°49′30 775. The full width at half maximum of the NOEMA primary beam was 55″ at 88 GHz. The projected baseline lengths ranged from 22 to 734 m over the course of the observations. The local oscillator frequency was set to 82.0 GHz, with frequencies ranging from 70.398 to 78.115 GHz in the lower sideband and from 85.886 to 93.603 GHz in the upper sideband. The PolyFix correlator was configured with a frequency resolution of 2 MHz. The nearby source 3C 273 was observed as both the bandpass and gain calibrators. The absolute flux calibration was performed using MWC 349 (1.07 Jy) and LkHα101 (0.22 Jy). The absolute flux calibration uncertainty for NOEMA is less than 10% at Band 1 (λ3 mm)1.
The raw visibility data were first converted into the Flexible Image Transport System (FITS) format data through the GILDAS software (Pety 2005). Then, calibration and imaging were performed by using the NRAO Astronomical Image Processing System (AIPS) package (Greisen 1990). We applied uniform weighting to the images to obtain a higher spatial resolution of < 1″. To create the continuum map, all line-free spectral windows with frequency ranges of 70.398–74.459, 74.461–78.115, and 89.948–93.603 GHz were combined, resulting in a centre frequency of 80 GHz. After the continuum emission was subtracted in the u − v plane, channel maps of lines were made every 20 MHz, corresponding to a velocity resolution of 68 km s−1.
3. Results
3.1. Continuum emission
Figure 1 shows a bright compact source at the phase centre and weak jet features spanning 5 kpc aligned along the east-west direction. The position angle (PA) of the alignment is estimated as 87 ± 1° via a linear-regression fit to the jet features. This estimation is in agreement with the 5 GHz radio jet PA of 88 ± 2° imaged with the VLA (Birkinshaw & Davies 1985). The bright compact source is partially resolved into a core at ΔRA =  along with the east and west nuclear jet components at
  and
and  , respectively. The peak position of the continuum emission coincides with that of the phase centre. The flux density of the compact core within the central ±3″ is measured as S80 GHz = 360 mJy by means of a two-dimensional Gaussian fit using the AIPS task JMFIT. Together with literature flux measurements, S115 GHz = 326.34 ± 0.82 mJy observed with the IRAM 30 m telescope (Ocaña Flaquer et al. 2010), S236 GHz = 253 ± 25 mJy, and S348 GHz = 223 ± 22 mJy from Atacama Large Millimeter/submillimeter Array projects 2017.1.00301.S and 2017.1.01638.S (Boizelle, priv. comm.), we find a spectrum Sν ∝ να with α = −0.34 ± 0.02 in the 80-348 GHz range. This core spectrum is very inconsistent with thermal emission, although it is still somewhat shallower than canonical synchrotron values measured in the extended jets, suggesting a partially optically thick core environment.
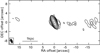 |
Fig. 1. Continuum map of NGC 4261 at 80 GHz. Contours begin at the 3σ level and increase by factors of |


3.2. HCN and HCO+ emission
The spectral profiles of the HCN J = 1–0 and HCO+J = 1–0 emission lines integrated over the region within the central ±1″ are shown in Fig. 2. Both molecular lines are detected above the 3σ level within a velocity range of ±700 km s−1 from Vsys. Furthermore, both lines are below the 3σ level in the channels around Vsys and exhibit a nearly symmetrical double-peaked spectral profile. The double-peaked spectra resemble the double-horned profile expected from an inclined rotating disk with a central depression or a cavity (e.g., Wiklind et al. 1997). In addition, a possible absorption feature is detected at the redshifted frequencies of C2H N = 1–0 with a significance of 3σ in the deepest absorption channel. The detected feature could be a blend of six hyperfine components of C2H N = 1–0 (J = 3/2–1/2, F = 1–1, 2–1, 1–0, and J = 1/2–1/2, F = 1–1, 0–1, 1–0).
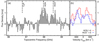 |
Fig. 2. Integrated spectrum over the region within ±1″ of the core from 85.886 to 89.946 GHz, after subtracting continuum emission. The frequency resolution is 20 MHz, and the rms noise is 0.28 mJy. (a) Spectrum as functions of topocentric frequency in GHz. The vertical dashed lines represent Vsys for each molecular line. (b) Spectra of HCN J = 1–0 and HCO+J = 1–0 emission lines as functions of velocity with respect to Vsys. |
The velocity-integrated intensity (moment-0) maps of the HCN J = 1–0 and HCO+J = 1–0 emission lines shown in Figs. 3a and b reveal a single component, which spatially coincides with the central continuum peak. A faint feature can be seen  east of the phase centre in the HCN moment-0 map, but it does not reach the 4σ level. A least-squares ellipse fit to the regions defined by the 4σ contour of the integrated intensity for each moment-0 map is listed in Table 1. The extent of the significant HCN emission spans
  (210 pc) along the north-south direction (PA = 2°), which is slightly longer than a beam size of
  . The distribution of HCO+ emission is more concentrated at the centre and the HCO+ component is fainter. Both of these molecular lines originate from the same
  -diameter dust disk found in the HST images (Jaffe et al. 1993, 1996) and are more centrally concentrated compared to the CO J = 2–1 emission that spans 2″ in prior interferometric observations (Boizelle et al. 2021). The intensity-weighted velocity (moment-1) map of HCN (Fig. 3c) tentatively shows a velocity gradient along the major axis, perpendicular to the jet PA. The distribution and velocity structure of the HCN line are in agreement with those obtained for CO J = 2–1 and J = 3–2 lines (Boizelle et al. 2021). Furthermore, the moment-1 map of HCO+ (Fig. 3d) roughly follows the velocity gradient along the north-south direction, although the velocity gradient is less evident than that of HCN. It should be noted that the HCO+ distribution appears to exhibit a barely resolved disk structure. Thus, multiple velocity features should be spatially unresolved.
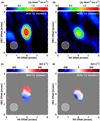 |
Fig. 3. Integrated intensity (moment-0) maps of (a) HCN J = 1–0 and (b) HCO+J = 1–0 lines towards the central ±2″. Both moment-0 images use the same colour scaling from 0 to 1.50 Jy beam−1 km s−1 and the same contour levels in steps of 4σ, where σ = 8.8 × 10⁻² Jy beam−1 km s−1. The peak intensity is 1.50 and 0.87 Jy beam−1 km s−1 for HCN and HCO+, respectively. Intensity-weighted velocity (moment-1) maps of (c) HCN J=1–0 and (d) HCO+J = 1–0 lines towards the central ±2″, with the same color scaling from −800 to +800 km s−1 in relative velocity with respect to Vsys. All maps are restored with a circular Gaussian beam of |


Elliptical fit parameters to integrated intensities of HCN and HCO+.
The HCN J = 1–0 to HCO+J = 1–0 ratio (RHCN/HCO+) and the HCN J = 1–0 to CO J = 1–0 ratio (RHCN/CO) are proposed to be good indicators of an AGN-dominated environment in SGs (Kohno et al. 2001; Kohno 2005). Velocity-integrated flux densities of HCN (SHCNΔV) and HCO+ (SHCO+ΔV) within the central ±1″ are 1.48 and 0.79 Jy km s−1, respectively. We derive the RHCN/HCO+ = 1.87 on sub-kiloparsec scales, which is consistent with the mean ratio of 1.84 ± 0.43 for a sample of AGN host galaxies (Privon et al. 2015). Assuming the CO J = 2–1 to J = 1–0 intensity ratio R21 = 0.79 from the xCOLD (extended CO Legacy Database) for GASS (GALEX Arecibo SDSS Survey) sample of nearby galaxies (Koss et al. 2021) and the velocity-integrated flux density of CO J = 2–1 of 3.06 Jy km s−1 measured for NGC 4261 (Boizelle et al. 2021), we get RHCN/CO = 0.38. The resultant line ratios RHCN/HCO+ of 1.87 and RHCN/CO of 0.38 in NGC 4261 are typical values expected for ‘pure’ AGNs with the absence of any associated nuclear starburst activity (Kohno 2005).
4. Discussions
4.1. Keplerian rotation of CNDs
Luminosity-weighted moment-1 measurements for J = 1–0 emission lines of HCN and HCO+ along the major axis (PA = 0°) are shown in Fig. 4. Data points are derived from the velocity slice across the centre along PA = 0° in the HCN and HCO+ moment-1 maps (Figs. 3c,d). We performed a linear fit to the HCN data points at a position offset within  and a Keplerian rotation fit to the HCN data at
  and
and  . The HCN data points and their best-fit Keplerian rotation curves indicate that the HCN emission traces the rotation with a radius in the range 66–130 pc. The enclosed mass estimated from the Keplerian rotation fitting is (1.6 ± 0.1) × 109 M⊙, after adopting a disk inclination angle of 64° (Ferrarese et al. 1996). This is in good agreement with the black hole mass measurement made using the CO lines (1.67 × 10⁹ M⊙; Boizelle et al. 2021), while it is three times larger than the mass determination inside
  (14.5 pc) based on the ionised gas kinematics (4.9 × 10⁸ M⊙; Ferrarese et al. 1996). The HCO+ data also appear to display a velocity gradient along the major axis, while the data points are more scattered from the linear gradient. This could be due to the barely resolved HCO+ multiple velocity features. The best-fit rotational gas model for the HCO+ data is consistent with the Keplerian rotational model obtained from the HCN data. This implies that HCN and HCO+ emission trace the same galaxy potential for the same radii of approximately 60–130 pc.
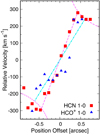 |
Fig. 4. Luminosity-weighted moment-1 measurements in declination for HCN and HCO+ lines. The dashed magenta line represents the best-fit Keplerian rotation model to the HCN data (red squares). The dot-dashed cyan line indicates a linear gradient fit to the HCO+ data (blue triangles). The straight dashed lines in magenta and cyan correspond to a rotating gas ring with a radius of 66 and 92 pc, respectively. |
4.2. Mass of dense molecular gas in CNDs
The HCN line luminosity has been used to estimate the mass of the dense molecular gas, by applying the HCN luminosity-to-mass conversion factor αHCN.
Using the HCN line luminosity in accordance with Solomon et al. (1997) and Tan et al. (2018), the dense molecular gas mass (Mdg) is as follows:
 (1)
(1)
where αHCN denotes the HCN luminosity-to-dense-gas-mass conversion factor in M⊙ (K km s−1 pc2)−1,  denotes the HCN luminosity in K km s−1 pc2, SHCNΔV denotes the velocity-integrated flux density of HCN in Jy km s−1, νobs denotes the observed line frequency in GHz and DL denotes the luminosity distance in Mpc. We obtain
  K km s−1 pc2.
The luminosity-to-mass conversion factor, αHCN, can vary from 0.24 to over 20 M⊙ (K km s−1 pc2)−1 (Barcos-Muñoz et al. 2018; Evans et al. 2020; Jones et al. 2021), depending on the gas density and the line opacity (Jones et al. 2021; Wang et al. 2021). If we consider the standard extragalactic conversion factor αHCN of 10 M⊙ (K km s−1 pc2)−1 (Gao & Solomon 2004), Mdg is calculated to be 6.03 × 10⁷ M⊙. This value is over five times higher than the total gas mass Mgas = 1.12 × 10⁷ M⊙ reported by Boizelle et al. (2021) using a typical CO conversion. The adopted conversion factor αHCN = 10 could be an order of magnitude too large because NGC 4261 has a higher RHCN/CO compared with other galaxies. The values of Mdg and Mgas (107 M⊙) are consistent with CND masses on 100 pc scales in galaxies of various types, including SGs, ETGs, and RGs (e.g., Izumi et al. 2016; Boizelle et al. 2017; García-Burillo et al. 2019; Ruffa et al. 2019). In contrast, it is significantly more massive than the molecular gas mass of the 100 pc CND in other nearby RGs: NGC 5128 (2 × 10⁶ M⊙; McCoy et al. 2017) and NGC 1052 (5.3 × 10⁵ M⊙; Kameno et al. 2020). Interestingly, these three RGs show dissimilar CND characteristics to one another despite many resemblances, such as the classification of a LINER AGN, the bright and two-sided radio jets, the presence of a surrounding torus, the central condensation of the ionised gas, and the central high column density of hydrogen (e.g., Marconi et al. 2000; Kameno et al. 2001; Markowitz et al. 2007; Baloković et al. 2021). Further observations in a larger sample of RGs are required to understand the variety of the observed CND characteristics.
4.3. Mdg–ṀBH correlation
Izumi et al. (2016) report a positive correlation between Mdg and the black hole mass accretion rate, ṀBH, for SGs. By applying an Mdg of 6.03 × 10⁷ M⊙ and using our measurement to the regression line for Mdg and ṀBH offered by Izumi et al. (2016), the inferred ṀBH corresponds to 10−2.48 M⊙ yr−1. This value is comparable to an ṀBH of 10−2.70 M⊙ yr−1, which is obtained by using the Lbol–ṀBH relation (Alexander & Hickox 2012):
 (2)
(2)
where η = 0.1 is a typical value for mass–energy efficiency conversion (Marconi et al. 2004) and Lbol is equal to 1042.6 erg s−1 for NGC 4261, as reported by Hermosa Muñoz et al. (2022).
The derived Mdg appears to be in agreement with the positive correlation between Mdg and ṀBH at the CND scale in NGC 4261. It should be noted, however, that there are significant uncertainties in αHCN, the L2−10 keV–Lbol relation (e.g., Eracleous et al. 2010), and the confidence interval in the correct η to use in general SGs.
5. Conclusions
We mapped the central 5 kpc of NGC 4261 with NOEMA in the HCN and HCO+J = 1–0 lines and the 80 GHz continuum. The continuum image reveals a core-dominant synchrotron jet structure, which consists of a bright central source and weak jet features aligned along the east-west direction. HCN and HCO+ emission lines are detected in NGC 4261 for the first time, covering a velocity range of ±700 km s−1 relative to Vsys. The molecular gas is distributed in a rotating sub-kiloparsec disk structure, which coincides with the bright central source in position. The Keplerian rotation model obtained from the velocity fields of HCN and HCO+ yields an enclosed mass of (1.6 ± 0.1) × 109 M⊙. Using the HCN line luminosity and the standard extragalactic luminosity-to-mass conversion factor, the dense gas mass, Mdg, associated with the CND is estimated to be 6.03 × 10⁷ M⊙. This value is comparable to a typical CND mass measured in galaxies of various types, including SGs, ETGs, and RGs. The derived Mdg and ṀBH in NGC 4261 align with the positive correlation between Mdg and ṀBH seen in SGs, which supports the scenario that star formation in CNDs drives mass accretion onto SMBHs, although there are significant uncertainties in the parameters of the correlation.
IRAM NOEMA Data Reduction CookBook, https://www.iram.fr/IRAMFR/GILDAS/doc/html/pdbi-cookbook-html/pdbi-cookbook.html
Acknowledgments
We acknowledge the anonymous referee for valuable comments that improved our manuscript. This work is based on IRAM/NOEMA observations carried out under project number W18CK. IRAM is supported by INSU/CNRS (France), MPG (Germany) and IGN (Spain). S.S.-S. is supported by JSPS KAKENHI grant No. 21K03628. S.K. is supported by JSPS KAKENHI grant No. 18K0371.
References
- Alexander, D. M., & Hickox, R. C. 2012, New Astron. Rev., 56, 93 [Google Scholar]
- Babyk, I. V., McNamara, B. R., Tamhane, P. D., et al. 2019, ApJ, 887, 149 [NASA ADS] [CrossRef] [Google Scholar]
- Baloković, M., Cabral, S. E., Brenneman, L., & Urry, C. M. 2021, ApJ, 916, 90 [CrossRef] [Google Scholar]
- Barcos-Muñoz, L., Aalto, S., Thompson, T. A., et al. 2018, ApJ, 853, L28 [Google Scholar]
- Best, P. N., & Heckman, T. M. 2012, MNRAS, 421, 1569 [NASA ADS] [CrossRef] [Google Scholar]
- Birkinshaw, M., & Davies, R. L. 1985, ApJ, 291, 32 [NASA ADS] [CrossRef] [Google Scholar]
- Boizelle, B. D., Barth, A. J., Darling, J., et al. 2017, ApJ, 845, 170 [NASA ADS] [CrossRef] [Google Scholar]
- Boizelle, B. D., Barth, A. J., Walsh, J. L., et al. 2019, ApJ, 881, 10 [Google Scholar]
- Boizelle, B. D., Walsh, J. L., Barth, A. J., et al. 2021, ApJ, 908, 19 [NASA ADS] [CrossRef] [Google Scholar]
- Buttiglione, S., Capetti, A., Celotti, A., et al. 2010, A&A, 509, A6 [NASA ADS] [CrossRef] [EDP Sciences] [Google Scholar]
- Cappellari, M., Emsellem, E., Krajnović, D., et al. 2011, MNRAS, 413, 813 [Google Scholar]
- Davis, T. A., Bureau, M., Cappellari, M., Sarzi, M., & Blitz, L. 2013, Nature, 494, 328 [NASA ADS] [CrossRef] [Google Scholar]
- Davis, T. A., Bureau, M., Onishi, K., et al. 2018, MNRAS, 473, 3818 [NASA ADS] [CrossRef] [Google Scholar]
- Eracleous, M., Hwang, J. A., & Flohic, H. M. L. G. 2010, ApJS, 187, 135 [NASA ADS] [CrossRef] [Google Scholar]
- Espada, D., Verley, S., Miura, R. E., et al. 2019, ApJ, 887, 88 [Google Scholar]
- Evans, I., N. J., Kim, K. T., Wu, J., et al. 2020, ApJ, 894, 103 [NASA ADS] [CrossRef] [Google Scholar]
- Ferrarese, L., Ford, H. C., & Jaffe, W. 1996, ApJ, 470, 444 [NASA ADS] [CrossRef] [Google Scholar]
- Gao, Y., & Solomon, P. M. 2004, ApJS, 152, 63 [Google Scholar]
- García-Burillo, S., Combes, F., Ramos Almeida, C., et al. 2019, A&A, 632, A61 [Google Scholar]
- Greisen, E. W. 1990, in Acquisition. Processing and Archiving of Astronomical Images, 125 [Google Scholar]
- Haga, T., Doi, A., Murata, Y., et al. 2015, ApJ, 807, 15 [NASA ADS] [CrossRef] [Google Scholar]
- Hardcastle, M. J., Evans, D. A., & Croston, J. H. 2007, MNRAS, 376, 1849 [NASA ADS] [CrossRef] [Google Scholar]
- Hermosa Muñoz, L., Márquez, I., Cazzoli, S., Masegosa, J., & Agís-González, B. 2022, A&A, 660, A133 [NASA ADS] [CrossRef] [EDP Sciences] [Google Scholar]
- Hernández-García, L., González-Martín, O., Márquez, I., & Masegosa, J. 2013, A&A, 556, A47 [NASA ADS] [CrossRef] [EDP Sciences] [Google Scholar]
- Ho, L. C., Filippenko, A. V., & Sargent, W. L. W. 1997, ApJS, 112, 315 [NASA ADS] [CrossRef] [Google Scholar]
- Inayoshi, K., Ichikawa, K., & Ho, L. C. 2020, ApJ, 894, 141 [NASA ADS] [CrossRef] [Google Scholar]
- Izumi, T., Kawakatu, N., & Kohno, K. 2016, ApJ, 827, 81 [NASA ADS] [CrossRef] [Google Scholar]
- Jaffe, W., & McNamara, B. R. 1994, ApJ, 434, 110 [NASA ADS] [CrossRef] [Google Scholar]
- Jaffe, W., Ford, H. C., Ferrarese, L., van den Bosch, F., & O’Connell, R. W. 1993, Nature, 364, 213 [Google Scholar]
- Jaffe, W., Ford, H., Ferrarese, L., van den Bosch, F., & O’Connell, R. W. 1996, ApJ, 460, 214 [NASA ADS] [CrossRef] [Google Scholar]
- Jones, D. L., & Wehrle, A. E. 1997, ApJ, 484, 186 [NASA ADS] [CrossRef] [Google Scholar]
- Jones, D. L., Wehrle, A. E., Meier, D. L., & Piner, B. G. 2000, ApJ, 534, 165 [NASA ADS] [CrossRef] [Google Scholar]
- Jones, D. L., Wehrle, A. E., Piner, B. G., & Meier, D. L. 2001, ApJ, 553, 968 [NASA ADS] [CrossRef] [Google Scholar]
- Jones, G. H., Clark, P. C., Glover, S. C. O., & Hacar, A. 2021, ArXiv e-prints [arXiv:2112.05543] [Google Scholar]
- Kameno, S., Sawada-Satoh, S., Inoue, M., Shen, Z.-Q., & Wajima, K. 2001, PASJ, 53, 169 [NASA ADS] [CrossRef] [Google Scholar]
- Kameno, S., Sawada-Satoh, S., Impellizzeri, C. M. V., et al. 2020, ApJ, 895, 73 [CrossRef] [Google Scholar]
- Kohno, K. 2005, in The Evolution of Starbursts, eds. S. Hüttmeister, E. Manthey, D. Bomans, & K. Weis, AIP Conf. Ser., 783, 203 [Google Scholar]
- Kohno, K., Matsushita, S., Vila-Vilaró, B., et al. 2001, in The Central Kiloparsec of Starbursts and AGN: The La Palma Connection, eds. J. H. Knapen, J. E. Beckman, I. Shlosman,&T. J. Mahoney, ASP Conf. Ser., 249, 672 [NASA ADS] [Google Scholar]
- Koss, M. J., Strittmatter, B., Lamperti, I., et al. 2021, ApJS, 252, 29 [CrossRef] [Google Scholar]
- Maccagni, F. M., Morganti, R., Oosterloo, T. A., Oonk, J. B. R., & Emonts, B. H. C. 2018, A&A, 614, A42 [NASA ADS] [CrossRef] [EDP Sciences] [Google Scholar]
- Marconi, A., Schreier, E. J., Koekemoer, A., et al. 2000, ApJ, 528, 276 [NASA ADS] [CrossRef] [Google Scholar]
- Marconi, A., Risaliti, G., Gilli, R., et al. 2004, MNRAS, 351, 169 [Google Scholar]
- Markowitz, A., Takahashi, T., Watanabe, S., et al. 2007, ApJ, 665, 209 [NASA ADS] [CrossRef] [Google Scholar]
- McCoy, M., Ott, J., Meier, D. S., et al. 2017, ApJ, 851, 76 [NASA ADS] [CrossRef] [Google Scholar]
- Nagai, H., & Kawakatu, N. 2021, ApJ, 914, L11 [NASA ADS] [CrossRef] [Google Scholar]
- North, E. V., Davis, T. A., Bureau, M., et al. 2019, MNRAS, 490, 319 [Google Scholar]
- Ocaña Flaquer, B., Leon, S., Combes, F., & Lim, J. 2010, A&A, 518, A9 [Google Scholar]
- Pety, J. 2005, in SF2A-2005: Semaine de l’Astrophysique Francaise, eds. F. Casoli, T. Contini, J. M. Hameury, & L. Pagani, 721 [Google Scholar]
- Prandoni, I., Laing, R. A., de Ruiter, H. R., & Parma, P. 2010, A&A, 523, A38 [NASA ADS] [CrossRef] [EDP Sciences] [Google Scholar]
- Privon, G. C., Herrero-Illana, R., Evans, A. S., et al. 2015, ApJ, 814, 39 [CrossRef] [Google Scholar]
- Ruffa, I., Prandoni, I., Laing, R. A., et al. 2019, MNRAS, 484, 4239 [NASA ADS] [CrossRef] [Google Scholar]
- Solomon, P. M., Downes, D., Radford, S. J. E., & Barrett, J. W. 1997, ApJ, 478, 144 [NASA ADS] [CrossRef] [Google Scholar]
- Tan, Q.-H., Gao, Y., Zhang, Z.-Y., et al. 2018, ApJ, 860, 165 [NASA ADS] [CrossRef] [Google Scholar]
- van Langevelde, H. J., Pihlström, Y. M., Conway, J. E., Jaffe, W., & Schilizzi, R. T. 2000, A&A, 354, L45 [NASA ADS] [Google Scholar]
- Wang, J. Z., Liu, S., Zhang, Z. Y., & Shi, Y. 2021, A&A, 649, A125 [NASA ADS] [CrossRef] [EDP Sciences] [Google Scholar]
- Wiklind, T., Combes, F., Henkel, C., & Wyrowski, F. 1997, A&A, 323, 727 [NASA ADS] [Google Scholar]
All Tables
All Figures
|
Fig. 1. Continuum map of NGC 4261 at 80 GHz. Contours begin at the 3σ level and increase by factors of |
| In the text | |
|
Fig. 2. Integrated spectrum over the region within ±1″ of the core from 85.886 to 89.946 GHz, after subtracting continuum emission. The frequency resolution is 20 MHz, and the rms noise is 0.28 mJy. (a) Spectrum as functions of topocentric frequency in GHz. The vertical dashed lines represent Vsys for each molecular line. (b) Spectra of HCN J = 1–0 and HCO+J = 1–0 emission lines as functions of velocity with respect to Vsys. |
| In the text | |
|
Fig. 3. Integrated intensity (moment-0) maps of (a) HCN J = 1–0 and (b) HCO+J = 1–0 lines towards the central ±2″. Both moment-0 images use the same colour scaling from 0 to 1.50 Jy beam−1 km s−1 and the same contour levels in steps of 4σ, where σ = 8.8 × 10⁻² Jy beam−1 km s−1. The peak intensity is 1.50 and 0.87 Jy beam−1 km s−1 for HCN and HCO+, respectively. Intensity-weighted velocity (moment-1) maps of (c) HCN J=1–0 and (d) HCO+J = 1–0 lines towards the central ±2″, with the same color scaling from −800 to +800 km s−1 in relative velocity with respect to Vsys. All maps are restored with a circular Gaussian beam of |
| In the text | |
|
Fig. 4. Luminosity-weighted moment-1 measurements in declination for HCN and HCO+ lines. The dashed magenta line represents the best-fit Keplerian rotation model to the HCN data (red squares). The dot-dashed cyan line indicates a linear gradient fit to the HCO+ data (blue triangles). The straight dashed lines in magenta and cyan correspond to a rotating gas ring with a radius of 66 and 92 pc, respectively. |
| In the text | |
Current usage metrics show cumulative count of Article Views (full-text article views including HTML views, PDF and ePub downloads, according to the available data) and Abstracts Views on Vision4Press platform.
Data correspond to usage on the plateform after 2015. The current usage metrics is available 48-96 hours after online publication and is updated daily on week days.
Initial download of the metrics may take a while.