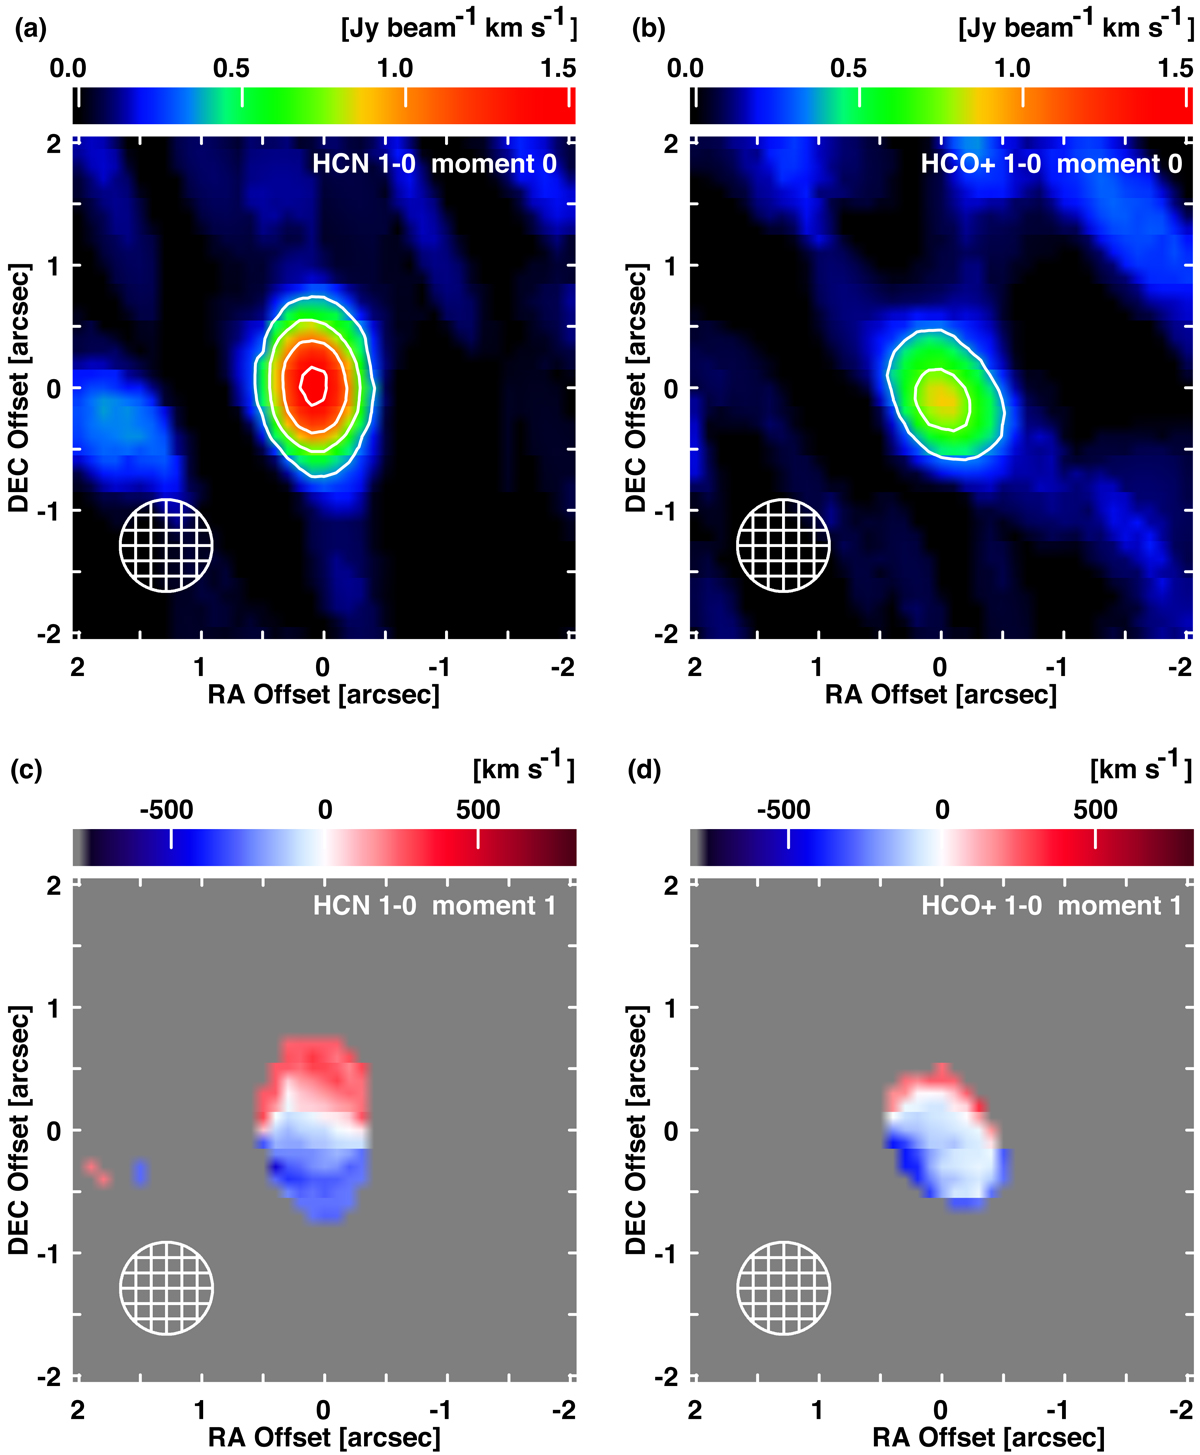
Fig. 3.
Download original image
Integrated intensity (moment-0) maps of (a) HCN J = 1–0 and (b) HCO+J = 1–0 lines towards the central ±2″. Both moment-0 images use the same colour scaling from 0 to 1.50 Jy beam−1 km s−1 and the same contour levels in steps of 4σ, where σ = 8.8 × 10⁻² Jy beam−1 km s−1. The peak intensity is 1.50 and 0.87 Jy beam−1 km s−1 for HCN and HCO+, respectively. Intensity-weighted velocity (moment-1) maps of (c) HCN J=1–0 and (d) HCO+J = 1–0 lines towards the central ±2″, with the same color scaling from −800 to +800 km s−1 in relative velocity with respect to Vsys. All maps are restored with a circular Gaussian beam of ![]() , which is the typical minor-axis size of the synthesised beam. The position offsets are measured from RA(J2000) = 12h19m23.s220 and Dec(J2000) = 05°49′30
, which is the typical minor-axis size of the synthesised beam. The position offsets are measured from RA(J2000) = 12h19m23.s220 and Dec(J2000) = 05°49′30![]() 775.
775.
Current usage metrics show cumulative count of Article Views (full-text article views including HTML views, PDF and ePub downloads, according to the available data) and Abstracts Views on Vision4Press platform.
Data correspond to usage on the plateform after 2015. The current usage metrics is available 48-96 hours after online publication and is updated daily on week days.
Initial download of the metrics may take a while.