Fig. 2.
Download original image
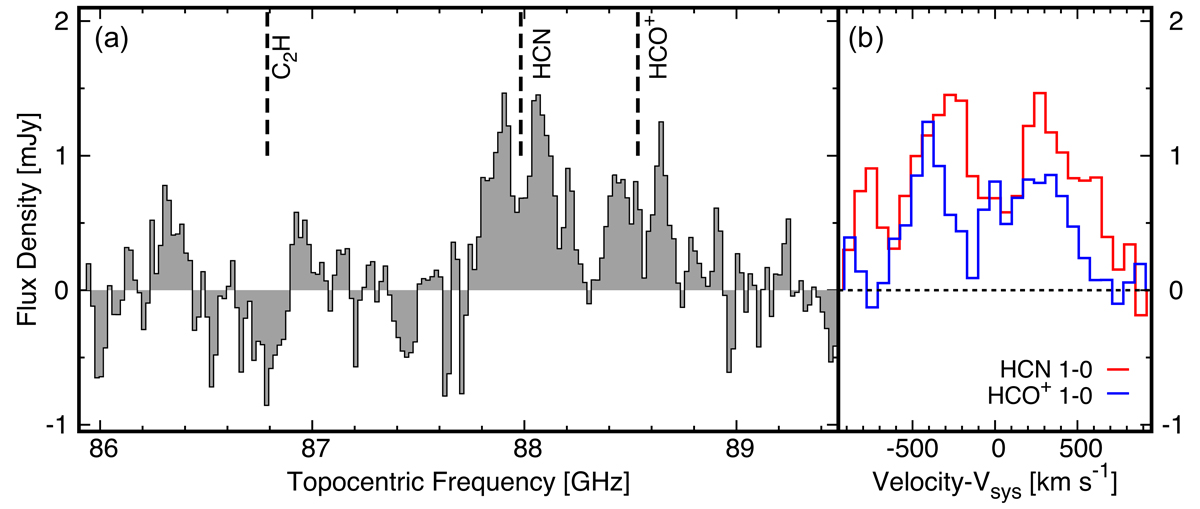
Integrated spectrum over the region within ±1″ of the core from 85.886 to 89.946 GHz, after subtracting continuum emission. The frequency resolution is 20 MHz, and the rms noise is 0.28 mJy. (a) Spectrum as functions of topocentric frequency in GHz. The vertical dashed lines represent Vsys for each molecular line. (b) Spectra of HCN J = 1–0 and HCO+J = 1–0 emission lines as functions of velocity with respect to Vsys.
Current usage metrics show cumulative count of Article Views (full-text article views including HTML views, PDF and ePub downloads, according to the available data) and Abstracts Views on Vision4Press platform.
Data correspond to usage on the plateform after 2015. The current usage metrics is available 48-96 hours after online publication and is updated daily on week days.
Initial download of the metrics may take a while.