Fig. 1.
Download original image
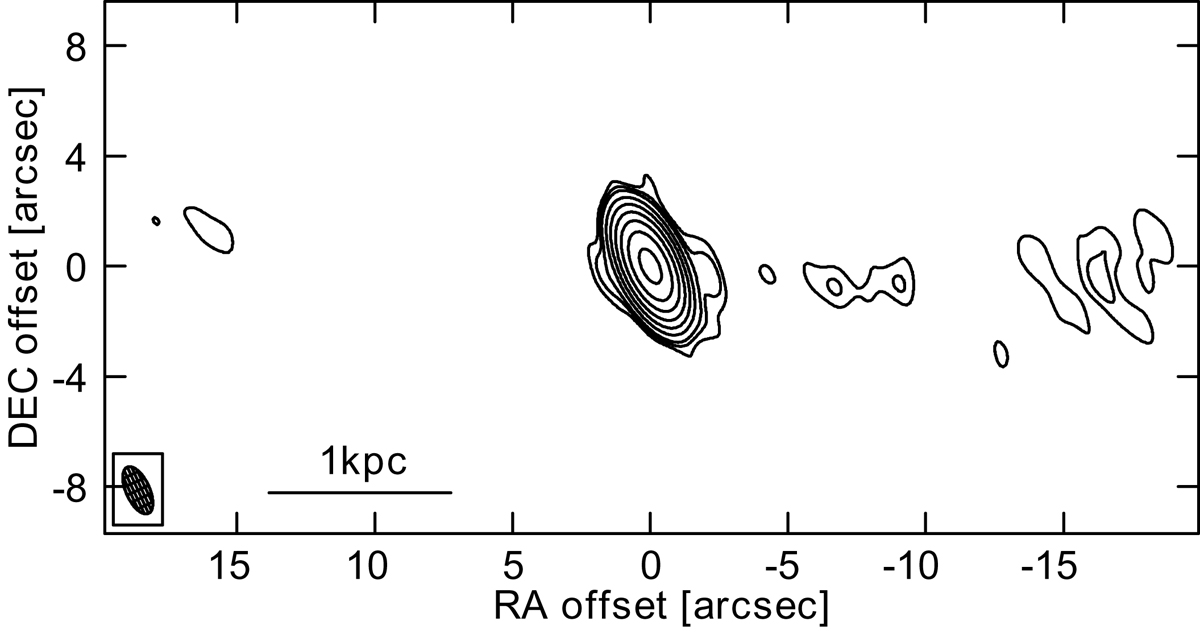
Continuum map of NGC 4261 at 80 GHz. Contours begin at the 3σ level and increase by factors of ![]() to 9σ and by factors of 3 thereafter, where σ = 3.8 × 10⁻² mJy beam−1. The position offsets are measured from RA(J2000) = 12h19m23.s220 and Dec(J2000) = 05°49′30
to 9σ and by factors of 3 thereafter, where σ = 3.8 × 10⁻² mJy beam−1. The position offsets are measured from RA(J2000) = 12h19m23.s220 and Dec(J2000) = 05°49′30![]() 775. The peak intensity, located at the centre, is 0.36 Jy beam−1. The synthesised beam is
775. The peak intensity, located at the centre, is 0.36 Jy beam−1. The synthesised beam is ![]() at a PA of 25°, as indicated by the cross-hatched ellipse in the bottom-left corner.
at a PA of 25°, as indicated by the cross-hatched ellipse in the bottom-left corner.
Current usage metrics show cumulative count of Article Views (full-text article views including HTML views, PDF and ePub downloads, according to the available data) and Abstracts Views on Vision4Press platform.
Data correspond to usage on the plateform after 2015. The current usage metrics is available 48-96 hours after online publication and is updated daily on week days.
Initial download of the metrics may take a while.