| Issue |
A&A
Volume 664, August 2022
|
|
|---|---|---|
| Article Number | A103 | |
| Number of page(s) | 13 | |
| Section | Stellar structure and evolution | |
| DOI | https://doi.org/10.1051/0004-6361/202243610 | |
| Published online | 10 August 2022 | |
Revisiting the high-mass transfer close binary star system AU Monocerotis
1
Institut für Astronomie und Astrophysik, Eberhard-Karls Universität Tübingen, Sand 1, 72076 Tübingen, Germany
e-mail: This email address is being protected from spambots. You need JavaScript enabled to view it.
2
Dipartimento di Fisica “Enrico Fermi”, Universitè di Pisa, Pisa, Italy
3
INFN – Sezione Pisa, largo B. Pontecorvo 3, 56127 Pisa, Italy
e-mail: This email address is being protected from spambots. You need JavaScript enabled to view it.
Received:
22
March
2022
Accepted:
16
May
2022
Abstract
Context. AU Monocerotis is an eclipsing, double-lined spectroscopic binary with a period of 11 days that is in a state of extreme mass transfer, consisting of a main sequence B-type embedded in a thick accretion disk fed by a Roche lobe overflowing evolved G-type companion. It is also one of the double periodic variable Algol-type binaries.
Aims. Our aim is to study the accretion environment and the origin of the long cycle in the system. We present revised properties of the gainer by including contributions from the accretion disk and its boundary layer, because the absorption lines used in previous works to estimate the parameters were contaminated by the disk absorption.
Methods. We performed a multiwavelength spectroscopic study using archival high-resolution IUE ultraviolet (1200–3200 Å) spectra and optical spectra (from about 3700–9000 Å) from FEROS, HARPS, and SOPHIE.
Results. Using the optical He I lines and the UV Si III, C II, Si IV lines, we derived new parameters for the temperature, gravity, and rotational velocity of the B star. The IUE spectra delineate a stratified environment around the gainer, with spectral lines such as O I, Mg II, Al II, and Si II formed in the outer accretion disk and a pseudo-photospheric boundary layer that alters the spectrum. Phase-limited discrete outflows, detected in the time-dependent absorption, trace the stream impact site and the disturbance it creates downstream in the disk. The long-term variability is due to changes in the accretion disk structure and circumstellar environment. Enhanced systemic mass outflow is observed at long cycle maximum, reaching at least 1000 km s−1.
Conclusions. These results highlight the complex interplay between physical mechanisms that regulate the evolution of strongly interacting mass-exchanging binary stars.
Key words: accretion, accretion disks / binaries: eclipsing / stars: mass-loss / techniques: spectroscopic / circumstellar matter
© A. Armeni and S. N. Shore 2022
 Open Access article, published by EDP Sciences, under the terms of the Creative Commons Attribution License (https://creativecommons.org/licenses/by/4.0), which permits unrestricted use, distribution, and reproduction in any medium, provided the original work is properly cited.
This article is published in open access under the Subscribe-to-Open model. This email address is being protected from spambots. You need JavaScript enabled to view it. to support open access publication.
1. Introduction
AU Monocerotis (=HD 50846) is an eclipsing, double-lined spectroscopic binary consisting of a more massive main sequence B-type star and an evolved G-type companion which has overfilled its Roche Lobe and is in the process of losing mass to the B star (hereafter, the gainer). With a mean V magnitude of 8.46 mag, its brightness drops to 9.15 mag with a period of about 11 days. It is classified as an eclipsing Algol system (EA) in the General Catalogue of Variable Stars (GCVS) (Samus et al. 2017). There is strong evidence for a substantial accretion disk around the gainer.
This system was selected as a CoRoT (Fridlund et al. 2006) target. Desmet et al. (2010) performed an analysis of AU Mon using ground-based spectroscopic observations taken simultaneously with the CoRoT photometric data. They determined a new ephemeris for the orbital and long timescale photometric modulations (see below). The accretion disk was not included in their analysis, leading to an incomplete determination of the properties of the two stars. Djuraević et al. (2010) modeled the light curve adding an accretion disk around the gainer. The disk was assumed to be optically thick, with a geometric thickness that increases linearly with radial distance. The Hα and Hβ profile variations were studied by Atwood-Stone et al. (2012). They included contributions from the two stars, the disk and the gas stream, modeling the environment in LTE and assuming an optically thick disk heated by viscous dissipation.
AU Mon was included among the Double Periodic Variables (DPV) from Mennickent et al. (2003). These systems show a long-term cycle (also called here the “long count”) whose origin is still under debate. Peters (1994) studied the long-term variation of the system in the ultraviolet and noted changes in the flux distribution between long cycle “faint” and “bright” states. This variability was attributed to a mass transfer rate modulated by pulsation of the secondary that produces an optically thick region around the B star, altering the B star’s effective temperature and contributing an additional continuum of Teff ∼ 12 000 K in the bright state. Desmet et al. (2010) argued that the two light curves at total light minimum and maximum are shifted by  in relation to each other but they otherwise have the same shape and amplitude. These authors proposed that the photometric variations are linked to changes in the attenuation by circumbinary material. Celedón et al. (2020) produced Hα Doppler maps in the two states of the long cycle, finding enhanced emission in the first orbital quadrant during the faint state.
Mennickent (2014) simulated AU Mon using conservative and non-conservative evolutionary sequences for binary systems. According to the models, the system should currently be in a stage of conservative mass transfer with Ṁ2 = −7.6 × 10⁻⁶ M⊙ yr−1. However, the derived rate of mass transfer implies Ṗ = 15 s yr−1 in the conservative case, which is not observed in the O-C diagram of AU Mon1 (Kreiner 2004). This has been interpreted as evidence of non-conservative evolution in which mass and angular momentum are lost from the system.
In light of these uncertainties and the importance of AU Mon as an exemplar of the stage of extreme mass transfer in a close binary system, our aim in re-evaluating the observations is to better understand its mass transfer process and physical properties.
Richards & Albright (1999) showed that the location of the binary in the r − q diagram (r = radius of the gainer in units of the separation of the binary, q = mass ratio) is between the two curves ωd and ωmin derived by Lubow & Shu (1975) with an analytical ballistic treatment. The first one represents the radius of a stable accretion disk for different mass ratios, while the second is the distance of closest approach of the gas stream from the center of the gainer. From this diagnostic, an accretion disk can develop in this system (Peters et al. 2021). The impact of the gas stream on the accretion disk produces an hot spot. Figure 1 displays the main regions of the system that have a spectrophotometric signature. Besides the two stellar photospheres studied by Desmet et al. (2010), there is evidence for an accretion disk around the gainer from both the spectroscopy (Atwood-Stone et al. 2012) and photometry (Djuraević et al., 2010). The gas stream was detected as redshifted absorption in the Hα and Hβ profiles by Atwood-Stone et al. (2012) and in the low ionization species (Si II, S II, C II, Al II, and Mg II) by Peters (1994). Peters & Polidan (1984) proposed the existence of an impact region to explain the presence of absorption in the ultraviolet N V doublet.
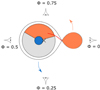 |
Fig. 1. Schematic representation of the canonical model for AU Mon. The cross indicates the center of mass. The red line is the stream, while the orange region is the impact site in the accretion disk. |
2. Observations
Our spectroscopic analysis is based exclusively on public archival data. The 43 optical spectra are a collection of data obtained contemporaneously with the CoRoT observations, in the framework of the CoRoT follow-up program (Uytterhoeven et al. 2008), augmented by spectra taken at different times: 20 FEROS (FE) (Kaufer et al. 1999) echelle spectra, with 16 of them taken from the CoRoT follow-up program; 13 SOPHIE (SO) (Perruchot et al. 2008) spectra, from the CoRoT follow-up program; 10 HARPS (HA) (Pepe et al. 2000), not part of the follow-up program. The optical spectra are supplemented with a set of 42 IUE (Boggess et al. 1978) ultraviolet high resolution (R ∼ 10 000) echelle spectra, of which 36 are SWP (Short Wavelength Prime camera), covering 1150–1930 Å, and the rest are LWP (Long Wavelength Prime camera) mode, covering 1900–3150 Å. The optical spectra were normalized using RASSINE (Cretignier et al. 2020). The IUE data were instead calibrated in absolute flux.
The spectra were phased using the orbital ephemeris in Desmet et al. (2010), shifting the MJD of the minimum light by 1030 periods, so that all the epochs are positive, and the long cycle ephemeris given in the same paper, namely,
 (1)
(1)
The observations are listed in Appendix A, ordered in MJD, with the orbital phases shown as ϕ = epoch.phase along with the long phases ϕL. In the discussion, we use the epoch.phase notation to uniquely identify the observations and to emphasize their temporal distance. Otherwise, the 0 ≤ ϕ < 1 notation is used. We divide the long cycle between faint (0.25 < ϕL < 0.75) and bright (0.75 < ϕL < 1.25) state. Extensive tables and figures are reported in Armeni (2021, MS thesis)2.
3. Data analysis
Table 1 summarizes the species analyzed in this work, with their possible region of formation and the orbital or long term variability (or both).
Summary of all the species analyzed in this work, with their region of formation and variability.
3.1. Photosphere and optically thick circumstellar environment of the gainer
Most of the radiation emitted from the binary is from the B star and its environment. Broad absorption lines in the spectrum are from the photosphere of the gainer. The main optical lines are the Balmer series and the He I transitions, those in the UV are from multiply ionized metals such as Si III, C II, or Si IV. Desmet et al. (2010) obtained an effective temperature of 15 000 ± 2000 K and a gravity log(g) = 3.5 ± 0.3 (cgs) for the B star by fitting the spectrum in the 4000–4200 Å region, encompassing Hδ and He I 4121 and 4144 Å. They used the CoRoT follow up spectra, which are in the faint state of the long cycle (ϕL ≈ 0.4), and the accretion disk was not included in their analysis. However, the temperature profile obtained by Djuraević et al. (2010) shows that the disk presents intermediate conditions between the donor and the gainer. Therefore, we can be certain that the disk contributes to the Balmer lines.
For the He I lines, Fig. 2 shows that the weaker 4026 and 4471 lines do not vary during the long cycle. Then, He I 5876 and 6678 appear to change, but variations in the continuous spectrum are visible in both regions. The continuum around He I 6678 is steeper in the bright state, while the absorption in the Na I D lines is enhanced in the faint state. Therefore, the line variations are likely due to the changing continuum. This is very important, because it suggests that the region in which the He I lines are formed is stable, as we would expect for the photosphere of the gainer. Conversely, the Balmer lines vary with the long cycle and are subject to additional contributions from the disk, which we discuss in Sect. 3.6.
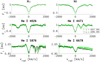 |
Fig. 2. Balmer and He I lines variability with the long cycle. The green spectrum is at ϕ = 1027.392, ϕL = 0.391, while the black one is at ϕ = 1090.395, ϕL = 0.07. The line blueward of He I 4026 is He I 4009, while the one redward of He I 4471 is Mg II 4481. The spectra in the first four panels are continuum-normalized, while the He I 5876 and 6678 were normalized with the continuum level at −1500 km s−1. The units on the y-axes are arbitrary units of flux. |
We computed a synthetic spectrum of the system by using two different spectral libraries for the components. The B star spectra used the BSTAR2006 Grid (Lanz & Hubeny 2007) of metal line-blanketed, NLTE, plane-parallel, hydrostatic models in the ranges between 15 000 K < Teff < 30 000 K and 1.75 < log(g) < 4.75 (cgs). For the G star spectra, the PHOENIX Stellar Atmospheres Library (Husser et al. 2013) was used. The spectra were convolved with a rotational kernel. The occultation of the B star by the accretion disk and the companion was performed using the parameters determined by Djuraević et al. (2010). Solar aboundances were used. To reduce the degrees of freedom of the problem, we used the G star parameters from Desmet et al. (2010):
 (2)
(2)
The He I lines are reproduced with models having Teff = 21 000 ± 1000 K, log(g) = 4.00 ± 0.25 (cgs), vrot sin i = 225 ± 25 km s−1 for the B star. Figure 3 shows the model with Teff = 21 000 K, log(g) = 4.00 (cgs) and vrot sin i = 225 km s−1 for the Hγ, Hδ, He I 4026 and 4471 lines. Compared with bright state spectra, the model’s agreement with Balmer lines is improved. There is residual emission in the wings of the transitions that is ascribable to the accretion disk. The model was checked at different orbital phases, with the various lines still being well reproduced. The main He I lines appear to be formed in an optically thick region which is hotter and more rapidly rotating than previously derived.
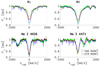 |
Fig. 3. New (red line) and Desmet et al. (2010; blue line) model for the Hγ, Hδ, He I 4026, and 4471 lines. The green and black spectra are the same as in Fig. 2. |
The parameters of the B star were supported by the analysis of the UV features. Figure 4 shows the contrast between the two models in reproducing some lines in the far UV spectrum. The main photospheric transitions of the B star are Si III 1295, 1297, 1299, C II 1335, 1336, and Si IV 1394, 1403. The Desmet et al. (2010) model produces lines that are systematically too deep in the case of the Si III and C II and weaker than the observations for the Si IV.
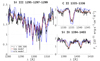 |
Fig. 4. Selected lines in the far UV spectrum of AU Mon. The black spectrum is IUE SWP03758 (Table A.2), which is in the bright state of the long cycle. |
3.2. Absorption lines from the accretion disk
The UV spectrum indicates a strong temperature stratification. When the system is in the faint state, the IUE spectra show typical shell features: lower ionization species, such as Si II, Al II, and Mg II, that trace the disk’s absorption. Here, the term “shell” refers to the presence of lines originating in the outer part of the disk superposed to the spectrum of the gainer. A similar scenario was proposed by Harmanec (1992) to explain the presence of the Si II doublet in absorption in β Lyrae. In the UV, the disk is passive: it acts like a “curtain” (Shore 1992) that is absorbing against the B star. The opacity is determined by whatever locally sets the level population, but there is no strong coupling that would lead to the radiation changing the population. The IUE data have a good long cycle coverage and permit a study of the disk variability on this timescale. The main transitions from the disk are listed in Table 2. All resonance transitions, or those collisionally coupled to the ground state with energies within a few eV, have contributions from the accretion disk.
Disk resonance and meta-stable transitions in the UV.
The two models are compared with selected lines in Fig. 5. The lines of the cooler species are not photospheric. The comparison shows that we cannot fit the UV spectrum with a single stellar atmosphere model.
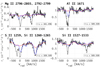 |
Fig. 5. Comparison between model and observations for selected accretion disk lines. |
There are also optical absorption lines from the disk. A list of these transitions is provided in Table 3. Figure 6 shows some of the lines at ϕ = 0.188, selected to display the contributions of the G star in the Fe II transitions. The comparison with the model shows again that the lines are formed in the accretion disk. The conditions probed by these ions are similar: Mg II, Si II, and Fe II are all formed between ∼8 and 16 eV. The lower states of these transitions have different energies: about 8–9 eV for Mg II, Si II, and O I, ∼3 eV for the Fe II. Most of these lines are connected to the resonance transitions in the UV that populate the lower level of the optical transitions, for example Mg II 2796, 2803 (h & k) → Mg II 2792, 2799 (known as satellite lines) → Mg II 4481; Si II 1260, 1265 → Si II 4128, 4130; Si II 1527, and 1533 → Si II 6347, 6371. Conversely, the UV Fe II resonance lines populate the upper level of the optical transitions: Fe II 2344 → Fe II 5169 and Fe II 2260 → Fe II 5317. The first set of optical lines is so strong because their lower levels couple to the disk absorption in the resonance lines. For example, the lower state of the Si II 4128, 4130 doublet has Ei = 9.84 eV and is populated by the absorption in the UV resonance lines, so the upper levels can reach collisional balance. The Fe II, on the other hand, can be collisionally excited in the disk. This is why we see the optical lines in absorption even though the UV resonance lines populate the upper levels.
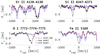 |
Fig. 6. Four panels plot showing the optical lines linked to the accretion disk. The gray line, where present, marks the position of the second line of the doublets. The green line in the last panel marks the radial velocity of the G star. The spectra are at ϕ = 0.188, ϕL = 0.439, median filtered to three points. The lines in the plot of the Si II 4128, 4130 doublet are He I 4121, and 4144. |
Transitions linked to the gainer’s environment in the optical.
3.3. Non-axisymmetric structures in the disk: the stream and the hot spot
The orbital variation of the Al II 1671 line in the interval 0.25 < ϕ < 0.75 is shown in Fig. 7 and suggests that the line traces a non-axisymmetric structure. Atwood-Stone et al. (2012) suggested the presence of non-axisymmetric structures located in the trailing side of the disk based on the Hα and Hβ lines. However, the Balmer lines have contributions from many different regions in the environment of the gainer, so it is difficult to disentangle their components. We can gain insight into the disk asymmetries by looking at other transitions. For instance, the disk contributions are weaker in the He I lines.
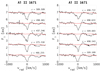 |
Fig. 7. Orbital variation for the Al II 1671 in the interval 0.25 < ϕ < 0.75 in IUE spectra. The red line is the new model. The spectra were normalized by using the flux level at −1000 km s−1. |
Figure 8 shows He I 5876 and 6678 in the fourth orbital quadrant (ϕ > 0.75). Relative to the black reference profile at ϕ = 0.498, there is additional absorption in the red side of both lines in the radial velocity range from ∼ − 50 km s−1 to ∼ + 400 km s−1. This is compatible with the stream absorbing against the B star. There is an observational gap at ϕ > 0.75 in the CoRoT follow-up spectra. Most of the observations are from HARPS and distributed in the long cycle, so we do not know whether the profile variability is due to orbital motion or is also correlated with the long cycle.
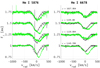 |
Fig. 8. He I 5876 and 6678 after ϕ = 0.75. The black reference profile (at ϕ = 0.498) is in fact a secondary eclipse profile. The spectra were shifted in the frame of the B star. |
Sahade & Ferrer (1982) and Peters & Polidan (1984) reported the presence of the C IV, N V, Al III and Si IV resonance doublets in the UV spectrum. Peters & Polidan (1984) pointed out that the photosphere of the gainer is too cool to form such ions. Still, Fig. 9 shows that a temperature of 22 000 K reproduces the Si IV 1394 and 1403, with the Al III 1855 and 1863 having additional contribution from circumstellar material. The N V doublet at 1239 and 1243 Å, rather, cannot originate in the photosphere of the gainer.
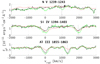 |
Fig. 9. Contrast between two IUE spectra at epoch 498 for the N V, Si IV, and Al III doublets. The black spectrum is at ϕ = 0.364, the green one at ϕ = 0.633. The red line is the new model. |
Figure 10 shows a sequence of observations at epoch 498, which is in the faint state of the long cycle. The N V is weak but still present in the second orbital quadrant (ϕ = 0.364 and ϕ = 0.461), while it is stronger in the third and fourth quadrant. Figure 9 shows how the Si IV and Al III doublets vary in the same way as the N V. After a secondary eclipse, there is extra absorption between −200 and +200 km s−1 that appears to be produced by a structure located on the trailing side of the accretion disk. The region is extended. It is observed as early as ϕ = 0.543, is not present in the first two orbital quadrants and is compatible with the locale where the stream impacts the accretion disk, as proposed by Peters & Polidan (1984).
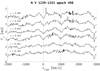 |
Fig. 10. IUE spectra of the N V doublet at epoch 498, with ϕL ≈ 0.29 − 0.3. The spectra were normalized by using the flux level at −1600 km s−1. Each spectra is shifted by a constant. |
3.4. Mass loss
Figure 11 compares the spectra at similar orbital but different long-count phases. Excess blueshifted absorption is visible in the bright state profiles, especially at ϕ = 0.277. The red wing at ϕ = 0.218 differs from the other spectra. The Al III doublet mimics the Si IV.
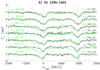 |
Fig. 11. Comparison between bright (green) and faint state (black) for the Si IV doublet profiles (IUE spectra). The spectra were normalized by using the flux level at −1800 km s−1. Each spectra is shifted by a constant. |
Figure 12 compares the model and the observations for the Si IV and Al III doublets at ϕ = 0.218. The subtracted spectrum highlights the presence of a P Cygni profile superposed on the photospheric absorption. The zero point of the P Cygni is at ∼ + 100 km s−1 for both doublets. The absorption trough reaches −800 km s−1 for the Si IV and −300 km s−1 for the Al III.
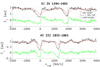 |
Fig. 12. P Cygni profile seen in the Si IV and Al III doublet near second quadrature (IUE spectra). |
Figure 13 compares the Si IV doublet in the bright state with the model for the photosphere. We can trace the motion of the additional spectral component in the Si IV. Near the second quadrature (ϕ = 0.218 and ϕ = 0.277), the excess is on the blue side of the profile. At ϕ = 0.467 and ϕ = 0.509 the additional component is weak and it is present again at ϕ = 0.556. At ϕ = 0.652, the higher velocity part of the flow appears to be eclipsed, with the absorption trough reaching only −400 km s−1. It appears to be eclipsed, or shifted to the red, at ϕ = 0.928. There is no indication of blueshifted excess absorption in the faint state spectra.
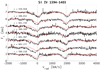 |
Fig. 13. Model comparison with the Si IV doublet in the bright state of the long cycle (IUE spectra). The spectra were normalized by using the flux level at −1800 km s−1. Each spectra is shifted by a constant. |
Besides the presence of systemic mass loss in the bright state, there is evidence of sporadic mass loss that is not related to the long cycle. Figure 14 shows two spectra from the same epoch (509) in the Si II 1265, Si IV 1394, Al II 1671, and Al III 1855. At ϕ = 0.869 a deep absorption appears at ∼ − 220 km s−1 in these four lines. This transient UV feature was also analyzed by Atwood-Stone et al. (2012), who showed that it could be reproduced by “an occasional outflow arising in the vicinity of the disk-stream interaction site”. Besides epoch 509, there are three other spectra that show this feature in the Si IV, but not in the other ions (see Fig. 15). The absorption components are centered around different velocities.
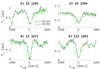 |
Fig. 14. Si IV and Al III doublets together with Si II 1265 and Al II 1671 in two IUE spectra at epoch 509. The black spectrum is at ϕ = 0.603, the red at ϕ = 0.869. |
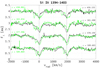 |
Fig. 15. Blueshifted events (green) observed in the Si IV doublet, compared with spectra before or after (black). The spectra were normalized by using the flux level at −1800 km s−1. |
The presence of the Al II argues against an ejection from the gainer, in which the dominant ionization stage for the aluminum is Al2+, and suggest that at least the ejection at epoch 509 is launched from the disk. These discrete absorption components (DACs) are attributed to material along the line of sight to the B star. The projected velocities are lower than the outflow’s terminal velocity seen in the Si IV absorption troughs, which is ∼1000 km s−1. The velocities are not compatible with flows within the disk. The narrowness of the features suggest that the structure is a blob of material ejected from the disk with no internal velocity gradient.
The spectra from before and after the events isolate the DACs for the Si IV doublet at epoch 509. The isolation procedure consists of dividing the DAC spectrum by the other one. The doublets equivalent width (EW) ratio for the blueshifted components can be compared with the ratio of the f-values for the two species, which is 2.01 for both the Si IV and Al III doublets. If the lines are optically thin, the EW ratio is equal to f1/f2. The absorption minimum gives a covering fraction C0 ≳ 0.5 of the B star surface for the event at ϕ = 0.869. The same is observed in the other features. We can estimate the covering fraction C0 and the optical depth at line center τ0 of the blobs using the normalized flux level at lines minima, as explained in Hall et al. (2003). The EW of the blueshifted components, together with the covering factor and the optical depth at line center, are provided in Table 4. The results for the EW ratios suggest that most of the events are not optically thin. The derived τ0 are not well constrained because of the uncertainties on the minima (∼10%), but they are in agreement with optical depths of order 1 − 2. The mean covering factor is C0 ≈ 0.8.
Properties of the DACs.
The features appear to be transient, because they are observed only in these particular spectra at orbital phases 0.8 < ϕ < 0.9 and not in the others in the same orbit. In the sequence at epoch 509, the spectrum at ϕ = 0.603 is about three days before the one at ϕ = 0.869. After the two spectra at ϕ = 458.882 and ϕ = 477.906, we have two spectra at ϕ = 459.335 and ϕ = 478.194 which show no indications of these ejections. The blobs are launched from a region in the accretion disk which is projected against the B star only in the interval 0.8 < ϕ < 0.9.
3.5. He I variability
Figure 16 shows a collection of bright state He I 5876 profiles at epoch 1090. A blueshifted emission component is visible. Since the Hα double-peaked emission is at ∼ ± 250 km s−1 (Atwood-Stone et al. 2012), the radial velocity of the peak is substantially higher than the typical velocities in the accretion disk.
 |
Fig. 16. He I 5876 profiles at cycle 1090, ϕL = 0.07. The spectra were normalized using the flux level at −1500 km s−1. The dashed line signals the peaks at −350 km s−1. |
If the He I peak traces a region in the orbital plane, it must be a more interior region relative to where the bulk of the Hα emission is formed. Since the red peak is suppressed, the structure is not axisymmetric. Figure 17 displays three primary eclipse spectra for He I 5876, 6678. The comparison with the model highlights the presence of an asymmetric double peaked structure, with the blue peak at ∼ − 250 km s−1 and the red one at ∼ + 370 km s−1. Interestingly, the red emission features have the same absolute radial velocity as the blue ones shown in Fig. 16. If these two emission components are connected, the eclipse spectra argues against the formation in the inner part of the accretion disk, which is eclipsed by the companion at these phases. The emission could originate above the orbital plane or in the portion of the disk that is moving away from us and is not occulted at primary eclipse. There is also excess absorption in eclipse spectra, more visible in He I 5876, relative to the synthetic profile. This is an argument supporting the presence of an outflow from the unocculted portion of the disk.
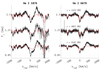 |
Fig. 17. He I 5876 and 6678 during primary eclipse, compared with the new model. |
3.6. Long-count variability
Peters (1994) discussed the spectrophotometric variations between long cycle minimum and maximum. The flux ratio is displayed in the inset of Fig. 18. In the 1200–2000 Å region the flux at bright state is enhanced by 20%, while at 2000–3200 Å the flux increases by ∼40%. Peters interpreted the additional component as an increase of the B star’s photospheric temperature by about 1200 K, starting from ∼17 000 K at faint state, and the development of a ∼12 000 K plasma in the system at the bright state.
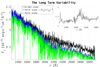 |
Fig. 18. Flux difference between bright and faint states. The faint state spectrum is the union of the IUE SWP spectrum at ϕ = 509.509 and the LWP one at ϕ = 161.496, while the bright state spectrum is the union of ϕ = 106.509 (SWP) and ϕ = 106.506 (LWP). In the blue line, a scattering component in the form of Eq. (3) was added to the faint state spectra, with λ0 = 2000 Å, F0 the flux level at λ0 and C = 0.13 to match the bright state continuum (see Sect. 4.2). The spectra were smoothed with a 15 points median filter to remove the noise. The inset shows the flux ratio between the two states, binned to 10 Å. |
Aside from the continuum variations, however, there are absorption lines which are stronger in the faint state. The main resonance lines are shown in Fig. 19. There are also transitions arising from excited states, such as Mg II 2792, 2799, along with several Fe III lines to the red of Al III, including the multiplet UV34 at 1895, 1914, 1926 Å, and second and third spectrum lines from metallic species, such as V, Cr, Mn, and Fe, in the 2100–2300 Å region (shown in Fig. 20). The flux increase at bright state in the 2100–2300 Å region (Fig. 18) is due to curtain line absorption in the LWP spectra.
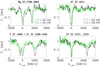 |
Fig. 19. Comparison between spectra at different long phases. The epoch 106 is at bright state (ϕL = 0.844), while the two spectra at ϕ = 509.509 (IUE SWP) and ϕ = 161.496 (LWP) are at faint state (ϕL = 0.587 and ϕL = 0.31). The spectra in the two lower panels are the same as the Al II ones. |
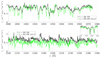 |
Fig. 20. Absorption lines from metallic ions. The inset shows the Mg II satellite lines. The spectra were smoothed with a five point boxcar filter. |
The resonance lines probe column density changes and they can also be compared across different ionization stages. Figure 21 shows Al II 1671 vs. Al III 1855 and Si II 1527 vs. Si IV 1394 for two pairs of spectra at bright and faint state. The only available resonance line for Si III, at 1207 Å, is in the wing of the Lyα and cannot be used. At long cycle minimum, the profiles of the two ionization stages are compatible, suggesting a common origin. At long cycle maximum, the full width at half maximum (FWHM) of the Si II and Al II lines is reduced, and there is excess absorption in the blue wing of Al III and Si IV.
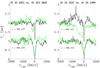 |
Fig. 21. Al II 1671 vs. Al III 1855 and Si II 1527 vs. Si IV 1394, compared at bright (upper profiles) and faint (lower profiles) state (IUE spectra). The black profiles are the Al II and Si II lines. The spectra were median-filtered to three points and normalized with the continuum level at −1800 km s−1. |
Figure 22 shows some of the optical lines lines which vary with the long phase. They are more optically thin in the bright state. The Mg II 4481 appears to be in emission.
 |
Fig. 22. Selected optical lines which vary in the long cycle. Since the continuum is rapidly varying, the lines were normalized with the continuum level at −1500, −1000, −1000, −600 km s−1 respectively. |
4. Discussion
The analysis of the AU Mon spectrum highlights its complexity since it is produced by many contributing processes and sites. It is thus essential to employ as many spectral transitions as possible to disentangle the different regions of the system.
4.1. New picture of the system
The spectrum of the gainer indicates the temperature stratification. Some of the optical absorption lines, such as Balmer lines and Mg II 4481, are not completely photospheric but have an additional contribution from the circumstellar material which is enhanced in the faint state of the long cycle. The UV resonance lines come mainly from the accretion disk. The He I lines show that the B star is hotter and more rapidly rotating than previously derived, consistent with the expected appearance of a boundary layer (BL). The IUE SWP spectra support the model and reveal a stratified environment around the accretor: Al II, Si II, and Mg II are formed in the disk and not in the photosphere.
The gainer turns out to be a B2V-B3V type star, rather than a B5V as previously adopted. Based on the period of the system and photometrically derived radii (Djuraević et al., 2010), the G star is synchronous, which is consistent with its contact with the Roche lobe, but the B star is much more rapidly rotating. Its radius from the CoRoT solution would require a synchronous velocity of ∼23 km s−1, while the observed is an order of magnitude higher. The entire star may be spun up, and while we cannot determine that directly, a plausible explanation is that the optically thick surface is a pseudo-photospheric boundary layer. Our B star parameters differ from other estimates, such as the light curve solution by Djuraević et al. (2010), the spectrophotometric analysis by Desmet et al. (2010), and the study of the rotational velocities of the two components by Glazunova et al. (2008). Glazunova et al. did not include the disk contribution in their analysis, whereas we now know that the Si II 4128, 4130 doublet is formed in the disk. For the He I 4471 and Mg II 4481 line forming region, we discussed how the Mg II can have contributions from the disk due to an absorption ladder in the resonance doublet at 2795, 2802 Å and the satellite lines at 2790, 2798 Å. The Glazunova et al. (2008) model with Teff = 15 000 K, log(g) = 3.5 (cgs) and vrot sin i = 124 ± 4 km s−1 can be regarded as a best fit to the disk + B star photosphere spectrum in the faint state. Desmet et al. (2010) obtained a result of Teff = 15 000 ± 2000 K, log(g) = 3.5 ± 0.3 (cgs) and vrot sin i = 116 ± 2 km s−1 for the B star by fitting Hδ and He I 4121 using the CoRoT follow-up program spectra, which are in the faint state of the long cycle. We showed that the Balmer lines are not good indicators of the B star’s optically thick surface. They have an extra contribution from the accretion disk which changes with the long cycle.
It must be stressed that the comparison between the observations and the model is still phenomenological. The scope is meant to show that more than one region contributes to the spectrum – it is not possible to fit the spectrum with a single stellar atmosphere model – and to find transitions that probe the photosphere of the B star. The best fits realized with a minimization of the residuals were not the purpose of this work and these can be done in the future with dedicated programs.
The resonance lines of Mg II, Al II, Si II, and S II probe the outer part of the accretion disk. These transitions trace a region whose inner boundary is ∼8 − 10 R⊙ from the center of the B star (see Appendix B). If the optically thin material actually extends up to ∼23 R⊙ from the gainer, as suggested by the Hα profile and derived by Atwood-Stone et al. (2012), the disk cannot be axysimmetric because of the gravitational interaction with the companion. Since the orbit is almost circular, the result is a tidal distortion along the line of centers. This can generate spiral shocks in the disk. The orbital variability of the lines supports this phenomenology. Sahade & Ferrer (1982) proposed that the UV resonance lines mentioned above are formed in an outer envelope around the system because they were narrow and deep in their observations, as shown in their Fig. 8. However, their spectra were taken at the bright state (see SWP03757, SWP03775, and LWR03336 in Table A.2). We discuss how the absorption in the same lines is, instead, very broad at the faint state. The half width at half maximum (HWHM) for Al II 1671 is ∼200 km s−1, for example. The minimum distance of a circumbinary envelope from the gainer would be a2 = a ⋅ M1/(M1 + M2)∼36 R⊙. Given the inclination of the system, the envelope cannot absorb against the B star. The absorption must come from a structure located around the gainer.
The He I redshifted absorption in the fourth orbital quadrant is another indication of non-axisymmetric structures in the accretion disk. The velocity limits are compatible to those obtained by Atwood-Stone et al. (2012) for the stream. The local conditions appear to be different. Their predicted temperature was set to the peak emissivity of the Hα, but we see absorption in the He I that suggests that the local temperature of the stream is higher.
The orbital variability of the N V doublet suggests the presence of an highly ionized region in the trailing side of the accretion disk. This region is quite extended, as seen in absorption against the B star from ϕ ≈ 0.55 to primary eclipse. The region is also observed as enhanced absorption superposed to the photospheric component in the Si IV and Al III doublets.
The Si IV doublet traces the mass loss from the system. The excess blueshifted absorption appears to be enhanced in the bright state of the long cycle. The P Cygni absorption troughs are variable in the IUE archival data. If this variation is due to the orbital motion, it could indicate that the mass is lost from a particular region of the accretion disk which is occulted by the two stars or self-occulted. The variability argues against a spherically symmetric wind from the B star but we cannot tell from the existing data sets whether the changes are also secular since the spectra are taken at different epochs.
The ejection events are clearly related to another mechanism of mass loss, different from the one discussed above. The DACs are likely produced by blobs of material ejected from the accretion disk.
The fact that in the spectrum at ϕ = 0.882 the line is strongest at its highest displacement argues for something that is propagating outward. What we observe could be an “accelerating flow”.
We cannot discern whether these DACs are due to material in the plane or off of the disk plane. The blobs could be ejected in a narrow jet-like flow, whose absorption against the B star would depend on the orientation toward the observer. The region that produces the DACs is linked to the accretion process, but it is less extended than the high temperature region observed in N V. It may be connected to the He I redshifted absorption that appears in the same orbital range. The site where the stream impacts the disk must drive mass loss (van Rensbergen et al. 2008), both within the plane and, through heating, off the plane. The evidence from the DACs is that this is intermittent. The observation of mass loss is consistent with the hypothesis of nonconservative mass transfer, as proposed by Mennickent (2014) and Garrido et al. (2013). Part of the mass coming from the companion is not accreted by the gainer, but is instead lost from the system through wind, which also removes angular momentum. The He I 5876 and 6678 lines have contributions from other regions than the photosphere of the gainer, that is, either from an inner region of the accretion disk or a disk outflow.
4.2. Origin of the long cycle spectrophotometric variations
The analysis of the UV absorption lines indicates that the driver of the long cycle is the accretion disk, which changes its optical depth on this timescale. The scenario proposed by Peters (1994) to explain the long cycle is an increase in Ṁ near ϕL ∼ 0.5 that produces a geometrically thick disk around the gainer. Once the mass transfer rate is reduced, the disk collapses onto the plane producing an additional 12 000 K continuum and heating the B star’s photosphere, so the system is brighter. This picture was also adopted by Atwood-Stone et al. (2012) through an analysis of the EW variability of the Si II, Si IV, Al II, and Al III lines. However, it is more complex since an accretion disk does not collapse when supplied with less matter; it modifies its vertical structure to satisfy the hydrostatic balance.
We propose an alternative explanation for the long cycle in terms of variations in Ṁ. An increase in the rate of mass transfer would force the disk to readjust its vertical structure. Since the viscous energy generation rate per unit area is linear in the accretion rate (Frank et al. 2002), we expect the midplane temperature Tc to increase. For a vertically isothermal disk, the thickness is  , so the local scale height increases. This produces the column density enhancement observed in the disk absorption lines at faint state. The flux increase in the bright state is wavelength dependent and can be explained as an overall decrease in the opacity of the circumstellar material, that is observed in the lines but could also be in the continuum. Variations in the rate of mass transfer could be due to the Applegate’s mechanism as proposed by Schleicher & Mennickent (2017). If the circumstellar material becomes optically thin, the scattering component is enhanced. We show in Fig. 18 that the far UV flux distribution in the bright state can be explained as an additional Rayleigh scattering continuum that takes the following form:
 (3)
(3)
The scattering cannot explain either the near-UV flux enhacement or the optical one observed in the light curves. In our model, these variations are attributed to the decrease in the disk’s continuous opacity.
However, there is a subtle problem in this interpretation. An inevitable consequence of the accretion process is the formation of a strongly sheared region of the disk that is contiguous with the stellar surface, in which the circulation velocity is reduced to corotation (Shore & King 1986). This strongly dissipative boundary layer, if optically thick, would appear indistinguishable from a rapidly rotating photosphere. Since it is compact, with a thickness on the order of a pressure scale height (Weiland et al. 1995), it should not produce anomalies in the photometry in eclipse ingress and egress, but will be manifested in the broad photospheric absorption lines; for instance, He I. If it is structurally unchanged when Ṁ increases, the relative contribution of the gainer would increase as TBL ∼ Ṁ1/4 (Frank et al. 2002). However, if the layer expands, via internal heating, and also changes its viscosity, as might happen from a change in the turbulence and possible buoyancy effects, the BL will be more extended and may even be cooler when the disk is puffed up, namely, in the faint state of the long cycle.
Thus, an alternative explanation is suggested by the comparison between ionization stages of the silicon and aluminum. As already noticed by Atwood-Stone et al. (2012), the Si II and Al II EWs are anti-correlated with the Si IV and Al III ones in the long cycle. Their analysis, however, neglect the line variations in vrad. The EW of the higher ions increases in the bright state because of the blueshifted excess absorption. The fact that the lower ions are suppressed in the bright state might indicate that the disk is more optically thin because of changes in the ionization balance, and not because there is less material along the line of sight. We do not have any other direct information to determine whether this is a variation in the disk conditions or a physical change in the disk structure, or both.
5. Conclusions
AU Mon is an excellent astrophysical target for studying the complex interplay between physical mechanisms that regulate the evolution of interacting binary stars. However, important open issues are still under debate. While we may claim that the long-cycle variability is driven by the disk, the mechanism behind it is still uncertain. The spectroscopic and photometric variability of AU Mon requires a more extensive study and additional observational material. Since the CoRoT light curve was obtained at faint state, a detailed light curve at bright state is needed. In addition, long term dense monitoring of this system would be important to understand how quickly the transitions between the two stages occur. Color curves are equally important to ascertain the presence of scattering components. The other test would be spectropolarimetry. Regarding spectroscopy, a more detailed analysis of the He I lines behaviour would be useful. If the redshifted absorption seen in the fourth orbital quadrant were due to the stream, a study of its long term variability would help to understand whether variations in the rate of mass transfer occur in AU Mon, as already discussed by Peters (1994). In the UV, there are few observation in the near UV (1900–3100 Å). This region is important because the disk continuum dominates over the B star. In addition, we do not have any high-resolution data available at primary eclipse and in the interval 0 ≤ ϕ ≤ 0.2. The eclipse sequence is needed to reveal the presence of material out of the orbital plane, while in the first orbital quadrant spectra, we would be able to observe the occultation of the impact site by the companion.
The underlying B star is on the main sequence and it is not degenerate, unlike a cataclysmic binary. It has a relative shallow density profile and a perfect gas equation of state. Understanding how such a star accommodates a variation in the rate of angular momentum and mass transfer, as well as how the inner region of the disk maintains a turbulent3 coupling required4 to power the inflow5, remains essential. With its long observational history6, AU Mon is an exemplar for testing such simulations.
Acknowledgments
The authors acknowledge the use of the OHP, ESO and MAST public spectroscopic databases and the electronic bibliography maintained by the NASA/ADS system. SNS thanks Wolfgang Duschl, Petr Harmanec, Ivan Hubeny, Ron Polidan and Gerrie Peters for many valuable discussions over the years, and recalls the inspiration of Mirek Plavec.
References
- Atwood-Stone, C., Miller, B. P., Richards, M. T., Budaj, J., & Peters, G. J. 2012, ApJ, 760 [Google Scholar]
- Boggess, A., Carr, F., Evans, D., et al. 1978, Nature, 275, 372 [NASA ADS] [CrossRef] [Google Scholar]
- Celedón, L., Mennickent, R., Zharikov, S., et al. 2020, Contrib. Astron. Obs. Skalnate Pleso, 50, 486 [Google Scholar]
- Cretignier, M., Francfort, J., Dumusque, X., et al. 2020, A&A, 640, A42 [NASA ADS] [CrossRef] [EDP Sciences] [Google Scholar]
- Desmet, M., Frèmat, Y., Baudin, F., et al. 2010, MNRAS, 401, 418 [NASA ADS] [CrossRef] [Google Scholar]
- Djuraević, G., Latković, O., Vince, I., & Cséki, A. 2010, MNRAS, 409, 329 [CrossRef] [Google Scholar]
- Frank, J., King, A., & Raine, D. 2002, Accretion Power in Astrophysics (Cambrige: Cambrige University Press) [Google Scholar]
- Fridlund, M., Baglin, A., Lochard, J., & Conroy, L. 2006, in The CoRoT Mission Pre-Launch Status - Stellar Seismology and Planet Finding, ESA Spec. Publ., 1306 [Google Scholar]
- Garrido, H. E., Mennickent, R. E., Djuraević, G., et al. 2013, MNRAS, 428, 1594 [NASA ADS] [CrossRef] [Google Scholar]
- Glazunova, L. V., Yushchenko, A. V., Tsymbal, V. V., et al. 2008, AJ, 136, 1736 [NASA ADS] [CrossRef] [Google Scholar]
- Hall, P. B., Hutsemèkers, D., Anderson, S. F., et al. 2003, ApJ, 593, 189 [NASA ADS] [CrossRef] [Google Scholar]
- Harmanec, P. 1992, A&A, 266, 307 [NASA ADS] [Google Scholar]
- Husser, T. O., Wende-von Berg, S., Dreizler, S., et al. 2013, A&A, 553, A6 [NASA ADS] [CrossRef] [EDP Sciences] [Google Scholar]
- Kaufer, A., Stahl, O., Tubbesing, S., et al. 1999, The Messenger, 95, 8 [Google Scholar]
- Kreiner, J. M. 2004, Acta Astron, 54, 207 [NASA ADS] [Google Scholar]
- Lanz, T., & Hubeny, I. 2007, ApJS, 169, 83 [CrossRef] [Google Scholar]
- Lubow, S. H., & Shu, F. H. 1975, ApJ, 198, 383 [NASA ADS] [CrossRef] [Google Scholar]
- Mennickent, R. E. 2014, PASP, 126, 821 [NASA ADS] [CrossRef] [Google Scholar]
- Mennickent, R. E., Pietrzyński, G., Diaz, M., & Gieren, W. 2003, A&A, 399, L47 [NASA ADS] [CrossRef] [EDP Sciences] [Google Scholar]
- Pepe, F., Mayor, M., Benz, W., et al. 2000, in Optical and IR Telescope Instrumentation and Detectors, eds. M. Iye, & A. F. Moorwood, SPIE Conf. Ser., 4008, 582 [NASA ADS] [CrossRef] [Google Scholar]
- Perruchot, S., Kohler, D., Bouchy, F., et al. 2008, in Ground-based and Airborne Instrumentation for Astronomy II, eds. I. S. McLean, & M. M. Casali, SPIE Conf. Ser., 7014, 70140J [NASA ADS] [Google Scholar]
- Peters, G. J. 1994, in Interacting Binary Stars, ed. A. W. Shafter, ASP Conf. Ser., 56, 384 [NASA ADS] [Google Scholar]
- Peters, G. J., & Polidan, R. S. 1984, ApJ, 283, 745 [NASA ADS] [CrossRef] [Google Scholar]
- Peters, G. J., Gayley, K., Ignace, R., Jones, C. E., et al. 2021, ArXiv e-prints [arXiv:2111.14047] [Google Scholar]
- Richards, M. T., & Albright, G. E. 1999, ApJS, 123 [Google Scholar]
- Sahade, J., & Ferrer, O. E. 1982, PASP, 94, 113 [NASA ADS] [CrossRef] [Google Scholar]
- Samus, N. N., Kazarovets, E. V., Durlevich, O. V., Kireeva, N. N., & Pastukhova, E. N. 2017, Astron. Rep., 61, 80 [Google Scholar]
- Schleicher, D. R. G., & Mennickent, R. E. 2017, A&A, 602, A109 [NASA ADS] [CrossRef] [EDP Sciences] [Google Scholar]
- Shore, S. N. 1992, in Nonisotropic and Variable Outflows from Stars, eds. L. Drissen, C. Leitherer, & A. Nota, ASP Conf. Ser., 22, 342 [NASA ADS] [Google Scholar]
- Shore, S., & King, A. 1986, A&A, 154, 263 [NASA ADS] [Google Scholar]
- Uytterhoeven, K., Poretti, E., Rainer, M., et al. 2008, J. Phys.: Conf. Ser., 118 [Google Scholar]
- van Rensbergen, W., De Greve, J. P., De Loore, C., & Mennekens, N. 2008, A&A, 487, 1129 [NASA ADS] [CrossRef] [EDP Sciences] [Google Scholar]
- Weiland, J. L., Shore, S. N., Beaver, E. A., Lyons, R. W., & Rosenblatt, E. I. 1995, ApJ, 447, 401 [NASA ADS] [CrossRef] [Google Scholar]
Appendix A: Journal of observations
Tables A.1 and A.2 show the optical and ultraviolet observations. The FEROS and HARPS spectra were downloaded from the ESO Science Archive Facility, while the SOPHIE spectra from the Observatoire de Haute-Provence data archive. The IUE data were downloaded from the MAST IUE website.
Optical observations. The wavelength coverage of the spectrographs are 3500-9200 Å(FEROS), 3872-6943 Å(SOPHIE), 3780-6910 Å(HARPS). The resolution are R ∼ 48000, R ∼ 70000, R ∼ 120000 respectively.
UV observations.
Appendix B: Isovelocity contours for a Keplerian disk
Let (x, y, z) be a Cartesian system for the disk, with x being toward the Earth; θ is the azimuth relative to the observer. In the Keplerian disk approximation, the radial velocity field for the circumstellar material is:
 (B.1)
(B.1)
Figure B.1 shows the radial velocity contours for a Keplerian disk around the B star in AU Mon. The mass of the B star is 5.1 M⊙ (Djuraević et al., 2010). The outer disk radius is 20 R⊙. The "shell" region (light blue) is the zone of the accretion disk that can absorb the light of the gainer. This region would produce an absorption that ranges from −200 too +200 km/s in vrad. Given an absorption profile, we can measure the radial velocity at its edge. Knowing the radius of the gainer, we can estimate the inner radius of the region using
 (B.2)
(B.2)
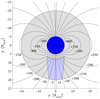 |
Fig. B.1. Isovelocity contours for a Keplerian disk. The labels show vrad in km/s. The inner radius was set to 8 R⊙, while the outer to 20 R⊙. |
which has the geometrical indication of the intersection between a keplerian isovelocity contour and the line x = Rb.
All Tables
Summary of all the species analyzed in this work, with their region of formation and variability.
Optical observations. The wavelength coverage of the spectrographs are 3500-9200 Å(FEROS), 3872-6943 Å(SOPHIE), 3780-6910 Å(HARPS). The resolution are R ∼ 48000, R ∼ 70000, R ∼ 120000 respectively.
All Figures
|
Fig. 1. Schematic representation of the canonical model for AU Mon. The cross indicates the center of mass. The red line is the stream, while the orange region is the impact site in the accretion disk. |
| In the text | |
|
Fig. 2. Balmer and He I lines variability with the long cycle. The green spectrum is at ϕ = 1027.392, ϕL = 0.391, while the black one is at ϕ = 1090.395, ϕL = 0.07. The line blueward of He I 4026 is He I 4009, while the one redward of He I 4471 is Mg II 4481. The spectra in the first four panels are continuum-normalized, while the He I 5876 and 6678 were normalized with the continuum level at −1500 km s−1. The units on the y-axes are arbitrary units of flux. |
| In the text | |
|
Fig. 3. New (red line) and Desmet et al. (2010; blue line) model for the Hγ, Hδ, He I 4026, and 4471 lines. The green and black spectra are the same as in Fig. 2. |
| In the text | |
|
Fig. 4. Selected lines in the far UV spectrum of AU Mon. The black spectrum is IUE SWP03758 (Table A.2), which is in the bright state of the long cycle. |
| In the text | |
|
Fig. 5. Comparison between model and observations for selected accretion disk lines. |
| In the text | |
|
Fig. 6. Four panels plot showing the optical lines linked to the accretion disk. The gray line, where present, marks the position of the second line of the doublets. The green line in the last panel marks the radial velocity of the G star. The spectra are at ϕ = 0.188, ϕL = 0.439, median filtered to three points. The lines in the plot of the Si II 4128, 4130 doublet are He I 4121, and 4144. |
| In the text | |
|
Fig. 7. Orbital variation for the Al II 1671 in the interval 0.25 < ϕ < 0.75 in IUE spectra. The red line is the new model. The spectra were normalized by using the flux level at −1000 km s−1. |
| In the text | |
|
Fig. 8. He I 5876 and 6678 after ϕ = 0.75. The black reference profile (at ϕ = 0.498) is in fact a secondary eclipse profile. The spectra were shifted in the frame of the B star. |
| In the text | |
|
Fig. 9. Contrast between two IUE spectra at epoch 498 for the N V, Si IV, and Al III doublets. The black spectrum is at ϕ = 0.364, the green one at ϕ = 0.633. The red line is the new model. |
| In the text | |
|
Fig. 10. IUE spectra of the N V doublet at epoch 498, with ϕL ≈ 0.29 − 0.3. The spectra were normalized by using the flux level at −1600 km s−1. Each spectra is shifted by a constant. |
| In the text | |
|
Fig. 11. Comparison between bright (green) and faint state (black) for the Si IV doublet profiles (IUE spectra). The spectra were normalized by using the flux level at −1800 km s−1. Each spectra is shifted by a constant. |
| In the text | |
|
Fig. 12. P Cygni profile seen in the Si IV and Al III doublet near second quadrature (IUE spectra). |
| In the text | |
|
Fig. 13. Model comparison with the Si IV doublet in the bright state of the long cycle (IUE spectra). The spectra were normalized by using the flux level at −1800 km s−1. Each spectra is shifted by a constant. |
| In the text | |
|
Fig. 14. Si IV and Al III doublets together with Si II 1265 and Al II 1671 in two IUE spectra at epoch 509. The black spectrum is at ϕ = 0.603, the red at ϕ = 0.869. |
| In the text | |
|
Fig. 15. Blueshifted events (green) observed in the Si IV doublet, compared with spectra before or after (black). The spectra were normalized by using the flux level at −1800 km s−1. |
| In the text | |
|
Fig. 16. He I 5876 profiles at cycle 1090, ϕL = 0.07. The spectra were normalized using the flux level at −1500 km s−1. The dashed line signals the peaks at −350 km s−1. |
| In the text | |
|
Fig. 17. He I 5876 and 6678 during primary eclipse, compared with the new model. |
| In the text | |
|
Fig. 18. Flux difference between bright and faint states. The faint state spectrum is the union of the IUE SWP spectrum at ϕ = 509.509 and the LWP one at ϕ = 161.496, while the bright state spectrum is the union of ϕ = 106.509 (SWP) and ϕ = 106.506 (LWP). In the blue line, a scattering component in the form of Eq. (3) was added to the faint state spectra, with λ0 = 2000 Å, F0 the flux level at λ0 and C = 0.13 to match the bright state continuum (see Sect. 4.2). The spectra were smoothed with a 15 points median filter to remove the noise. The inset shows the flux ratio between the two states, binned to 10 Å. |
| In the text | |
|
Fig. 19. Comparison between spectra at different long phases. The epoch 106 is at bright state (ϕL = 0.844), while the two spectra at ϕ = 509.509 (IUE SWP) and ϕ = 161.496 (LWP) are at faint state (ϕL = 0.587 and ϕL = 0.31). The spectra in the two lower panels are the same as the Al II ones. |
| In the text | |
|
Fig. 20. Absorption lines from metallic ions. The inset shows the Mg II satellite lines. The spectra were smoothed with a five point boxcar filter. |
| In the text | |
|
Fig. 21. Al II 1671 vs. Al III 1855 and Si II 1527 vs. Si IV 1394, compared at bright (upper profiles) and faint (lower profiles) state (IUE spectra). The black profiles are the Al II and Si II lines. The spectra were median-filtered to three points and normalized with the continuum level at −1800 km s−1. |
| In the text | |
|
Fig. 22. Selected optical lines which vary in the long cycle. Since the continuum is rapidly varying, the lines were normalized with the continuum level at −1500, −1000, −1000, −600 km s−1 respectively. |
| In the text | |
|
Fig. B.1. Isovelocity contours for a Keplerian disk. The labels show vrad in km/s. The inner radius was set to 8 R⊙, while the outer to 20 R⊙. |
| In the text | |
Current usage metrics show cumulative count of Article Views (full-text article views including HTML views, PDF and ePub downloads, according to the available data) and Abstracts Views on Vision4Press platform.
Data correspond to usage on the plateform after 2015. The current usage metrics is available 48-96 hours after online publication and is updated daily on week days.
Initial download of the metrics may take a while.