Open Access
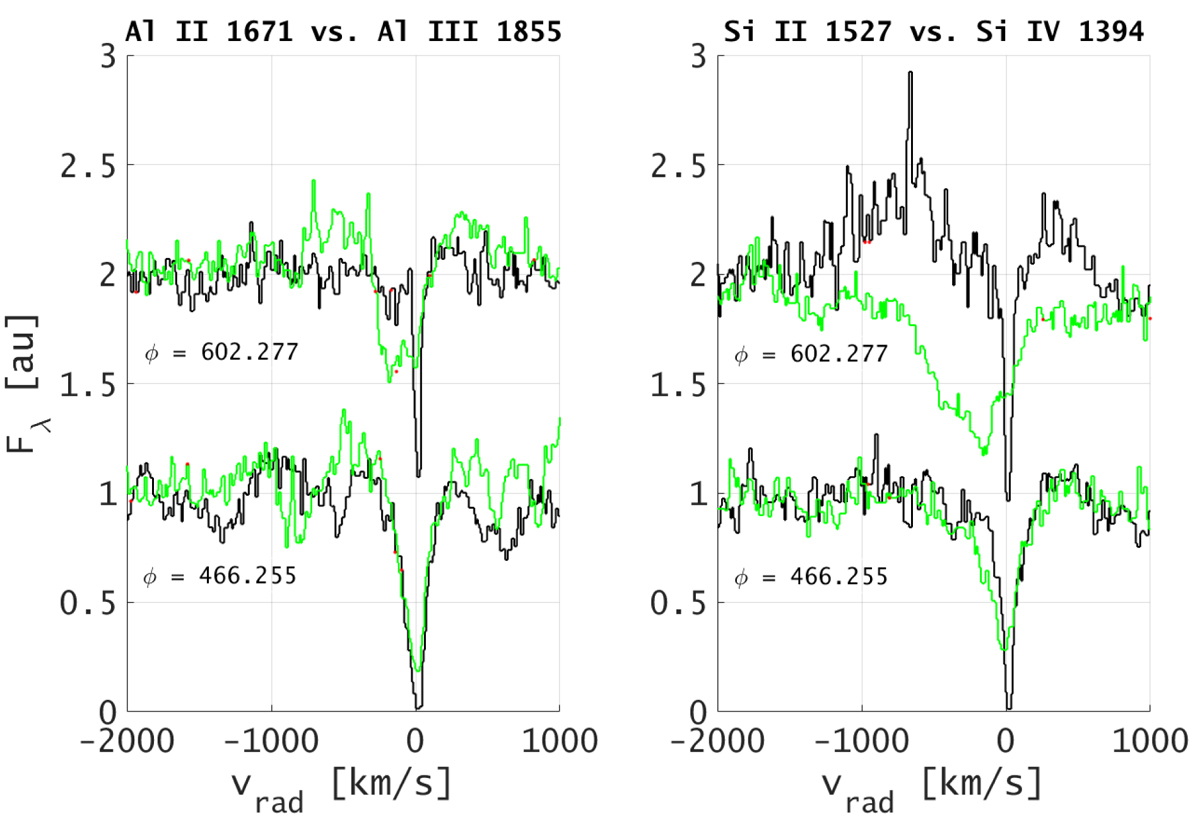
Fig. 21.
Download original image
Al II 1671 vs. Al III 1855 and Si II 1527 vs. Si IV 1394, compared at bright (upper profiles) and faint (lower profiles) state (IUE spectra). The black profiles are the Al II and Si II lines. The spectra were median-filtered to three points and normalized with the continuum level at −1800 km s−1.
Current usage metrics show cumulative count of Article Views (full-text article views including HTML views, PDF and ePub downloads, according to the available data) and Abstracts Views on Vision4Press platform.
Data correspond to usage on the plateform after 2015. The current usage metrics is available 48-96 hours after online publication and is updated daily on week days.
Initial download of the metrics may take a while.