Open Access
Fig. 1.
Download original image
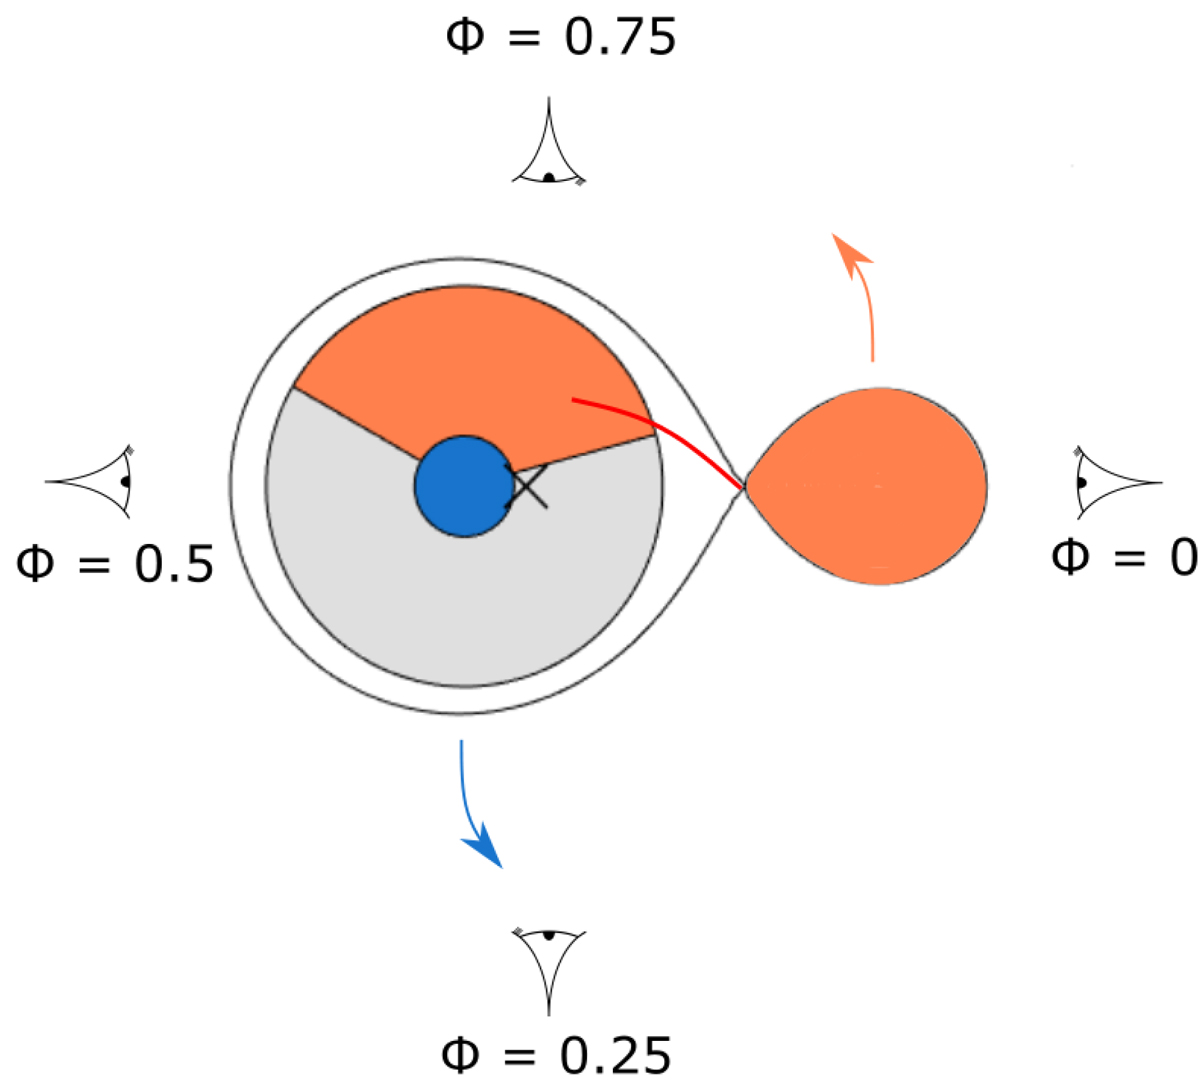
Schematic representation of the canonical model for AU Mon. The cross indicates the center of mass. The red line is the stream, while the orange region is the impact site in the accretion disk.
Current usage metrics show cumulative count of Article Views (full-text article views including HTML views, PDF and ePub downloads, according to the available data) and Abstracts Views on Vision4Press platform.
Data correspond to usage on the plateform after 2015. The current usage metrics is available 48-96 hours after online publication and is updated daily on week days.
Initial download of the metrics may take a while.