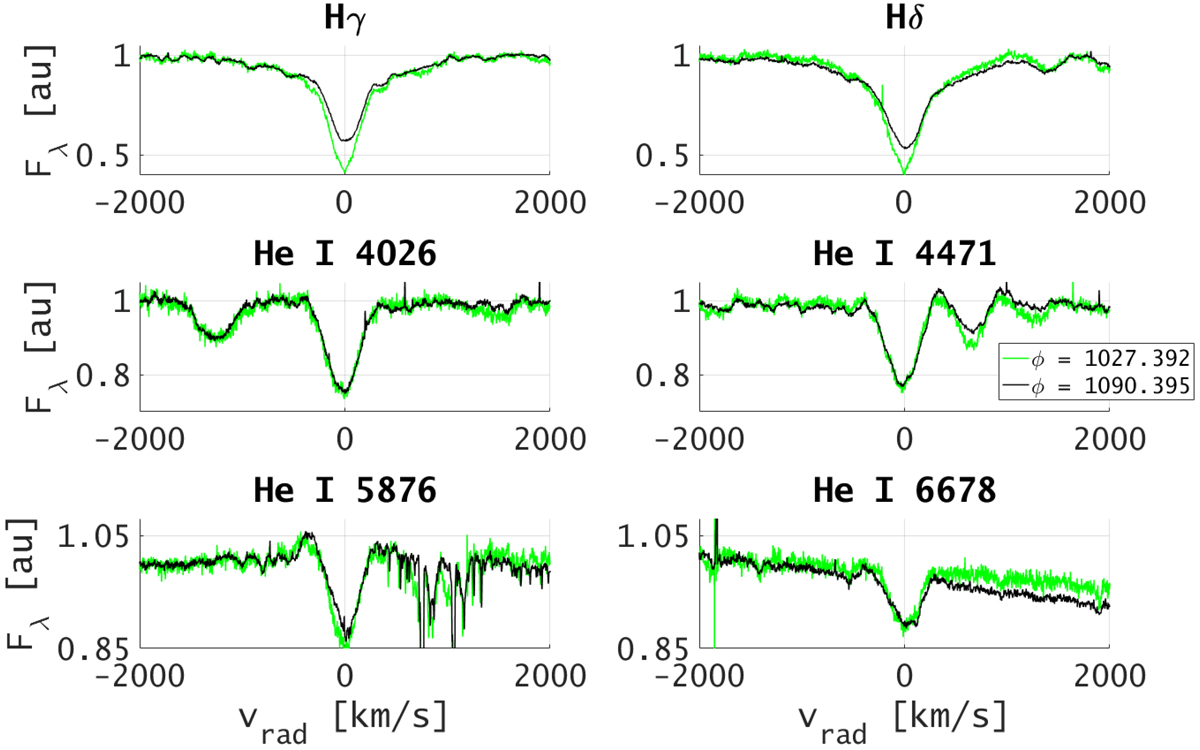
Fig. 2.
Download original image
Balmer and He I lines variability with the long cycle. The green spectrum is at ϕ = 1027.392, ϕL = 0.391, while the black one is at ϕ = 1090.395, ϕL = 0.07. The line blueward of He I 4026 is He I 4009, while the one redward of He I 4471 is Mg II 4481. The spectra in the first four panels are continuum-normalized, while the He I 5876 and 6678 were normalized with the continuum level at −1500 km s−1. The units on the y-axes are arbitrary units of flux.
Current usage metrics show cumulative count of Article Views (full-text article views including HTML views, PDF and ePub downloads, according to the available data) and Abstracts Views on Vision4Press platform.
Data correspond to usage on the plateform after 2015. The current usage metrics is available 48-96 hours after online publication and is updated daily on week days.
Initial download of the metrics may take a while.