Fig. 1
Download original image
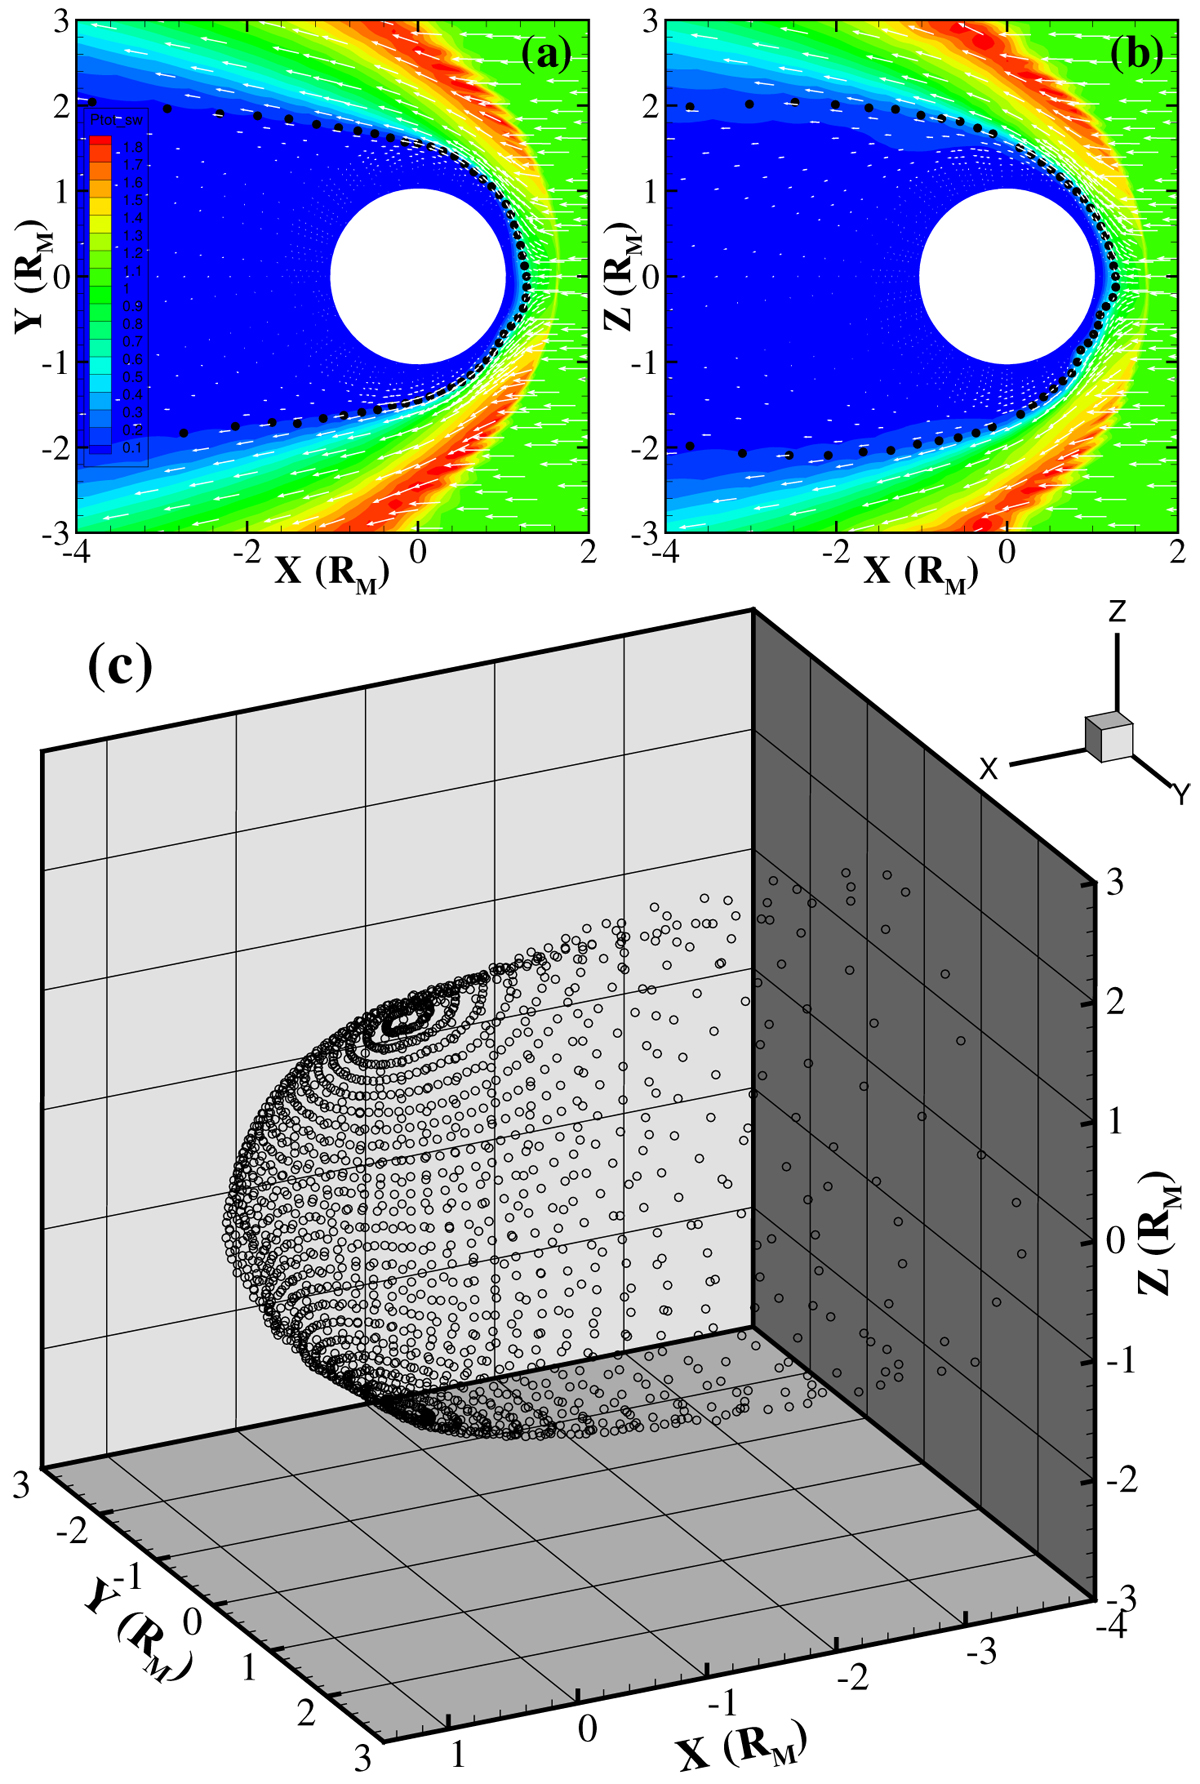
Example of identified locations of the Martian MPB from simulation data on the X−Y plane (panel a), the X−Z plane (panel b), and in 3D (panel c) in the MSO coordinate system. The solar wind conditions for this example are BX = −1.6776 nT, BY = 2.4871 nT, BZ = 0 nT, and Pd = 1.06 nPa (n = 4.0 cm−3, VX = −400.0 km s−1 ). The black circles are the determined MPB locations in each panel. Panels a and b: color code displays the total pressure of solar wind (Ptot_sw = Pth_sw + Pd_sw in nPa) and the white arrows represent the vectors of the solar wind velocity.
Current usage metrics show cumulative count of Article Views (full-text article views including HTML views, PDF and ePub downloads, according to the available data) and Abstracts Views on Vision4Press platform.
Data correspond to usage on the plateform after 2015. The current usage metrics is available 48-96 hours after online publication and is updated daily on week days.
Initial download of the metrics may take a while.