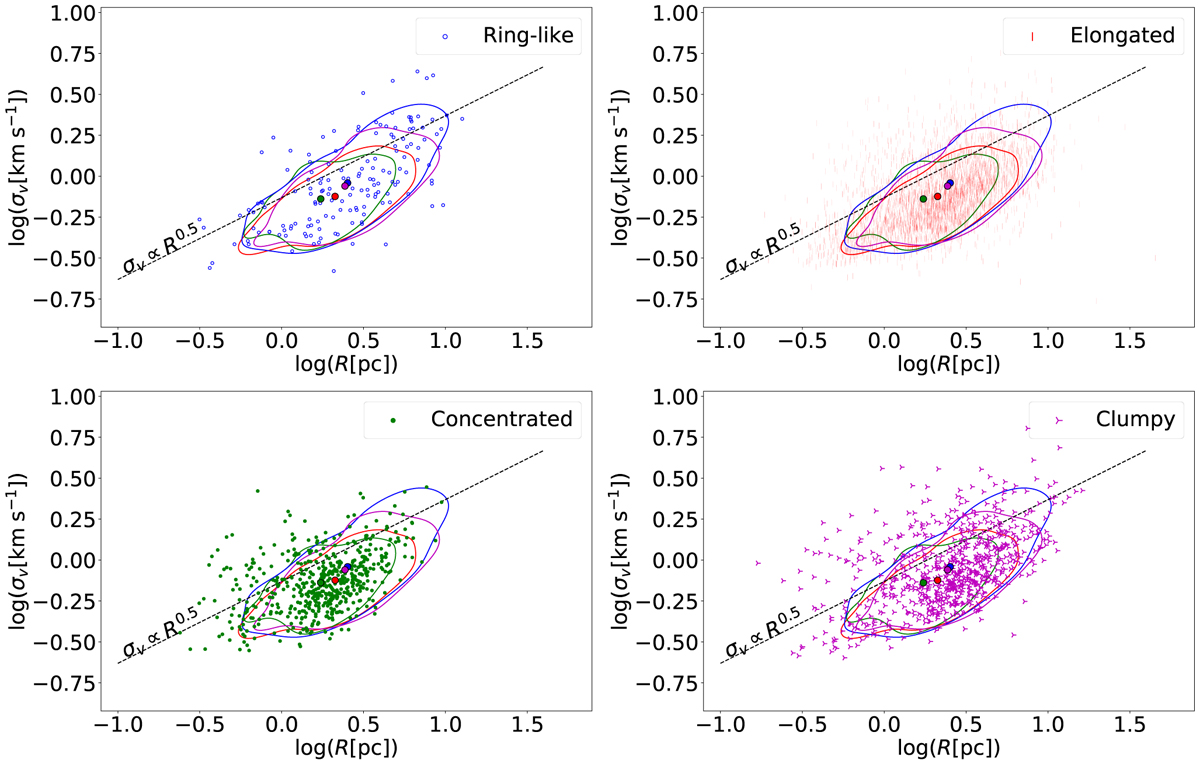
Fig. 7
Download original image
Size-linewidth relation (συ versus R) using the MR sample. The dashed line represents Larson’s first relation (Larson 1981; Solomon et al. 1987). The different colours represent four cloud classes (Sect. 3); ring-like clouds are represented in blue, elongated clouds in red, concentrated clouds in green, and clumpy clouds in magenta. The contours include 68% of the data (1–sigma level) and the small circles represent centroids (means) of the distributions. The expected slope for the relation is 0.5 (dashed black line) (Larson 1981).
Current usage metrics show cumulative count of Article Views (full-text article views including HTML views, PDF and ePub downloads, according to the available data) and Abstracts Views on Vision4Press platform.
Data correspond to usage on the plateform after 2015. The current usage metrics is available 48-96 hours after online publication and is updated daily on week days.
Initial download of the metrics may take a while.