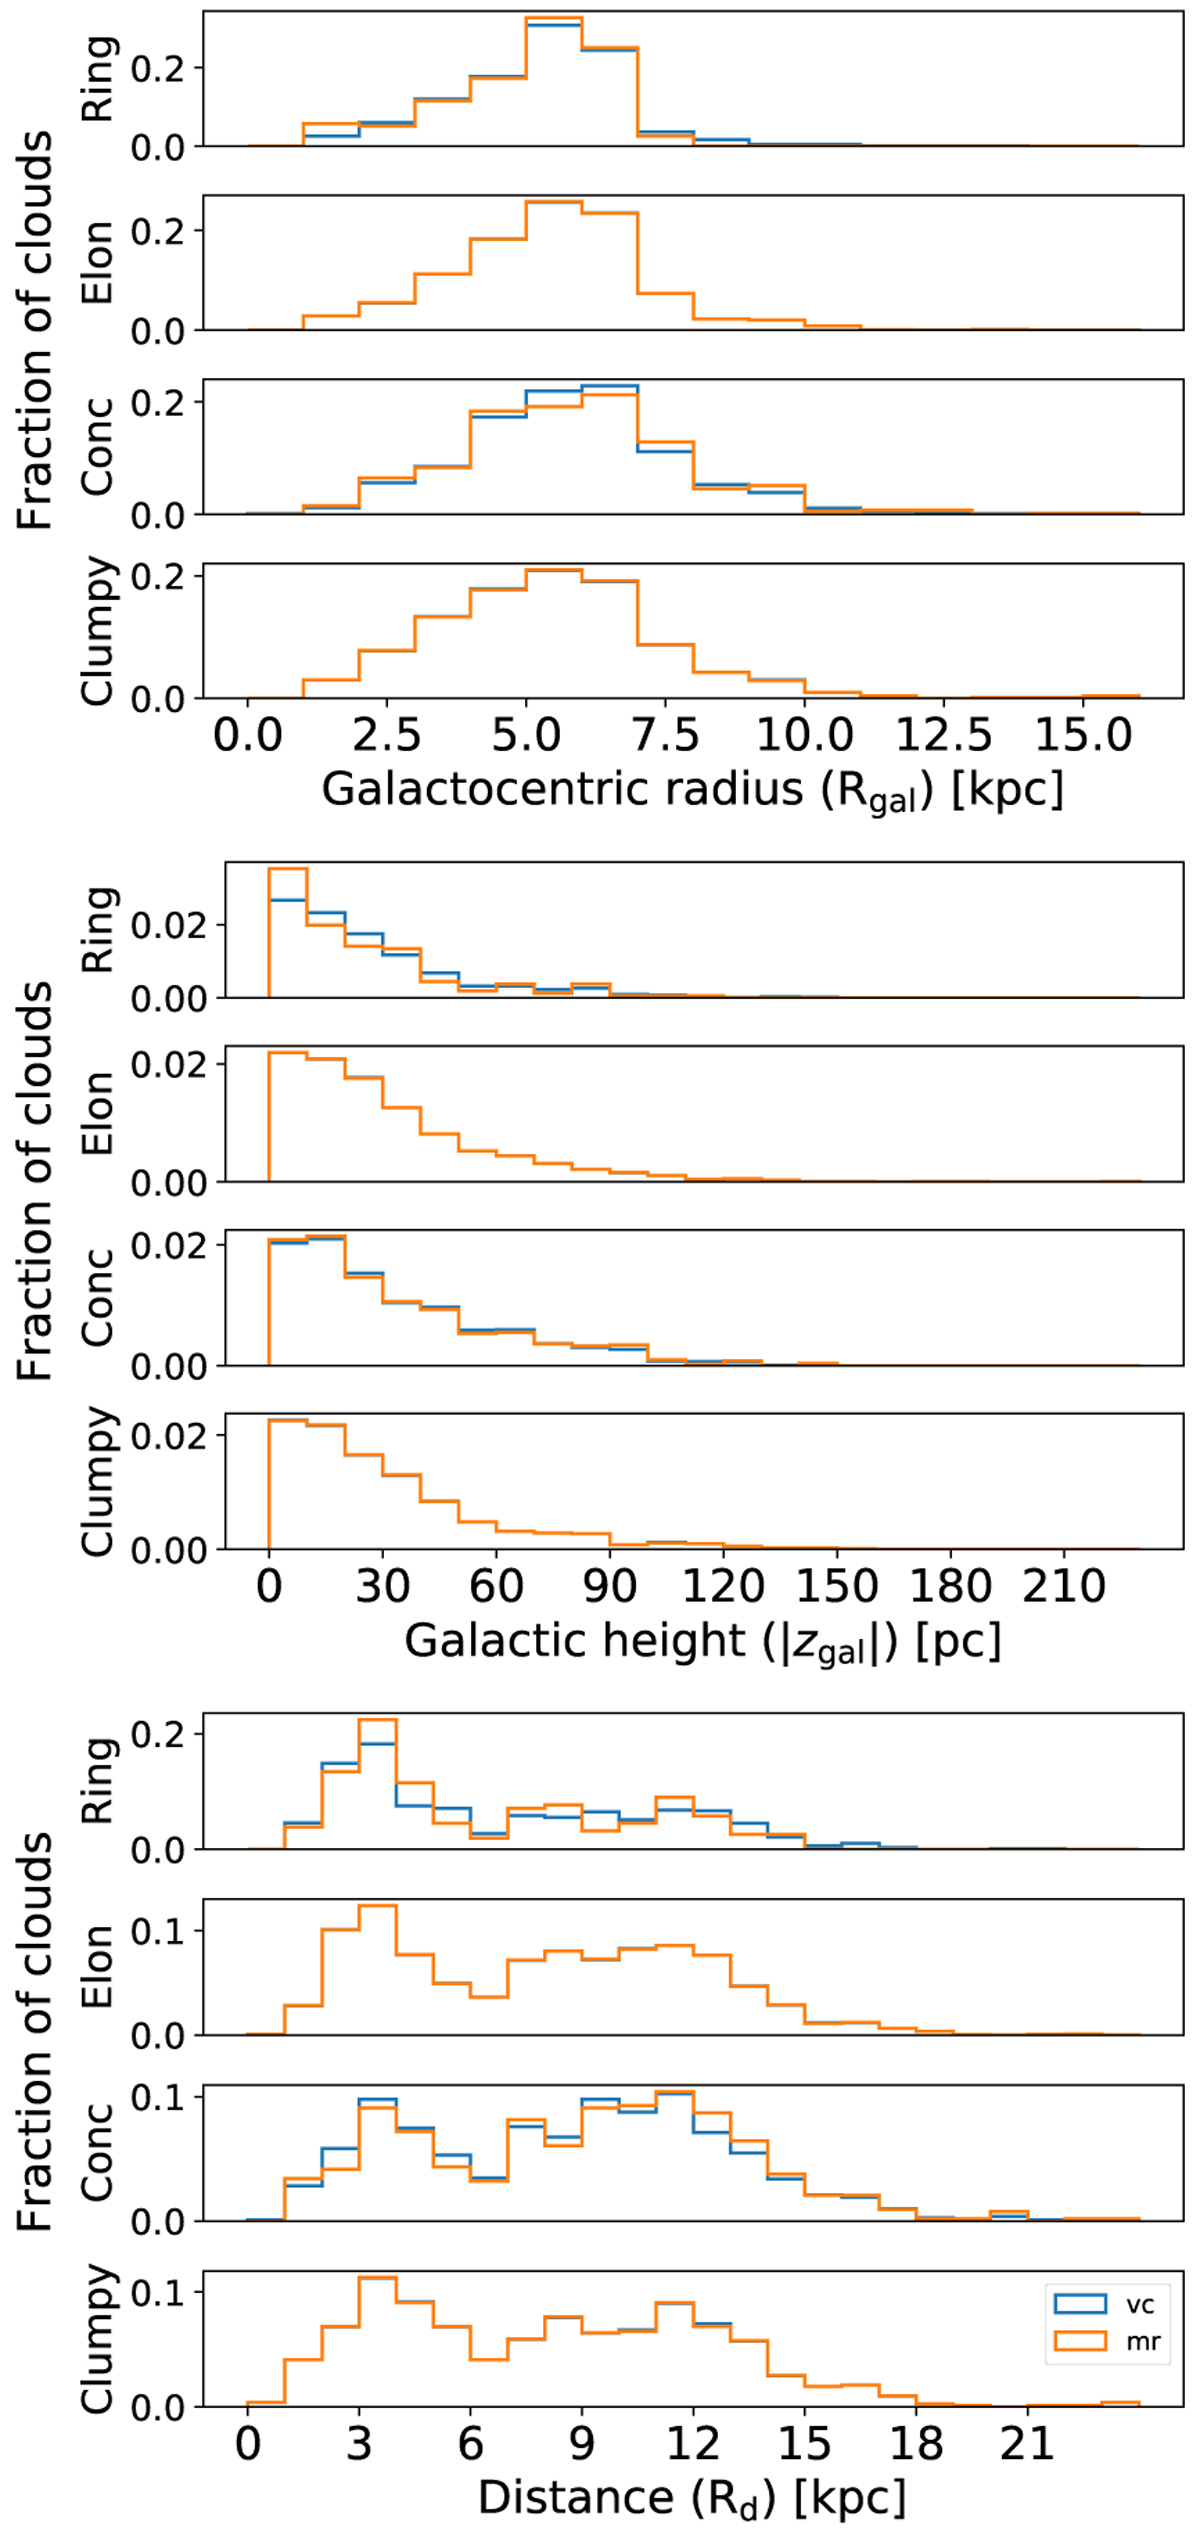
Fig. 6
Download original image
Histogram (normalised) for distribution of clouds with respect to Galactocentric radius (top) Galactic height (zgal) (middle), and heliocentric distance (bottom). The histograms represent the ratio of clouds in each bin to the total number of clouds in all the bins. The bin width is 1 kpc for the heliocentric distance and Galactocentric radius plots, and 1 pc for the zgal histogram. Blue represents the VC sample and orange represents the MR sample. The cloud morphologies from top to bottom represent ring-like clouds (Ring), elongated clouds (Elon), concentrated clouds (Cone), and clumpy clouds (Clumpy).
Current usage metrics show cumulative count of Article Views (full-text article views including HTML views, PDF and ePub downloads, according to the available data) and Abstracts Views on Vision4Press platform.
Data correspond to usage on the plateform after 2015. The current usage metrics is available 48-96 hours after online publication and is updated daily on week days.
Initial download of the metrics may take a while.