Fig. 1
Download original image
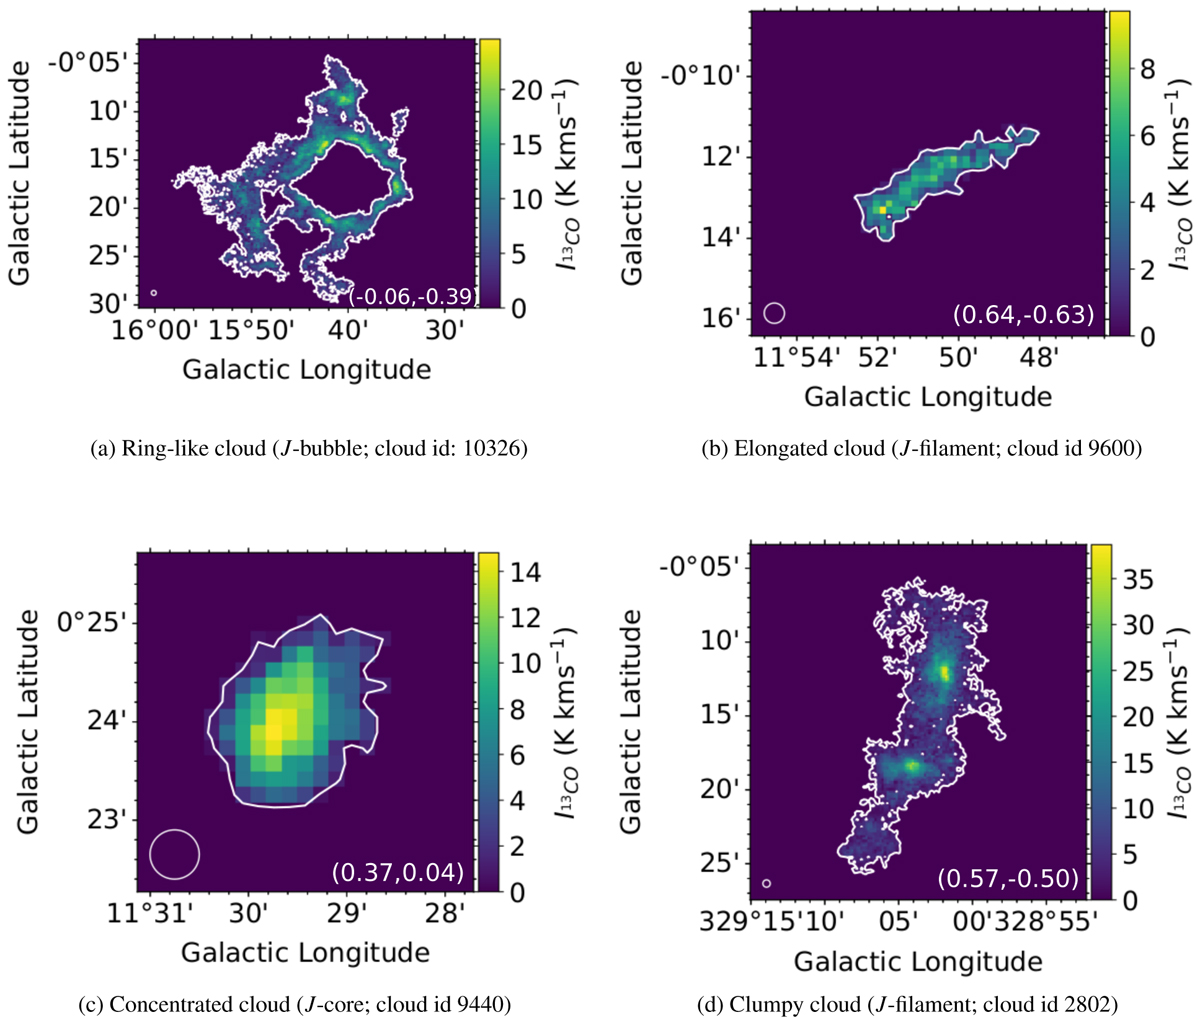
Examples of different cloud morphologies. The images are integrated intensity (moment 0) maps of the 13CO (2−1) transition. The numbers in the right bottom corner of the images represent the J1 and the J2 moments (J plots algorithm), respectively. The colour bars represent the 13CO integrated intensity in K kms–1. The white contours represent the cloud edge. The white circles at the bottom left of the figures represent the telescope beam size.
Current usage metrics show cumulative count of Article Views (full-text article views including HTML views, PDF and ePub downloads, according to the available data) and Abstracts Views on Vision4Press platform.
Data correspond to usage on the plateform after 2015. The current usage metrics is available 48-96 hours after online publication and is updated daily on week days.
Initial download of the metrics may take a while.